
Abstract
Background
Albuminuria is an early marker of kidney damage and an essential component of chronic kidney disease (CKD) risk stratification. Quantitative measurement of the urine albumin-to-creatinine ratio (ACR) in a spot, preferably morning, urine sample is the recommended standard. In low-throughput laboratories and point-of-care settings, semi-quantitative strip tests are sometimes used for screening, although their diagnostic performance is limited.
Objective
To evaluate the clinical utility of a commercial semi-quantitative urine strip test for albumin and creatinine by comparison with quantitative ACR measurement.
Methods
Eighty-four spot urine samples were analysed. Semi-quantitative ACR categories were obtained using an ACON Mission strip test, according to the manufacturer’s instructions. Quantitative ACR was measured on a Beckman Coulter AU480 analyser (immunochemical albumin, enzymatic creatinine). Diagnostic performance was assessed using sensitivity, specificity, positive and negative predictive values, Matthew’s correlation coefficient (MCC) and Cohen’s κ. A decision threshold of 3 mg/mmol (30 mg/g) was applied.
Results
Sensitivity for detecting albuminuria (≥3 mg/mmol, ≥30 mg/g) was 80.6% (95% CI 62.5–92.5) and specificity was 60.4% (95% CI 46.0–73.5). The negative and positive predictive values were 84.2% and 54.3%, respectively. Overall categorical agreement across A1–A3 was 63.1% (κ = 0.334; MCC = 0.398). Most discrepancies reflected overclassification of low-grade albuminuria by the strip test in samples classified as normoalbuminuric by quantitative ACR.
Conclusions
The semi-quantitative strip test shows high sensitivity with moderate specificity and is suitable for screening for albuminuria. Positive results should be confirmed by quantitative ACR measurement in accordance with current guidelines.
Keywords
Introduction
Albuminuria is an early marker of kidney damage and a core component of risk stratification in chronic kidney disease (CKD). Current KDIGO guidance recommends quantitative measurement of the urine albumin-to-creatinine ratio (ACR) in a spot, preferably morning, urine sample for both diagnosis and monitoring of albuminuria. In routine practice, especially in low-throughput laboratories and point-of-care settings, semi-quantitative urine strip tests are sometimes used as rapid screening tools; however, their diagnostic accuracy is inherently limited compared with quantitative laboratory methods.1–6
During local implementation of a semi-quantitative ACR strip test in a satellite laboratory, discrepancies were observed when the strip readouts were compared with control materials used on a biochemical analyser. This prompted a verification study against patient samples to assess whether the strip test could reliably serve as a screening tool for albuminuria while deferring diagnostic confirmation to a quantitative ACR measurement.
The present study compares a commercial semi-quantitative strip test for urinary albumin and creatinine (method A) with quantitative ACR measurement on a biochemical analyser (method B), focussing on clinical screening metrics and categorical agreement across albuminuria stages (A1–A3). Categories A1–A3 are a classification of albuminuria, where A1 is normoalbuminuria with ACR <3 mg/mmol (<30 mg/g), A2 is moderately increased albuminuria with ACR 3–30 mg/mmol (30–300 mg/g), and A3 is severely increased albuminuria with ACR >30 mg/mmol (>300 mg/g). Our aim was to determine whether the strip’s performance profile is acceptable for screening – prioritising sensitivity and negative predictive value (NPV) – with the understanding that positive results require confirmation by quantitative ACR in line with guideline-based practice.
Methods
Study design and samples
We conducted a method comparison study using n = 84 spot urine samples (preferentially morning) collected during routine clinical care. Samples with obvious pre-analytical issues (visible contamination, storage/transport deviating from the manufacturer’s instructions for use [IFU]) were excluded.
Index method (semi-quantitative strip test; Method A)
A commercial semi-quantitative urine strip system (ACON Mission) was used to estimate urinary albumin and creatinine and provide a semi-quantitative ACR category. Readouts followed the manufacturer’s IFU (timing, lighting). Each strip was double-read by two laboratory professionals; discrepant reads were resolved by consensus. Testing was performed using a single lot supplied by the manufacturer.
Reference method (quantitative ACR; Method B)
Quantitative ACR was measured on a Beckman Coulter AU480 biochemical analyser. Albumin was measured by an immunochemical method and creatinine by an enzymatic method. Calibration and internal quality control (IQC) followed the analyser manufacturer’s IFU. ACR results were expressed in mg/g.
Endpoints and decision thresholds
The primary endpoint was the sensitivity of Method A to detect albuminuria (A2/A3) relative to quantitative ACR at a 3 mg/mmol (30 mg/g) decision threshold. Secondary endpoints included specificity, PPV, NPV (all with exact 95% CIs), Matthew’s correlation coefficient (MCC) and categorical agreement across A1–A3 with Cohen’s κ. We also examined the 3 × 3 confusion matrix (A vs B). Pre-specified screening acceptance criteria were sensitivity ≥80%, NPV ≥85%, κ ≥ 0.30; positive screens require quantitative confirmation and, if abnormal, repeat testing after ≥3 months.
Statistical analysis
For binary classification (A2/A3 vs A1), we calculated sensitivity, specificity, PPV and NPV with Clopper–Pearson exact 95% confidence intervals. We computed MCC for the binary task and Cohen’s κ (unweighted) with 95% CI for the three-class (A1–A3) agreement. A 3 × 3 contingency table was generated to characterise misclassifications. Analyses were performed on the complete dataset (n = 84).
Results
Sample distribution and categorical agreement
Across the 84 samples, class distributions were as follows: • •
Overall, three-class agreement (identical category A1–A3) was 53/84 = 63.1% with Cohen’s κ = 0.334, indicating moderate agreement beyond chance. The 3 × 3 matrix showed that the largest contribution to discordance arose from A1 calls by Method A when Method B classified as A1 (low-grade albuminuria vs normoalbuminuria) – specifically, 20 instances where Method A assigned category A2 at Method B. Concordant pairs predominated for A1–B1 = 32, A2–B2 = 20, and A3–B3 = 1.
Binary diagnostic performance (A2/A3 vs A1)
Using 30 mg/g as the decision threshold: • S • S • • N • M
Categorical Agreement Between Semi-quantitative Strip Test (Method A) and Quantitative ACR (Method B).
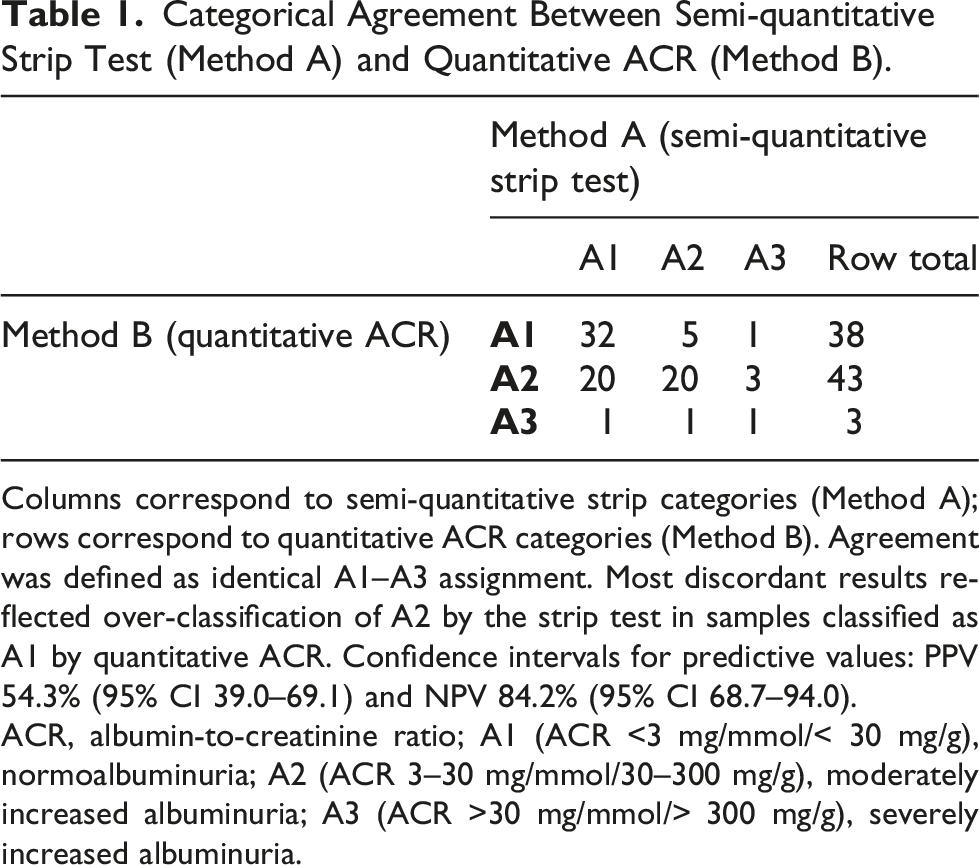
Columns correspond to semi-quantitative strip categories (Method A); rows correspond to quantitative ACR categories (Method B). Agreement was defined as identical A1–A3 assignment. Most discordant results reflected over-classification of A2 by the strip test in samples classified as A1 by quantitative ACR. Confidence intervals for predictive values: PPV 54.3% (95% CI 39.0–69.1) and NPV 84.2% (95% CI 68.7–94.0).
ACR, albumin-to-creatinine ratio; A1 (ACR <3 mg/mmol/< 30 mg/g), normoalbuminuria; A2 (ACR 3–30 mg/mmol/30–300 mg/g), moderately increased albuminuria; A3 (ACR >30 mg/mmol/> 300 mg/g), severely increased albuminuria.
Discussion
This study demonstrates that a semi-quantitative ACR strip test provides high sensitivity with moderate specificity for detecting albuminuria at the 3 mg/mmol (30 mg/g) threshold, which is consistent with the role of strip testing as a screening rather than confirmatory approach. The observed performance profile – NPV 84.2% with sensitivity 80.6% – supports its use to minimise false negatives (i.e. missed A2/A3) at the cost of more false positives, provided that all positive or borderline screens are reflexed to quantitative ACR.7,8
A growing body of evidence supports the use of dipstick- and strip-based albumin–creatinine ratio (ACR) readouts as screening tools for albuminuria. In a systematic review and meta-analysis, Mejía et al. reported pooled sensitivity of approximately 0.82 and specificity of 0.88 for dipstick detection of albuminuria at the 3 mg/mmol (30 mg/g) ACR threshold, while highlighting substantial between-study heterogeneity and very low certainty of evidence due to differences in strip technologies, study populations, and reference methods. Complementing these aggregate data, Lambrecht et al. demonstrated in two large cohorts that semi-quantitative ACR obtained from automated urine test strip analysis achieves screening-level performance (sensitivity 78–90% and specificity >90% at 3 mg/mmol (30 mg/g)) and should trigger reflex quantitative testing rather than serve as a standalone diagnostic. Taken together, these reports justify context-specific verification of strip-based ACR in routine practice and underpin our study design.1,2
The predominant discordance pattern (apparent low-grade albuminuria on the strip in samples classified as normoalbuminuric by quantitative ACR) aligns with the known limitations of semi-quantitative methods at low concentrations. In our reference method, enzymatic creatinine was used (rather than Jaffe), helping to mitigate common interferences and improving the reliability of the quantitative ACR.1,8
From a service design perspective, the results support a ‘screening → reflex quantitative ACR’ algorithm in low-throughput and POCT environments. Such an approach aligns with guideline principles: use a quantitative ACR for diagnosis and monitoring; consider repeat testing after ≥3 months to confirm persistence of abnormal albuminuria; and avoid relying on strip tests for treatment monitoring. Implementation should include pre-analytical standardisation (preferably morning spot urine), operator training for semi-quantitative readouts, and ongoing quality indicators (e.g. sensitivity, NPV, κ) to ensure screening performance remains within predefined acceptance limits.1,8,9
Strengths and limitations
Strengths include evaluation on patient samples spanning clinically relevant ACR ranges, double-reading of strips with adjudication, and the use of comprehensive diagnostic metrics (including κ and MCC) beyond simple sensitivity/specificity. The sample size (n = 84) reflects a targeted step-2, patient-sample verification during implementation in a satellite laboratory, consistent with internal validation practice for commercial IVDs; consecutive routine samples were enrolled to span A1–A3 categories and to provide acceptable precision around screening sensitivity at the 3 mg/mmol (30 mg/g) threshold. Limitations include evaluation with a single strip lot and the semi-quantitative nature of Method A, which intrinsically constrains precision near the decision threshold. It should be noted that strip-based ACR testing in this study was performed by trained laboratory professionals under controlled conditions (an optimal-use scenario); therefore, diagnostic performance may be lower in real-world, non-laboratory point-of-care settings. 10
Clinical implications
Diagnostic Performance Metrics for Semi-quantitative Strip Test (Method A) Versus Quantitative ACR (Method B) at 30 mg/g
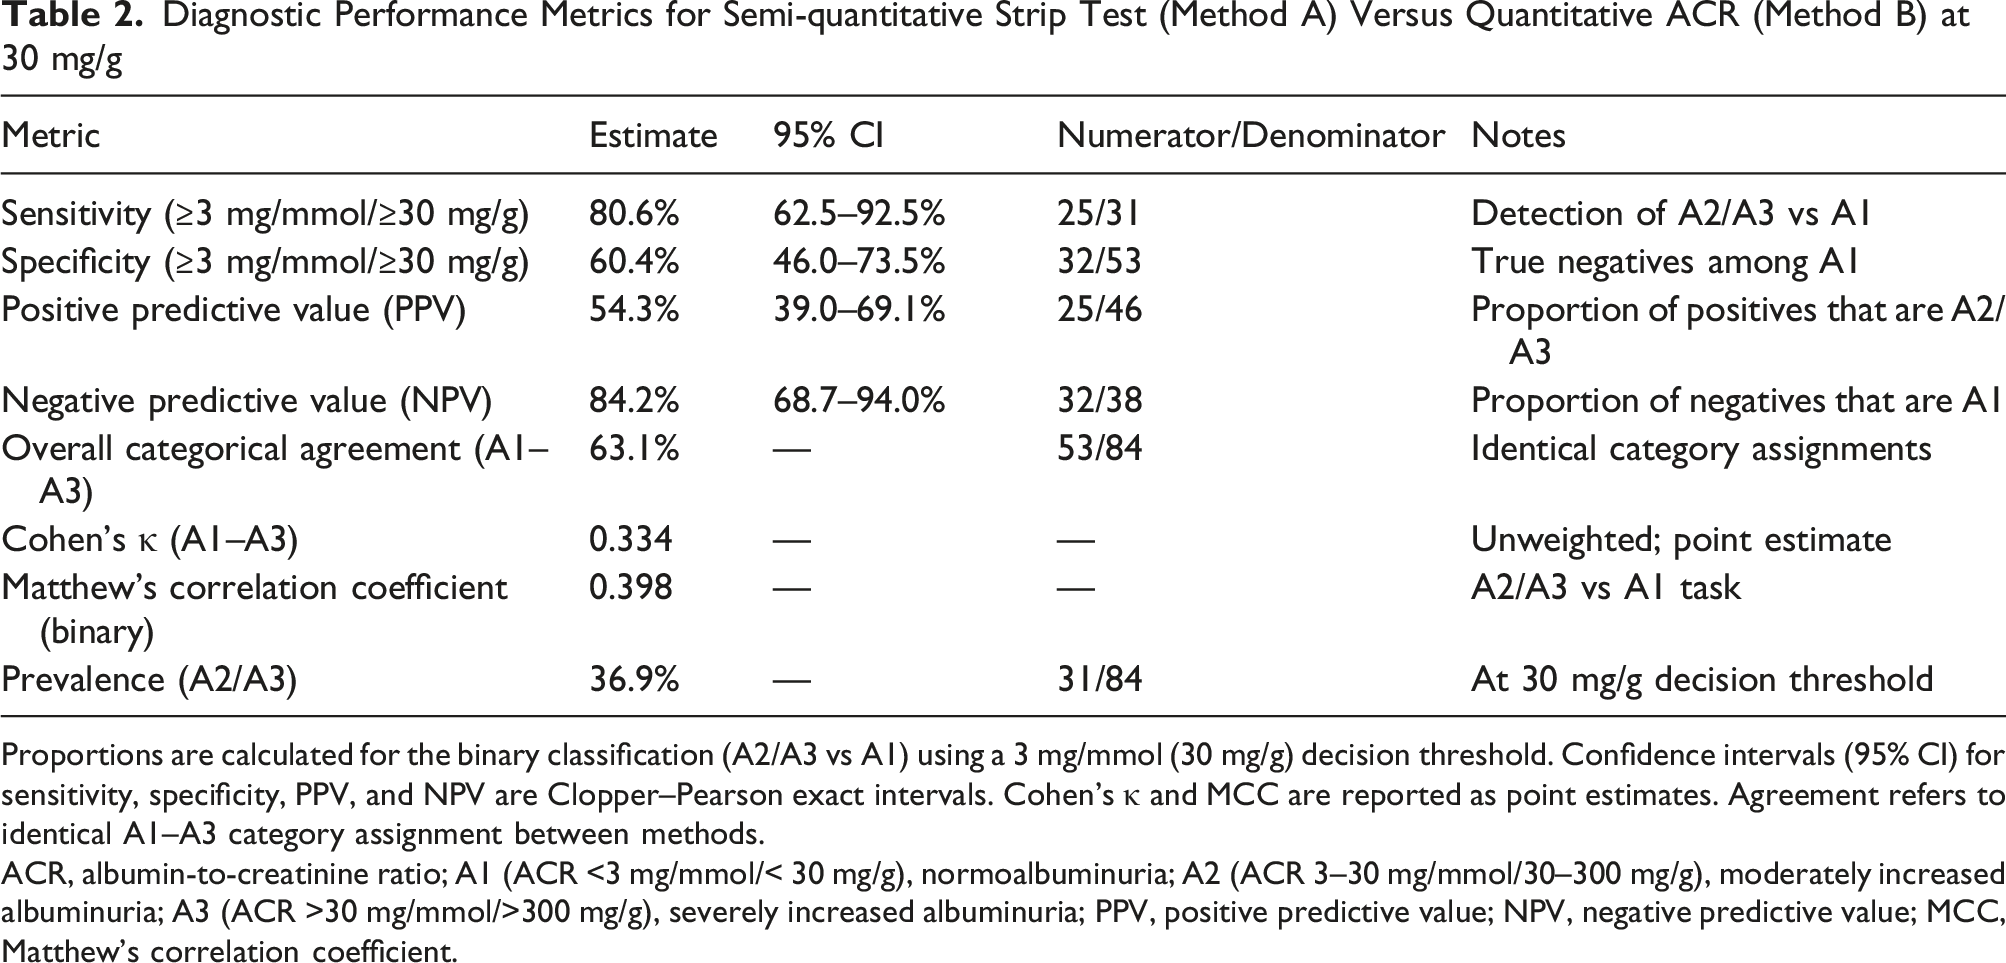
Proportions are calculated for the binary classification (A2/A3 vs A1) using a 3 mg/mmol (30 mg/g) decision threshold. Confidence intervals (95% CI) for sensitivity, specificity, PPV, and NPV are Clopper–Pearson exact intervals. Cohen’s κ and MCC are reported as point estimates. Agreement refers to identical A1–A3 category assignment between methods.
ACR, albumin-to-creatinine ratio; A1 (ACR <3 mg/mmol/< 30 mg/g), normoalbuminuria; A2 (ACR 3–30 mg/mmol/30–300 mg/g), moderately increased albuminuria; A3 (ACR >30 mg/mmol/>300 mg/g), severely increased albuminuria; PPV, positive predictive value; NPV, negative predictive value; MCC, Matthew’s correlation coefficient.
Conclusions
A semi-quantitative urine ACR strip test showed high sensitivity and moderate specificity relative to quantitative ACR, supporting its use as a screening tool for albuminuria. All positive or borderline results should undergo quantitative confirmation and, if abnormal, repeat testing after ≥3 months to establish persistence, in accordance with current guideline-based practice. As the evaluation was conducted under controlled laboratory conditions, performance in routine non-laboratory and point-of-care use may be lower. Clinicians and laboratory professionals should be aware of the analytical method used for urinary ACR assessment to ensure appropriate interpretation of results and to understand potential differences between semi-quantitative screening tests and quantitative laboratory measurements.
Footnotes
Funding
The authors received no financial support for the research, authorship, and/or publication of this article.
Declaration of conflicting interests
The authors declared no potential conflicts of interest with respect to the research, authorship, and/or publication of this article.
Data Availability Statement
Data supporting the findings of this study are available from the corresponding author upon reasonable request and subject to institutional policies.
Ethical approval
This study was conducted as a laboratory quality-improvement verification using de-identified residual urine samples collected during routine clinical care. The index method and the reference method were performed on the same samples within the same analytical episode, with no additional sampling and no use of identifiable patient data. In accordance with institutional policy and national regulations, formal ethics committee approval and patient consent were not required.
Contributions
AG conceived the study, supervised laboratory analyses, and drafted the manuscript.
DS performed laboratory testing and data collection, contributed to data interpretation, and co-drafted the manuscript.
KŻ, WM-W, SS, and PD performed laboratory testing and data collection and contributed to data interpretation.
All authors critically revised the manuscript and approved the final version.
Guarantor
Artur Gabrysiak.