



Abstract
Background
Statistical quality control continues to serve as the cornerstone for ensuring the accuracy and reliability of laboratory investigations. The current research aimed to evaluate the performance of biochemistry parameters using Six Sigma metrics in light of revised CLIA (Clinical Laboratory Improvement Amendments) total allowable error (TEa) 2024 guidelines, to guide the application of appropriate quality control strategies.
Methods
Quality control data for 20 chemistry parameters analyzed on the Fully Automated Biochemistry analyzer were evaluated using Six Sigma methodology. Internal quality control (IQC) and external quality assessment scheme (EQAS) data from December 2023 to May 2024 were collected. Coefficient of variation (%), bias (%) and TEa based on CLIA and Ricos biological variation guidelines were used to calculate sigma metrics. All quality control data were entered and analyzed using Microsoft Excel (Microsoft Corporation, Redmond, WA, USA).
Results
The laboratory showed excellent (≥6 sigma) performance for direct bilirubin and HDL-cholesterol. Albumin, alkaline phosphatase, aspartate transaminase, cholesterol, glucose, iron, potassium, total iron-binding capacity and triglycerides achieved minimum sigma performance standard (>3) at one level. However, the other chemistry parameters did not meet the minimum sigma performance standard across all assay range.
Conclusion
The laboratories need to reassess the performance of various biochemical parameters to redefine quality control protocols as the CLIA 2024 guidelines have tightened the total allowable error goals.
Introduction
A majority of tests critical in diagnosing and managing diseases are done in a biochemistry laboratory, making this an essential component of the healthcare system. Thus, the accuracy and reliability of tests performed in these laboratories are crucial for effective patient care.1,2 Throughout the analytical phase of laboratory testing, result reliability is maintained by means of internal quality control (IQC) and external quality control (EQC). By keeping a real time check on the analytical system, IQC offers assurance that laboratory results are dependable. In EQC, control samples supplied by independent agencies at scheduled intervals, typically once per month, are analyzed and reported in clinical biochemistry. The results are interpreted using either a standard deviation index or a Z score which shows how many standard deviations (SD) a control result differs from the expected mean for that material. A drawback of using internal and external QCs is that these do not directly quantify the number of analytical defects. Sigma metrics, in contrast, provide an estimate of assay performance (estimated defect rate) by integrating imprecision, bias and total allowable error (TEa). 3
The sigma methodology is an essential tool for assessing clinical biochemistry laboratory performance. These metrics aid in identifying areas that need to be improved in order to raise the overall quality of testing procedures. By computing sigma metrics for individual biochemical parameters, laboratories can determine each parameter’s performance level. 4 This systematic evaluation helps in determining appropriate IQC levels to enhance the performance of target analytes. 3 By integrating internal and external QC performances and using the total allowable error from various sources, laboratories can redefine analytical quality goals and improve overall quality management practices. 5
To calculate the number of quality control measures required to achieve desired quality, we used sigma metrics and principles for the assessment of quality of laboratory testing procedures in the current study. This study was undertaken in light of the recent revision of TEa guidelines by Clinical Laboratory Improvement Amendments (CLIA), with the aim of assessing the performance of our laboratory’s biochemistry parameters against the updated goals. We have evaluated various biochemical parameters on a sigma scale and calculated their sigma metrics. The resulting data will be used to apply Westgard guidelines, determining the appropriate Westgard rules and IQC levels to enhance target analyte performance.
Material and methods
The Dimension® Xpand® Plus Integrated Chemistry System (Siemens Healthineers, Forchheim, Germany) was used to analyze the quality control data of various biochemical parameters. The parameters included glucose, creatinine, urea, uric acid, electrolytes (sodium, potassium, phosphate, calcium), bilirubin (total and direct), aspartate transaminase, alkaline phosphatase, alanine transaminase, total protein, albumin, triglycerides, total cholesterol, high-density lipoprotein, iron and total iron-binding capacity. Two levels of IQC material provided by Randox were run twice a day. Out of the tri-level IQC material, Level 2 and Level 3 controls were selected as they better represent clinically relevant decision ranges. Level 1 corresponds to lower concentration ranges that are rarely encountered while running routine patient samples. The use of two levels of IQC run twice daily is in accordance with National Accreditation Board for Testing and Calibration Laboratories (NABL) recommendations for internal quality control. The percentage of coefficient of variation (CV%) was derived from this data. Additionally, data from monthly participation in RIQAS (Randox International Quality Assessment Scheme) based on peer-group mean values were used to calculate percent bias. The data for this study was collected from December 2023 to May 2024. IQC and RIQAS data were systematically recorded and managed utilizing Microsoft Excel (Microsoft Corporation, Redmond, WA, USA). For the selected parameters, sigma metrics were calculated based on Total Allowable Error (TEa), percentage of coefficient of variation (CV%), and percent bias, according to the following formulas:

Total allowable error (TEa)
The extent to which an individual result may differ from the reference value while still being acceptable. Analytical quality requirements (TEa) for the evaluated parameters were primarily adopted from CLIA 1992 and CLIA 2024 guidelines. For certain analytes, biological variation-based TEa values (Ricos 2014 database, currently hosted by the European Federation of Clinical Chemistry and Laboratory Medicine) were used. These include sodium, potassium and calcium as CLIA TEa values are expressed in absolute units and cannot be directly used for percentage-based sigma calculations. For direct bilirubin and TIBC, biological variation-derived TEa values were preferred as these provide clinically meaningful performance goals.6,7
Coefficient of variation %
The ratio of standard deviation (SD) to mean, expressed as a percentage. It measures the variability of an assay. The CV% was calculated as under:

Bias (%)
Systematic difference between result obtained by testing laboratory and expected result from peer-group mean. The bias percentage was calculated on the basis of RIQAS results, as under:

Quality goal index (QGI)
The QGI ratio was used to explore the underlying cause of reduced sigma performance, and to evaluate how well precision and bias align with established quality standard requirements. This distinction aided in identifying whether the problem resulted from imprecision, or inaccuracy, or from both. Calculation of the QGI ratio was done as below:

When QGI <0.8, it typically indicates an issue primarily related to imprecision, a QGI >1.2 points towards an inaccuracy problem. On the other hand, a QGI ranging from 0.8 to 1.2 suggests a combination of imprecision with inaccuracy.
Ethical review exemption was obtained from the Institute Ethics Committee for Biomedical and Health Research as the study did not use data from patient samples.
Results
The study assessed 20 biochemical parameters over the period from December 2023 to May 2024, employing sigma metrics for evaluation. As per laboratory protocol, two levels of IQC material provided by Randox, run twice daily, were used for calculation of mean, standard deviation (SD) and coefficient of variation (CV%). Bias (%) was calculated using data from the RIQAS, based on peer-group mean values.
Calculated CV % and Bias % for various clinical chemistry parameters.
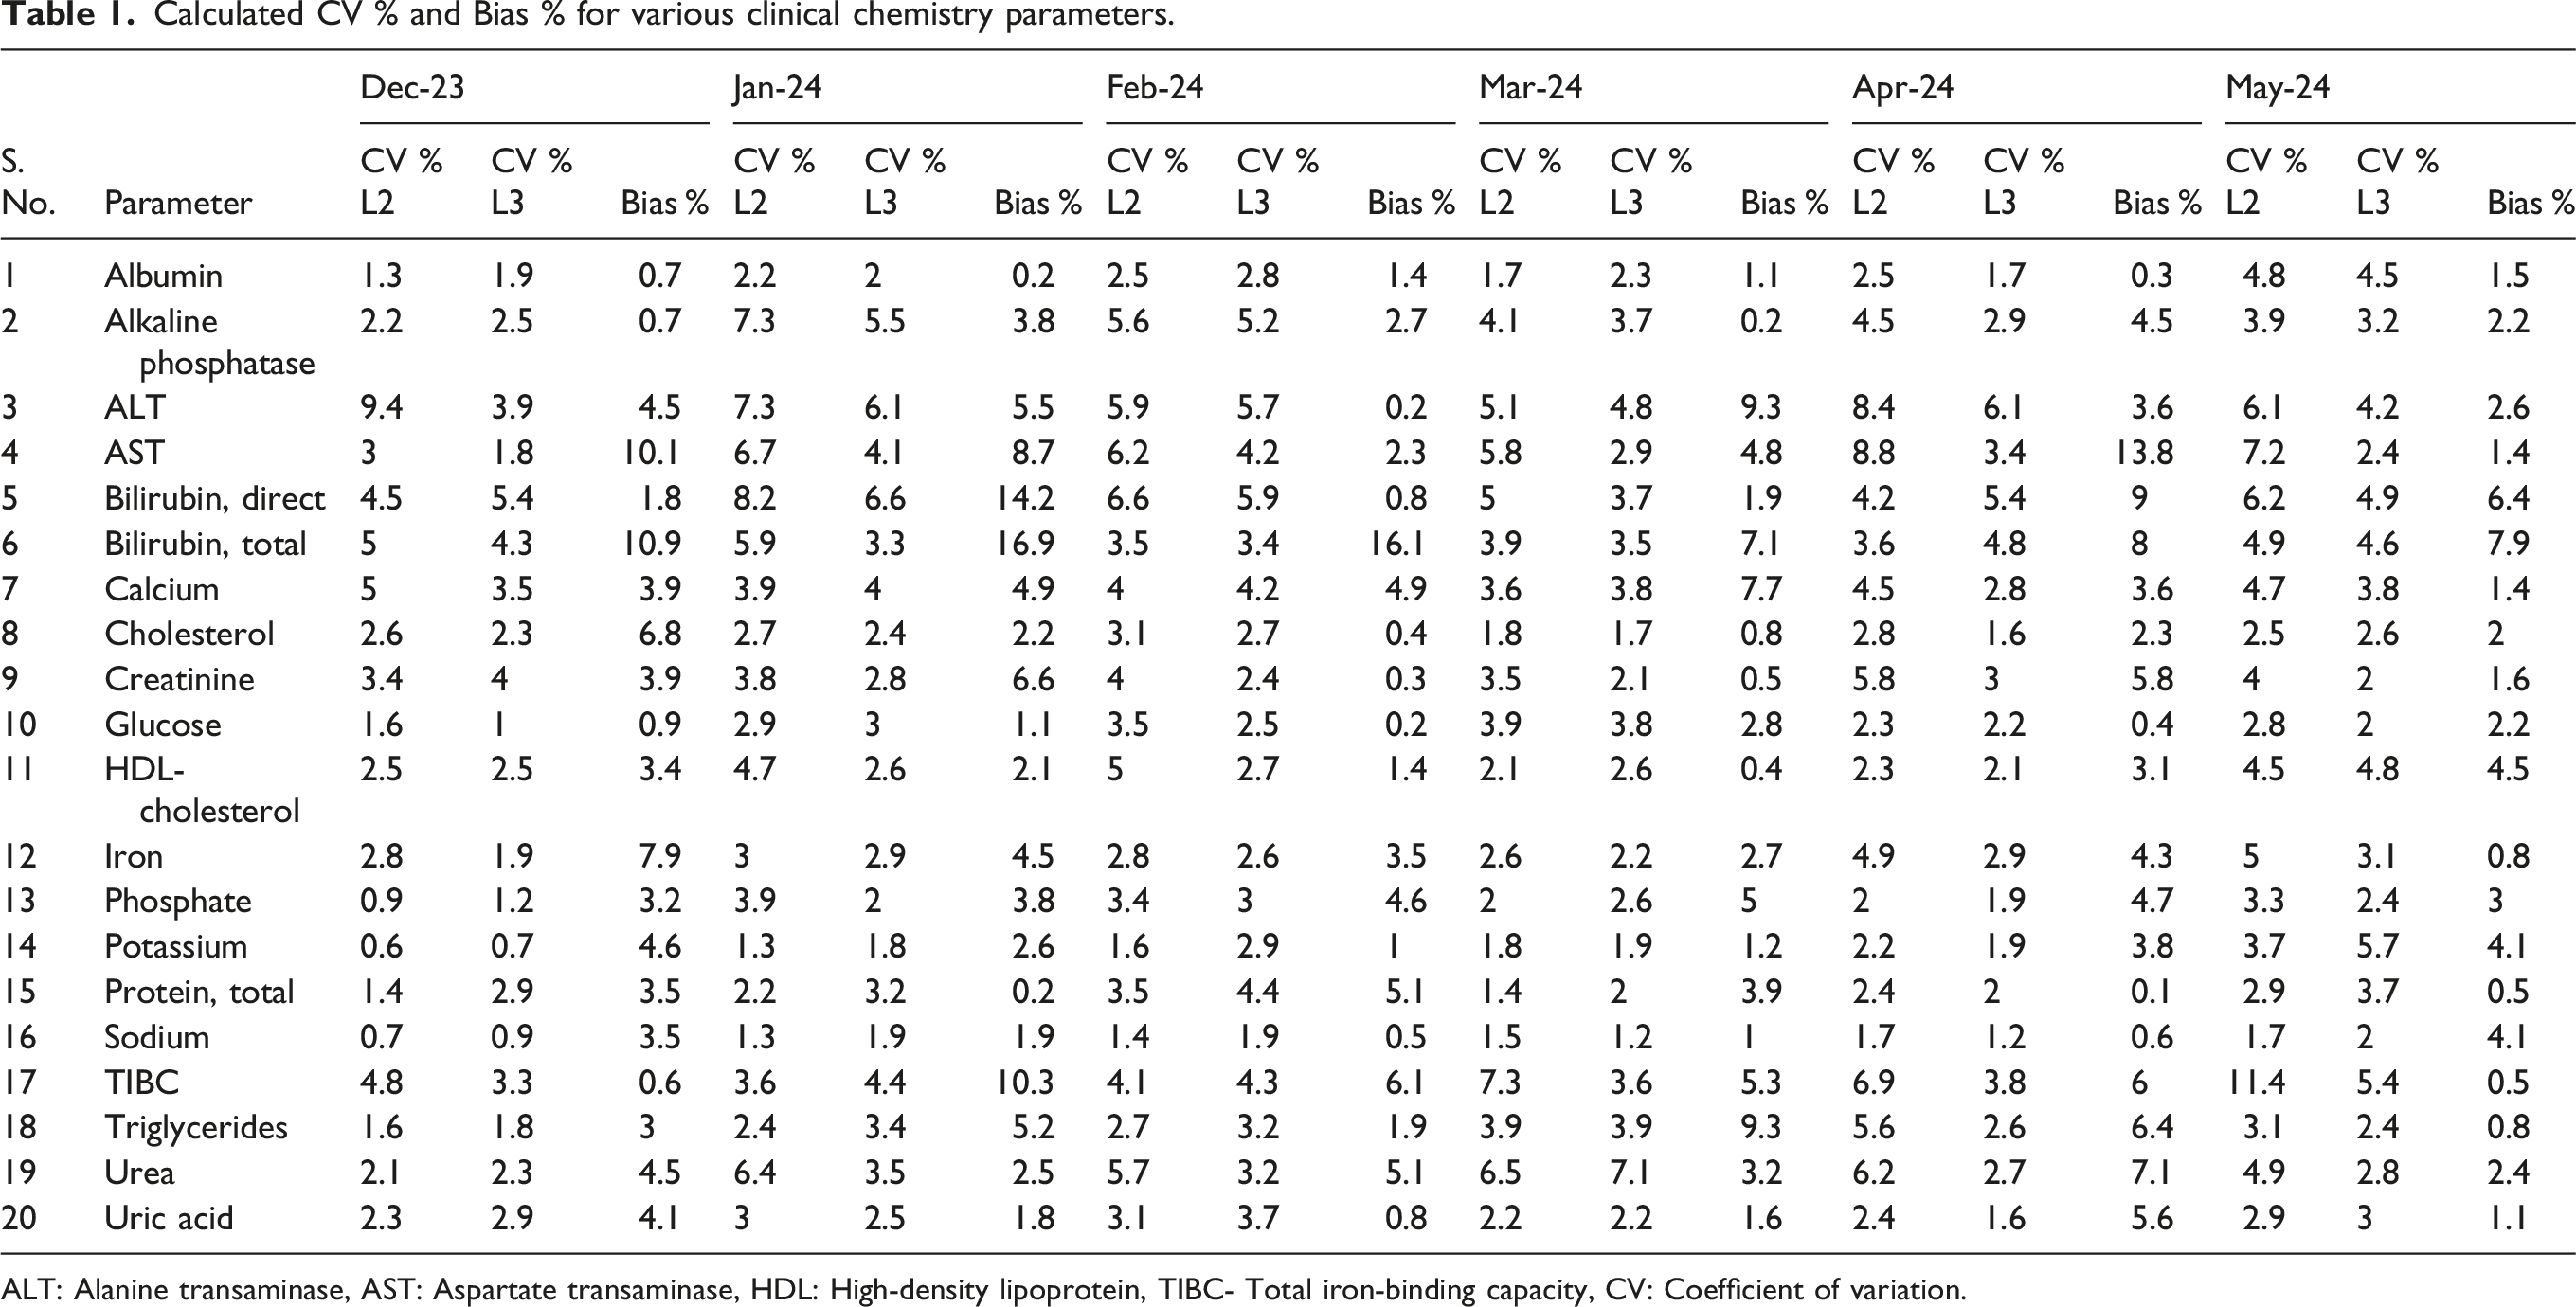
ALT: Alanine transaminase, AST: Aspartate transaminase, HDL: High-density lipoprotein, TIBC- Total iron-binding capacity, CV: Coefficient of variation.
Comparison of sigma values for clinical chemistry parameters calculated using CLIA 1992 and CLIA 2024 guidelines.
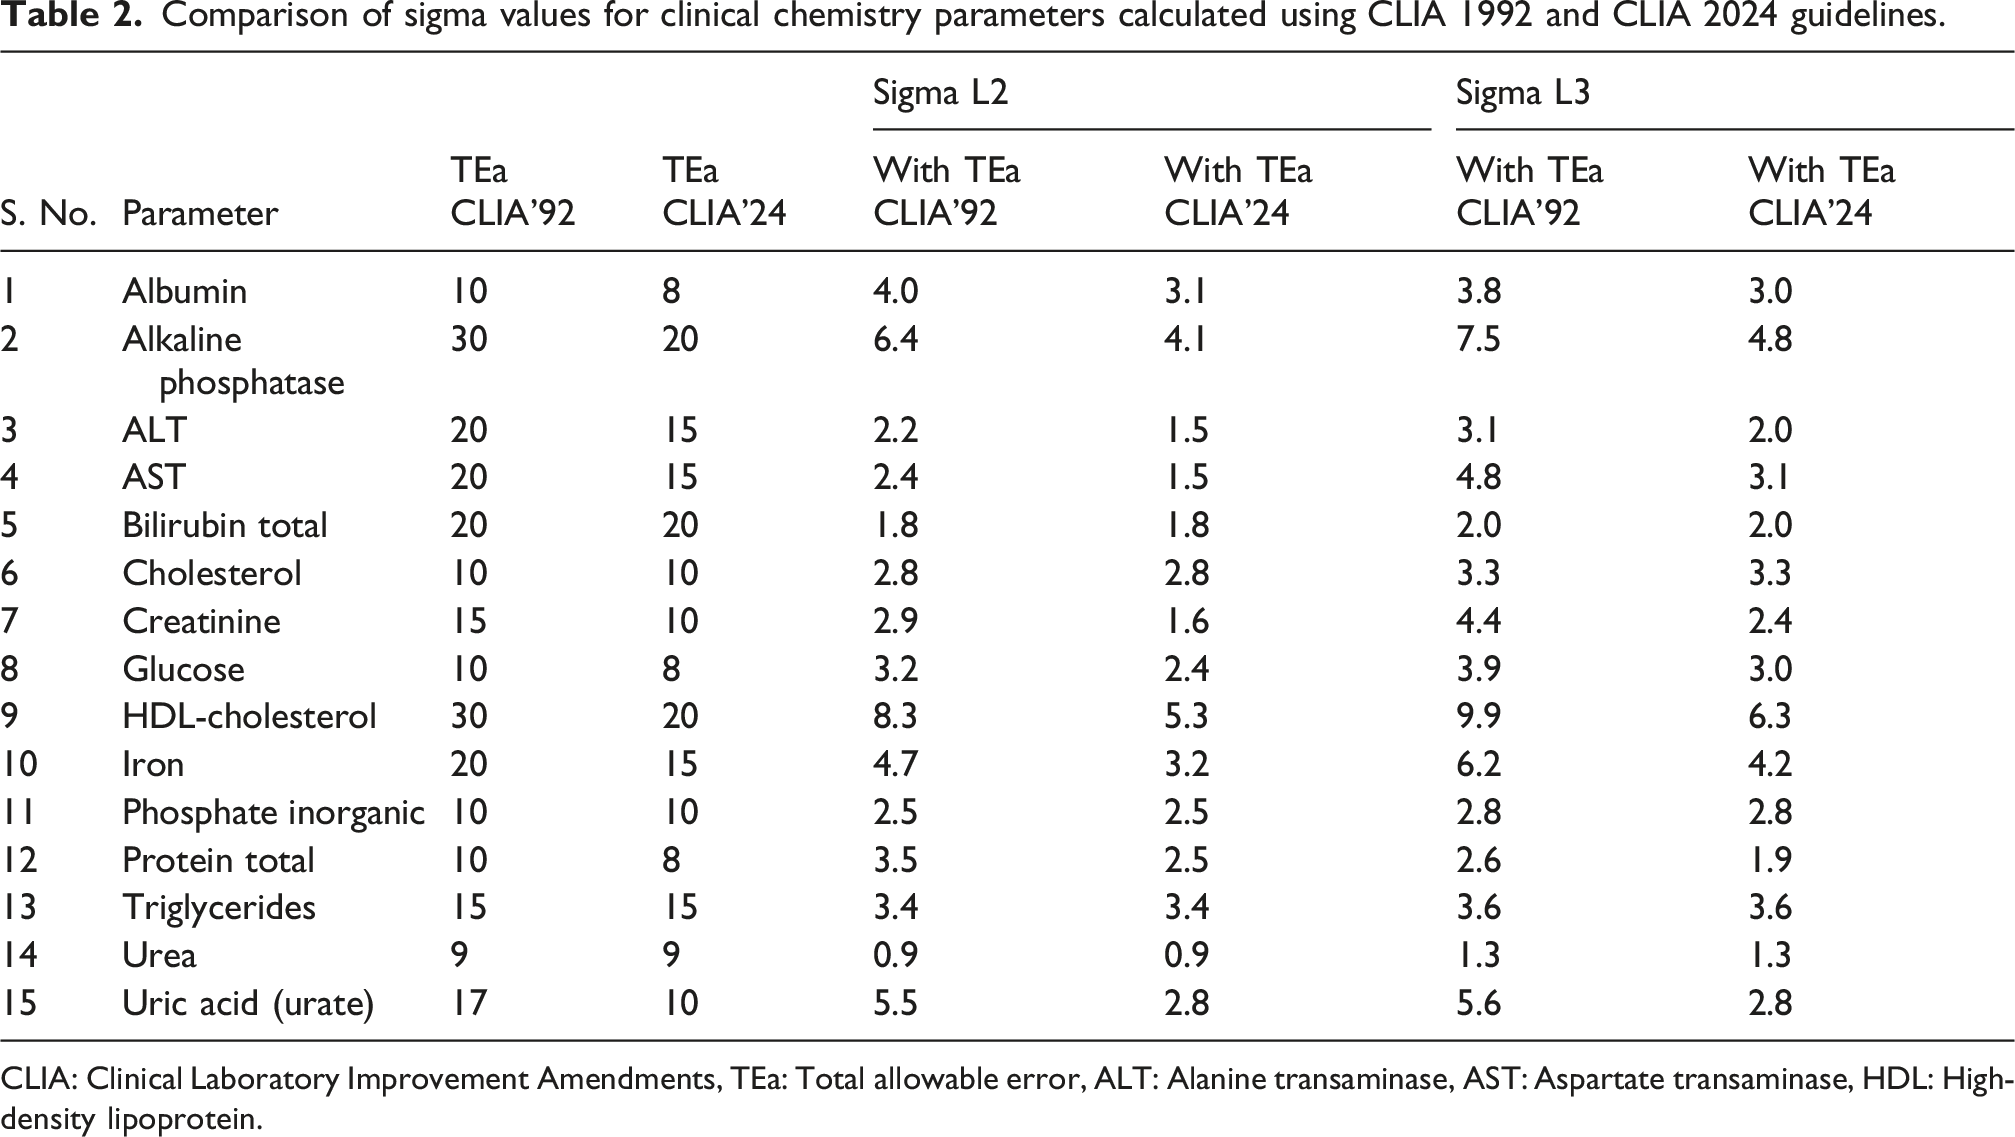
CLIA: Clinical Laboratory Improvement Amendments, TEa: Total allowable error, ALT: Alanine transaminase, AST: Aspartate transaminase, HDL: High-density lipoprotein.
Sigma values calculated using Ricos 2014 biological variation-based guidelines.
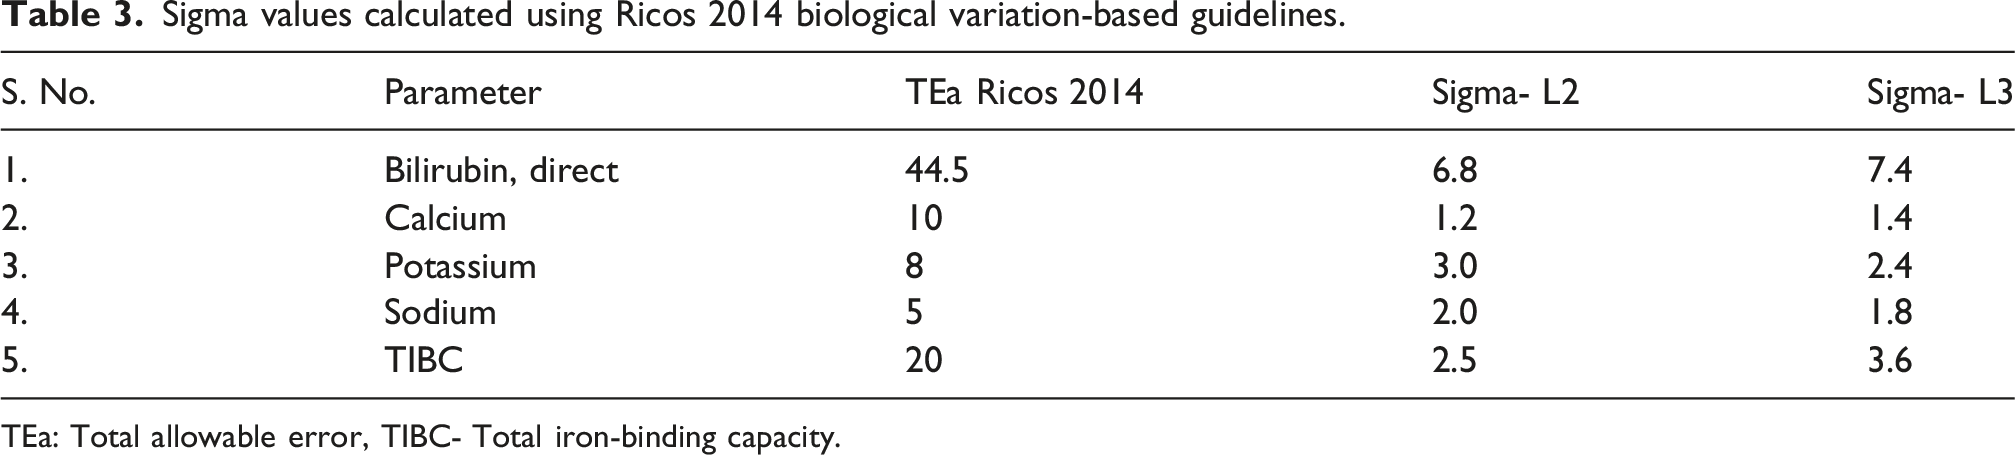
TEa: Total allowable error, TIBC- Total iron-binding capacity.
Quality goal index (QGI) ratio of analytes with low-sigma performance due to accuracy and precision issues.
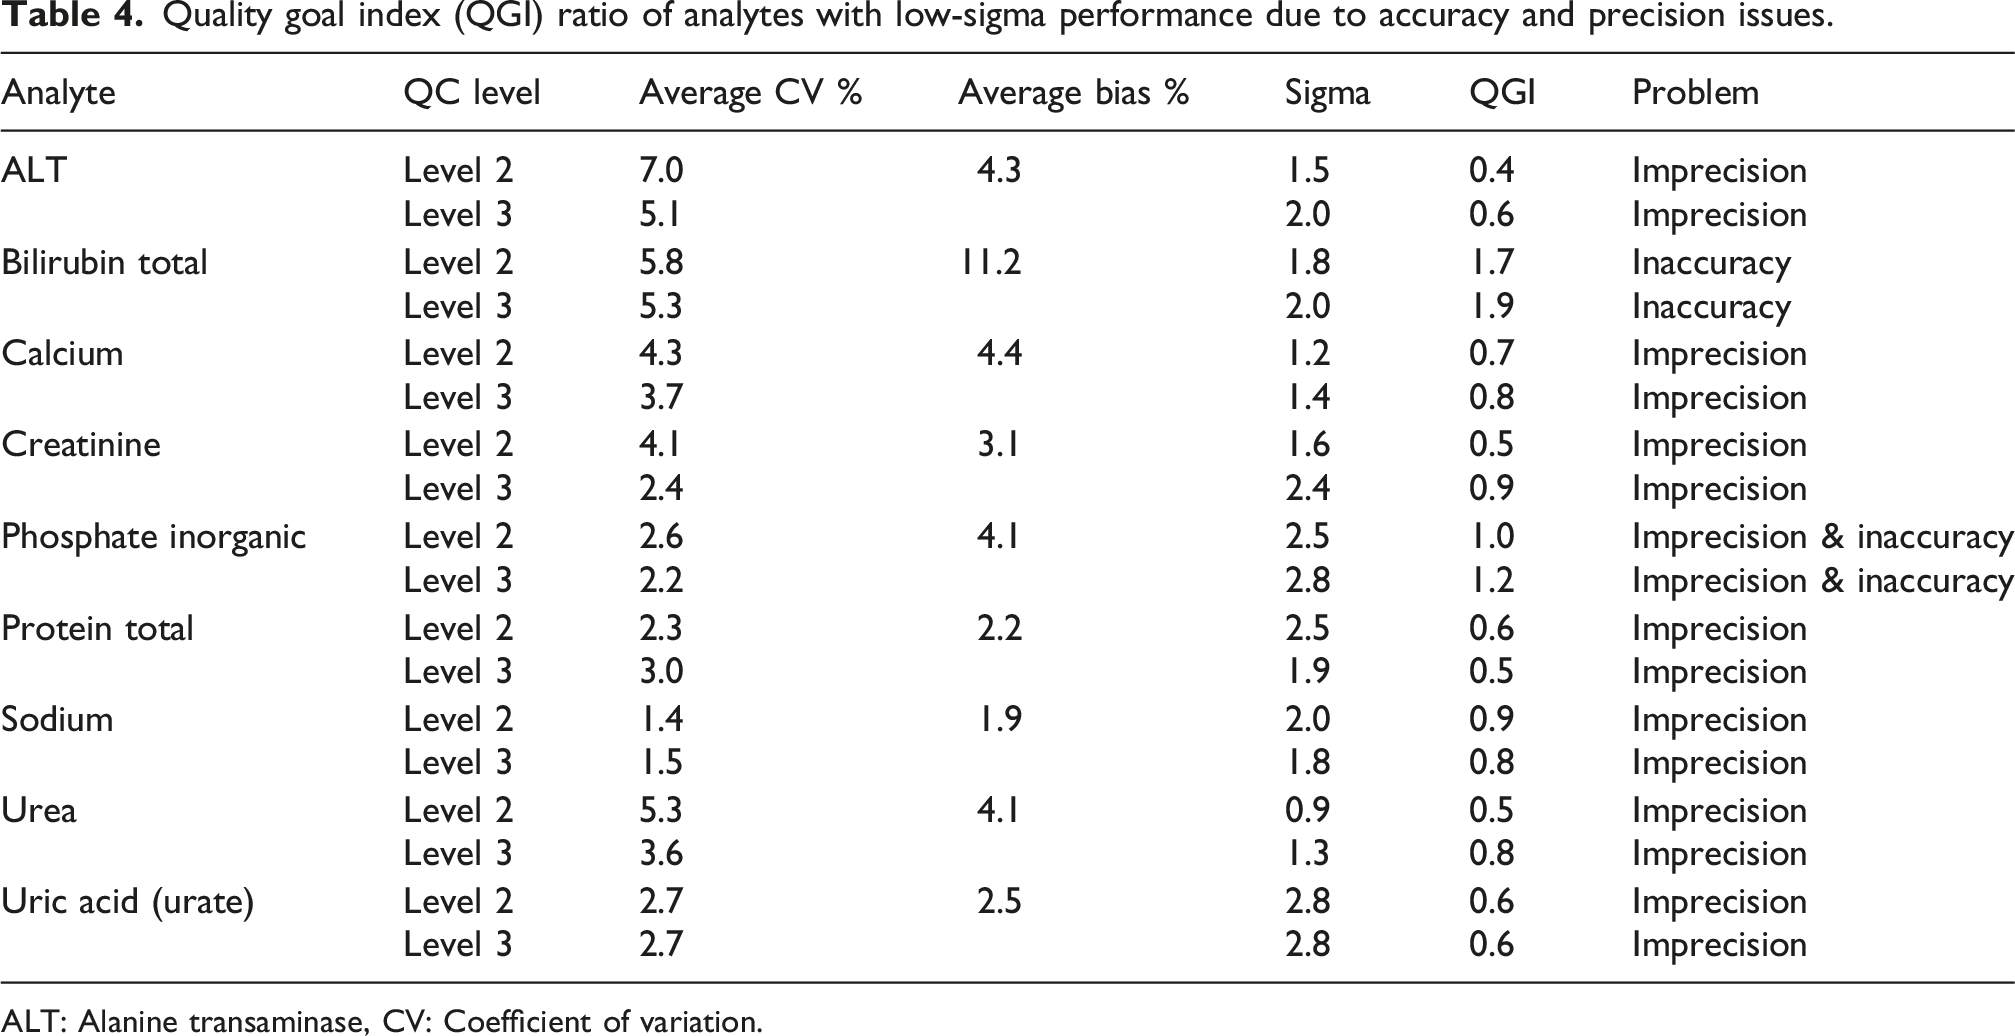
ALT: Alanine transaminase, CV: Coefficient of variation.
Recommendations for various parameters according to Westgard sigma rules.
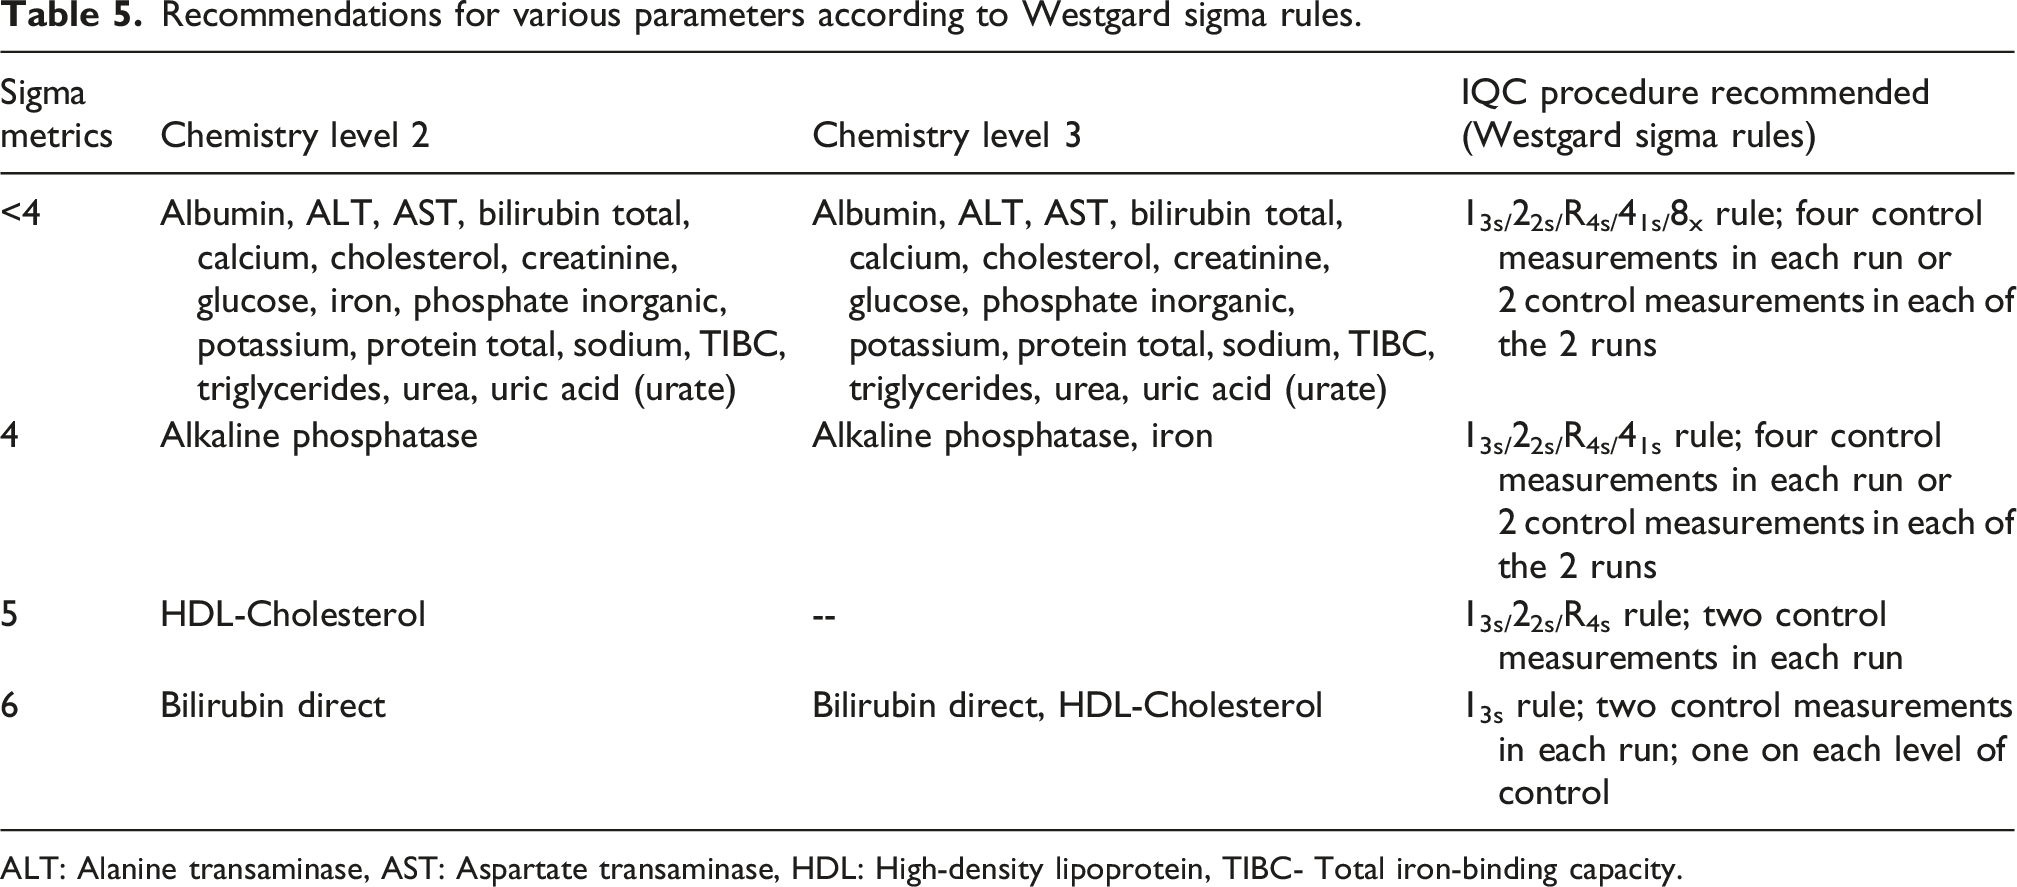
ALT: Alanine transaminase, AST: Aspartate transaminase, HDL: High-density lipoprotein, TIBC- Total iron-binding capacity.
Discussion
The laboratory achieved excellent performance (≥6 sigma) for two test parameters—direct bilirubin and HDL-cholesterol. Albumin, alkaline phosphatase, aspartate transaminase, cholesterol, glucose, iron, potassium, total iron-binding capacity and triglycerides achieved minimum sigma performance standards (>3) at one level. However, alanine transaminase, total bilirubin, calcium, creatinine, inorganic phosphate, total protein, sodium, urea, uric acid (urate) did not meet minimum sigma performance standards for both level 2 and level 3 controls (Tables 2 and 3). As is clear from the comparison, CLIA 2024 guidelines have tightened the allowable error thresholds leading to a decline in sigma performance of the parameters.
The root cause analysis revealed that lack of precision was the primary issue for majority of the parameters. However, for total bilirubin across all assay range, QGI was >1.2 indicating that inaccuracy could be the underlying problem for this test. The assay of phosphate showed lack of accuracy as well as precision suggesting a more complex issue requiring attention to both measurement variability and calibration errors (Table 4). Sigma metrics play a crucial role in clinical biochemistry laboratories’ performance evaluation and quality control procedures. These metrics provide a quantitative assessment of analytical quality as well as a standardized scale for evaluating laboratory activities. 8 Clinical biochemistry labs can use a sigma scale of 1 to 6 to determine the acceptability of their procedures. A performance level of 3 sigma is usually considered satisfactory. 9 This methodology facilitates the identification of errors and the development of logical quality control designs based on sigma values. 10 According to Westgard sigma rules, 11 for processes operating at 6-sigma quality, the use of Levey-Jennings QC chart with control limits of mean ±3 standard deviations (SD), and analyzing two control samples every run, should effectively detect medically important errors. At the 5-sigma level, a straightforward multi-rule QC approach (e.g., 13s/22s/R4s rules) with two control levels measured once each—should suffice. However, for lower-quality assays, more rigorous QC, such as including additional rules (41s, 8x) and increasing to total four control measurements is recommended (Table 5).
Researchers have carried out various studies on the evaluation of sigma metrics in clinical biochemistry laboratories. This emphasizes the role that these metrics play in enhancing analytical performance of various laboratory parameters. These studies have demonstrated the importance of continuous assessment of performance of all laboratory parameters, and creating specialized quality control plans for each analyte. 12 Geto et al used the COBAS 6000 analyzer to evaluate the sigma metrics for 21 clinical chemistry parameters. The laboratory demonstrated world-class performance (≥6 sigma) for amylase, triglycerides, magnesium, ALT, HDL, total bilirubin, and AST at both QC levels. Creatinine, urea, and chloride, however, did not achieve the minimum acceptable sigma metrics, indicating suboptimal analytical performance. An intermediate level of assay performance (3–6 sigma), was obtained for bilirubin (direct), alkaline phosphatase (ALP), total protein, phosphate, potassium, albumin, and glucose across both quality control levels. Hence, it is concluded that stringent IQC is unnecessary for analytes with sigma ≥6, while continuous QC monitoring is critical for renal function tests and process improvements are required for parameters with poor sigma performance. 13
In a similar retrospective observational study, sigma metrics for 20 analytes were calculated using internal and external quality control data. World-class performance (>6 sigma) was observed for total protein, glucose, urea, triglycerides, high-density lipoprotein (HDL) and low-density lipoprotein (LDL) across both control levels. Conversely, chloride, sodium, inorganic phosphate, creatinine, calcium and potassium yielded sigma metrics below 4 in at least one QC level. 14 Discrepancies in sigma metrics across various studies may be attributed to several factors. These include differences in analytical methodologies, equipment used, IQC materials, environmental and personnel factors and variations in bias calculations resulting from diverse external quality control testing organizations.3,15
The newly introduced CLIA 2024 TEa guidelines have significantly tightened quality control standards in clinical laboratories. Hence, the laboratories need to review and update their QC protocols to meet the desired goals. As observed in this study, many parameters failed to meet the bare minimum quality goal, that is, sigma level of 3. Thus, the testing process should be consistently monitored to reduce the margin for error in diagnostic testing. To decrease imprecision of biochemical parameters showing low-sigma values, a comprehensive training program needs to be implemented for laboratory personnel. The training sessions should focus on reagent preparation, control material reconstitution, equipment maintenance, and proper handling and storage of reagents. The staff must be made aware of the impact of these daily practices on the quality of lab. results. 14 Sigma metrics give an objective evaluation of lab. performance, thus the lab. staff can be motivated to focus on improvement in sigma values of various parameters. This emphasis on stricter QC practices will increase the reliability of test outcomes, ultimately improving patient care and outcomes.
This study has certain limitations. Bias was derived from peer-group mean values obtained from the external quality assurance program rather than reference measurement procedures which may affect the estimation of accuracy. Additionally, the study was conducted on a single analyzer platform [Dimension® Xpand® Plus Integrated Chemistry System (Siemens Healthineers, Forchheim, Germany)] at a single-center and this may limit generalizability. Further studies addressing these limitations may provide more robust and generalizable assessment of analytical performance.
Conclusion
Six Sigma is a proven tool for evaluating laboratory test performance. Implementing optimal QC procedures reduces redundant QC runs and associated costs for high-sigma analytes. Focussed QC strategies for low-sigma parameters will improve their performance. The sigma calculations vary significantly depending on the source of TEa. The CLIA 1992 TEa guidelines were broad and were based on the technology available at that time. These focused on minimum performance standards for clinical laboratories, with the objective being the prevention of significant errors in patient care. In contrast, the 2024 TEa guidelines are more stringent, reflecting advancements in laboratory technology and a greater emphasis on precision. Consequently, laboratories should reassess the performance of various chemistry parameters and redefine the QC protocols.
Footnotes

Funding
The authors received no financial support for the research, authorship, and/or publication of this article.
Declaration of conflicting interests
The authors declared no potential conflicts of interest with respect to the research, authorship, and/or publication of this article.
Ethical approval
The study was exempted from ethical review by Institute Ethics Committee, AIIMS Bilaspur (approval No. AIIMS/BLS/IEC-BHR/24-08/CERT/14 dated 02/09/2024).
Guarantor
Sumita Sharma.
Contributorship
AS and OKT contributed to the literature review, data acquisition, data analysis and interpretation, drafting of the manuscript, and critical revision of the manuscript for important intellectual content.
SS contributed to the conception and design of the study, data analysis and interpretation of findings, drafting and critical revision of the manuscript for important intellectual content and overall coordination of the submission process.
All authors approved the final version of the manuscript submitted for publication and agree to be accountable for all aspects of the work, including the accuracy and integrity of the study.