




Abstract
Background
Cardiovascular system is known to be affected in acromegaly. However, it was not reported to date if hemorheology was also altered and there is limited data regarding systemic oxidative status in patients with acromegaly.
Objective
To investigate alterations in hemorheology and systemic oxidative stress in patients with acromegaly.
Methods
The study comprised 19 active (AA) and 15 controlled (CA) acromegaly patients (n = 34, mean age 48.85 ± 1.69 years) and 29 controls (mean age 52.83 ± 1.37 years). Erythrocyte aggregation index (AI), aggregation half time (t½), amplitude (Amp) and erythrocyte elongation index (EI) were determined by an ektacytometer. Commercial kits were used for measuring serum total oxidant status (TOS) and total antioxidant status (TAS), and oxidative stress index (OSI) was calculated.
Results
There were statistically significant differences regarding EI at shear stresses of 16.87 ve 30.00 Pa (p = 0.034, p = 0.0001, respectively) and AI (p = 0.050, p = 0.035, respectively) values among the control, AA and CA groups. Decrement of t½ was in line with increment of AI and indicated increased erythrocyte aggregation. Serum TOS, TAS and OSI values were similar between the control, AA and CA groups (p > 0.05).
Conclusions
This pilot study demonstrated reduced erythrocyte deformability and increased erythrocyte aggregation in patients with AA and CA.
Keywords
Introduction
Acromegaly is a rare and debilitating endocrine disorder characterized by excessive secretion of growth hormone (GH) by the pituitary gland and subsequent overproduction of insulin-like growth factor 1 (IGF-1). This disorder typically arises from a benign tumor in the pituitary gland, known as pituitary adenoma with a prevalence of approximately 60 cases per million.1,2
The increase in GH and IGF-1 levels leads to various clinical manifestations, including acral enlargement, soft tissue swelling, cardiovascular, cerebrovascular and respiratory complications, metabolic disturbances, skeletal abnormalities and increased risk for mortality and morbidity.1–5
Beyond the obvious clinical features, acromegaly is suggested to be associated with significant alterations in various physiological and biochemical parameters. Among these, hemorheological changes and systemic oxidative stress have gained attention. Hemorheology refers to the study of blood flow and its determinants, while oxidative stress results from an imbalance between reactive oxygen species (ROS) and the physiological ability to neutralize them through antioxidants.6–9 Both hemorheological alterations and oxidative stress play crucial roles in the pathophysiology of several cardiovascular and metabolic disorders.10–14
In acromegalic patients, the intricate interplay between elevated GH and IGF-1 levels, and the downstream signaling cascades they initiate, may influence the cardiovascular system and erythrocyte properties.1–5,10–16 However, there is no study in the current literature reporting hemorheological alterations in patients with acromegaly.
Moreover, the chronic overproduction of GH and IGF-1 may induce a state of increased oxidative stress in the body.1–5,16,17 The excessive ROS generated under such conditions can lead to cellular damage, lipid peroxidation and disruption of various cellular functions. However, there is limited literature data on this regard in acromegaly.17–19
Therefore, the present study aims to investigate the alterations in hemorheological parameters and systemic oxidative stress markers in patients with active and controlled acromegaly.
Methods
The study protocol was approved by the Medical Ethics Committee of Pamukkale University (the registry number: 60116787-020/16709) and was performed in accordance with the Declaration of Helsinki. Clinical trials have been registered as legislation requires. All patients and participants in experiments described in this paper have given written consent to the inclusion of material pertaining to themselves, that they acknowledge that they cannot be identified via the paper; and that we have fully anonymized them. All mandatory laboratory health and safety procedures have been complied with in the course of conducting all experimental work reported in this paper. Our paper contains all appropriate warnings on any hazards that may be involved in carrying out the experiments or procedures we have described, or that may be involved in instructions, materials, or formulae.
Patients
This university-based cross-sectional study included 34 patients with a diagnosis of acromegaly who were under follow up at the department of Endocrinology and Metabolism and 29 age-sex matched controls with no clinical and laboratory signs of acromegaly and any inflammatory or infectious disease. A complete diagnostic approach was performed for all the patients. Acromegaly was diagnosed by failure of suppression of serum GH concentrations below 1 ng/ml after a 75-g oral glucose tolerance test (OGTT) together with fasting serum IGF-1 concentrations above the normal ranges for age and gender with the presence of clinical features of acromegaly. The 2/34 patients were treated with somatostatin analogs (SA) alone, 2/34 patients were treated with surgery alone and 30/34 patients were treated with a combination of surgery and SA.
The acromegaly patients were classified into two groups as “active acromegaly” (AA; n = 19) and “controlled acromegaly” (CA; n = 15). Controlled acromegaly was defined as a GH value below 1.0 ng/ml on a 75-g OGTT; or a random GH below 1.0 ng/ml and IGF-1 values in the reference ranges if the patient was under SA treatment. The CA group consisted of patients who were in remission for at least 6 months. The patients who did not meet the above-mentioned CA criteria were accepted as AA.
For both the acromegaly and control groups, the subjects with an age under 18 years, untreated hormonal deficiencies, uncontrolled hypertension (HT), diabetes mellitus (DM), hyperlipidemia (HL) and active inflammatory and infectious diseases were excluded from the study.
Samples and measurements
After a 12-h overnight fasting, blood samples were taken by venipuncture from the antecubital vein into standard blood collection tubes containing EDTA (1.5 mg/ml). According to “new guidelines for hemorheological laboratory techniques”, samples were properly delivered to the Physiology laboratory, where hemorheological testing was completed within three hours.12,13
Hematological parameters were determined by an electronic hematology analyzer (Siemens ADVIA® 2120i System, Siemens Healthcare Diagnostics, Japan). GH, IGF-1, fasting blood glucose, alanine aminotransferase (ALT), free thyroxine, creatinine, prolactin and thyroid-stimulating hormone (TSH) levels were also analyzed.
Erythrocyte deformability measurements
Erythrocyte deformability data was obtained at various fluid shear stresses by laser diffraction analysis using an ektacytometer (Laser assisted optical rotational cell analyzer [LORCA], RR Mechatronics, Hoorn, The Netherlands). The system has been described elsewhere in detail.12,13 Briefly, a low hematocrit (Hct) suspension of red blood cell (RBC) in an isotonic viscous medium (4% polyvinylpyrrolidone 360 solution; MW 360 kD; Sigma P 5288; St. Louis, MI) was sheared in a Couette system composed of a glass cup and a precisely fitting bob, with a gap of 0.3 mm between the cylinders. A laser beam was directed through the sheared sample, and the diffraction pattern produced by the deformed cells was analyzed by a microcomputer. On the basis of the geometry of the elliptical diffraction pattern, an elongation index (EI) was calculated as EI = (L − W)/(L + W), where L and W are the length and width of the diffraction pattern, respectively. EI values were determined for 9 shear stresses between 0.3 and 30 Pascal (Pa) and similar patterns of RBC deformability alterations were obtained between groups at all stress levels. All measurements were carried out at 37°C.
Erythrocyte aggregation measurements
Erythrocyte aggregation was also determined by LORCA as described elsewhere.12,13 The measurement is based on the detection of laser back-scattering from the sheared (disaggregated), then unsheared (aggregating) blood, performed in a computer-assisted system at 37°C. Backscattering data were evaluated by the computer and the amplitude (Amp), which is the total extent of aggregation, aggregation index (AI), aggregation half time (t1/2), were calculated on the basis that there is less light backscattered from aggregating red cells. Aggregation measurements were determined using erythrocytes in autologous plasma adjusted to 40% Hct and blood was fully oxygenated before the measurements. Hct was adjusted by adding or removing the calculated amounts of autologous plasma to/from the samples. Plasma was separated by gentle centrifugation (1.500 g; 5 min at room temperature). We incubated approximately 2 ml of whole blood, with at least 50 ml of air, in a tube on a roller bank for 15 min minimum.
Measurement of total oxidant status (TOS) and total antioxidant status (TAS)
An automated method developed by Erel 7 was used for the TOS and TAS measurements (Rel Assay Diagnostics, Gaziantep, Turkey). Venous blood samples (10 ml) were obtained from all cases after overnight fasting in the morning and collected into plain blood collection glass tubes without any anticoagulant, or coagulation activator. Samples were centrifuged at 7260 rpm for 6 min. Serum was separated and stored at −80°C until laboratory analysis for TOS and TAS measurements. 7
TOS measurement
Oxidants present in the sample oxidize the ferrous ion-odianisidine complex to ferric ion. Glycerol molecules present in the reaction medium enhance the oxidation reaction. The ferric ion produces a colored complex with xylenol orange in an acidic solution. The color intensity is measured spectrophotometrically, and it is proportional to the total amount of oxidant molecules present in the sample. The assay is calibrated with hydrogen peroxide, and the results are expressed as micromolar hydrogen peroxide equivalents per liter (µmol H2O2 Equiv./L).7–9
TAS measurement
Hydroxyl radical, the most potent biological radical, is produced by the Fenton reaction and reacts with the colorless substrate O-dianisidine to produce bright yellowish brown–colored dianisyl radical. Addition of the serum sample, oxidative reactions are initiated by the hydroxyl radicals present in the reaction mixture are suppressed by the antioxidant components of the serum, preventing the color change and thereby providing an effective measure of the total antioxidant capacity of the serum. The results were expressed as mmol Trolox Equiv./L.7–9
Calculation of oxidative stress index
The ratio of TOS to TAS is referred as oxidative stress index (OSI). The OSI is calculated according to the following formula;
OSI (arbitrary unit) = TOS (µmol H2O2 Equiv./L) / TAS (mmol Trolox Equiv./L)×100.7–9
Statistical analysis
All statistical analyses were performed using SPSS 25.0 (IBM Corp., Armonk, NY, USA). Continuous variables were defined by the mean ± standard deviation (SD). Shapiro Wilk test was used to assess normal distribution of the data. For independent three groups comparisons (control, AA and CA), the One-Way Analysis of Variance (post hoc: Tukey method) was performed when parametric test assumptions were met. Otherwise, the Kruskal Wallis Variance Analysis (post hoc: Mann Whitney U test with Bonferroni Correction) was used. Spearman Correlation Coefficients were utilized to determine correlations between continuous variables. The level of statistical significance was set at p ≤ 0.05 at 95% of confidence interval.
Since there is no similar study as a reference, difference between independent groups would have a strong effect size (d = 0.7) a power analysis was performed before the study. Accordingly, when at least 52 participants (at least 26 participants per group) were included in the study, that would result in 80% power with %95 confidence level. We included 34 patients with acromegaly and 29 controls into the current study. From the results obtained from these individuals, that the effect size for EI 30.00 results were found to be d = 1.2 and that for our effect size, our study has reached 99% power at 95% confidence level.
Results
This study enrolled a total of 34 patients with acromegaly (19 patients with AA [10 female and 9 male] and 15 patients with CA [6 female and 9 male]) with a mean age of 48.85 ± 1.69 years and 29 age and sex matched controls (15 female and 14 male) with a mean age of 52.83 ± 1.37 years. There were no statistically significant differences between the acromegaly and control groups regarding age and gender (p = 0.068 and p = 0.689 respectively) (Table 1).
Comparison of the demographic and hematologic data between control and acromegaly groups.

Values are expressed as means ± SD (Hb: hemoglobin, Hct: hematocrit, RBC: red blood cell count, MCV: mean corpuscular volume, MCH: mean corpuscular hemoglobin, MCHC: mean corpuscular hemoglobin concentration, RDW: red blood cell distribution width, WBC: white blood cell count, Plt: platelet count, *p ≤ 0.05: the difference from control group. Bold values show statistical significance (p ≤ 0.05).
Hematological parameters
There were statistically significant differences among the control, AA and CA groups regarding hemoglobin (Hb), Hct, RBC count and RBC distribution width (RDW; coefficient of variation %) (p = 0.043, p = 0.018, p = 0.048 and p = 0.0001 respectively) (Table 1). Pairwise comparisons showed that there were no significant differences between the control and AA groups regarding Hb, Hct, and RBC count (p > 0.05), whereas these parameters were significantly lower in the CA group than in the control group (p = 0.033, p = 0.011 and p = 0.039 respectively).
Mean corpuscular volume (MCV), mean corpuscular hemoglobin (MCH), mean corpuscular hemoglobin concentration (MCHC), white blood cell (WBC) and platelet counts did not differ among the control, AA and CA groups (p > 0.05).
On the other hand, both AA and CA groups had significantly higher RDW values when compared to the control group (p = 0.001, p = 0.001, respectively) and RDW value was similar between the AA and CA subgroups (p > 0.05).
Hemorheological parameters
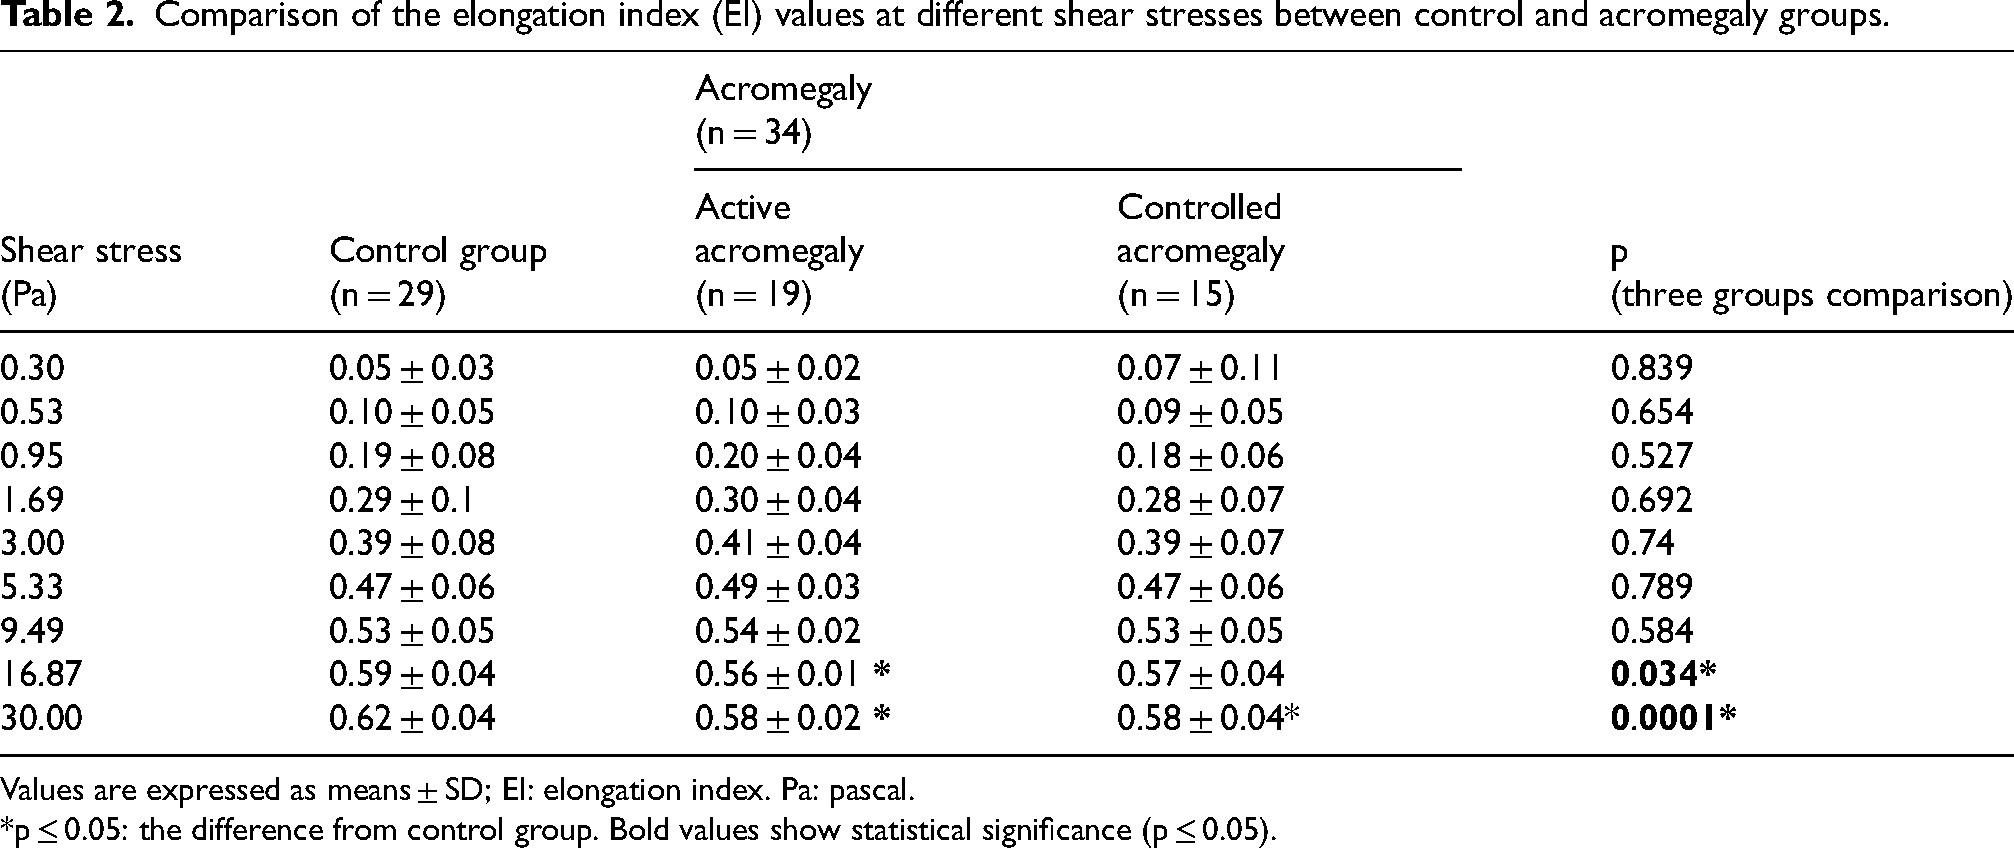
EI was measured at nine shear stresses between 0.3 and 30.0 Pa in the acromegaly and control groups and were presented in Table 2.
Comparison of the elongation index (EI) values at different shear stresses between control and acromegaly groups.
Values are expressed as means ± SD; EI: elongation index. Pa: pascal. *p ≤ 0.05: the difference from control group. Bold values show statistical significance (p ≤ 0.05).
There were statistically significant differences among the control, AA and CA groups in terms of EI values at 16.87 and 30.00 Pa (p = 0.034 and p = 0.0001, respectively). EI values at 16.87 and 30.00 Pa in the AA group (p = 0.032 and p = 0.0001, respectively) and EI value at 30.00 Pa in the CA group (p = 0.0001) were significantly lower than in the control group. However, there were no significant differences between the AA and CA groups regarding the EI values (p > 0.05).
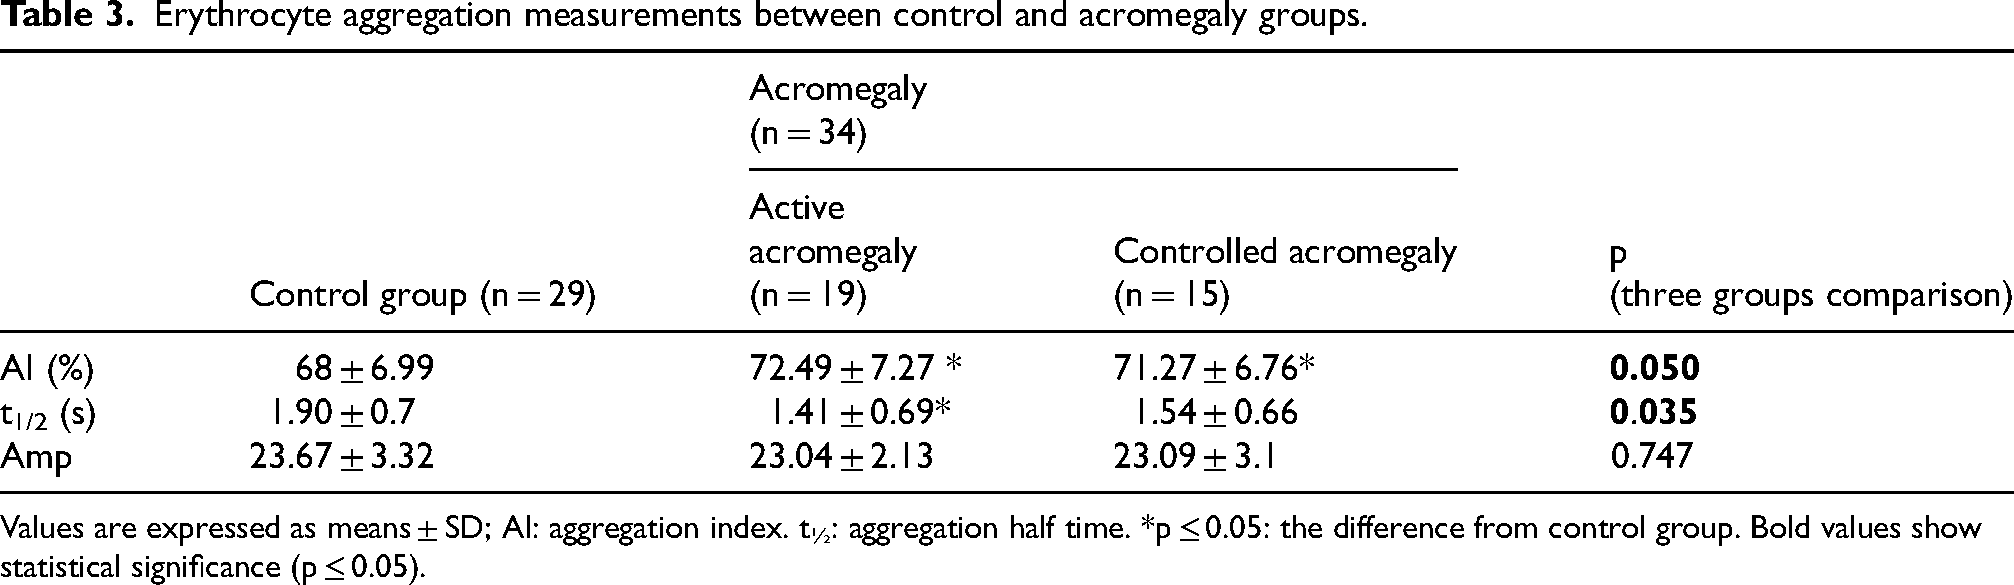
Erythrocyte aggregation parameters (AI, t½ and Amp) were demonstrated in Table 3. Comparing control, AA and CA groups, differences in AI and t1/2 values were statistically significant (p = 0.050 and p = 0.035). The increment observed in AI of aggregation is concordant with the decrement in t1/2 and indicate increment of erythrocyte aggregation. Pairwise comparisons showed that both AA and CA groups had higher AI values when compared to the control group (p = 0.048 and p = 0.049), while t½ value was significantly lower in the AA subgroup than in the control group (p = 0.025). There were no significant differences between the AA and CA subgroups in terms of AI, t½ and Amp (p > 0.05).
Erythrocyte aggregation measurements between control and acromegaly groups.
Values are expressed as means ± SD; AI: aggregation index. t½: aggregation half time. *p ≤ 0.05: the difference from control group. Bold values show statistical significance (p ≤ 0.05).
Oxidative stress indices
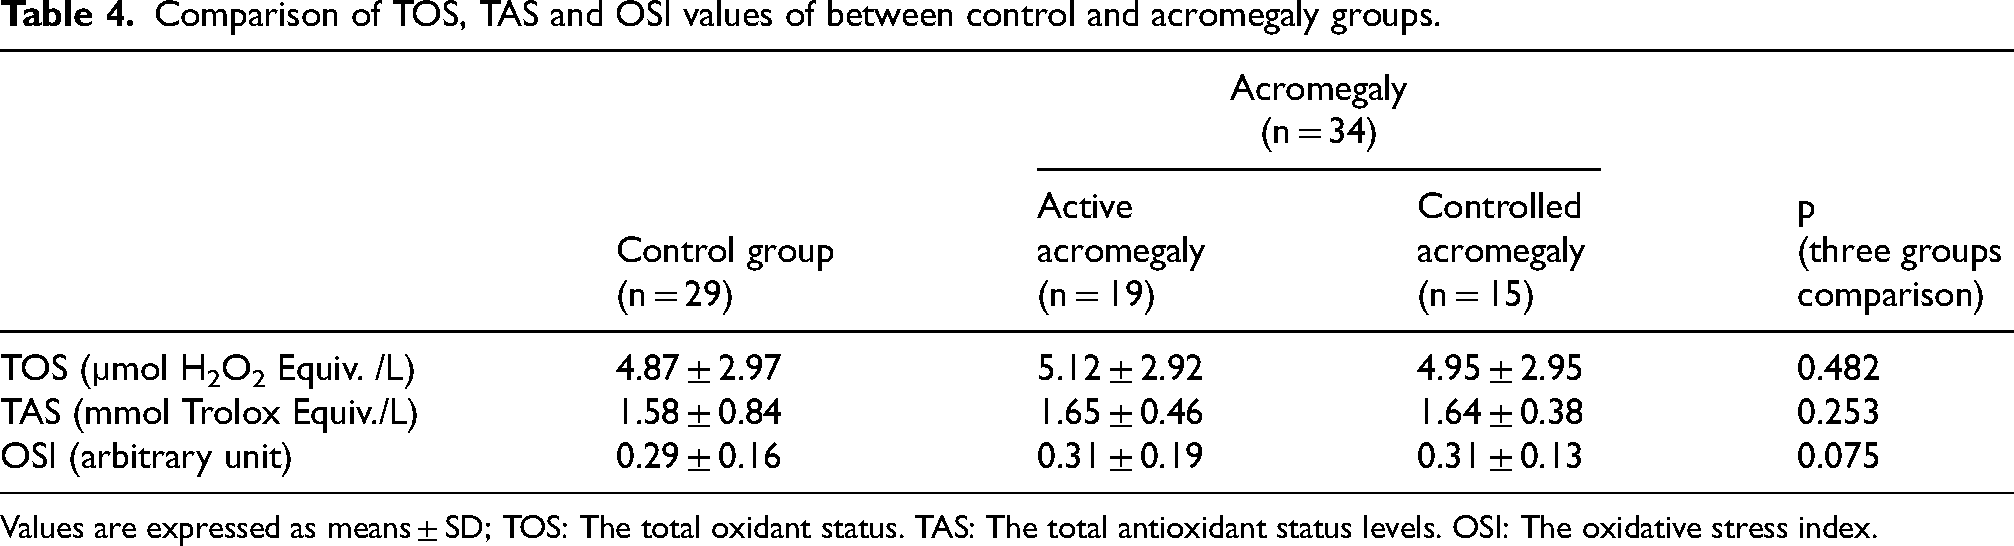
TAS, TOS and OSI values for the acromegaly and control groups were demonstrated in Table 4. No statistically significant differences were observed regarding oxidative stress indices among the control, AA and CA groups (p > 0.05).
Comparison of TOS, TAS and OSI values of between control and acromegaly groups.
Values are expressed as means ± SD; TOS: The total oxidant status. TAS: The total antioxidant status levels. OSI: The oxidative stress index.
Correlation analysis showed no statistically significant association between the parameters of blood rheology and oxidative stress (p > 0.05).
Other laboratory tests
The other biochemical and endocrinological laboratory results in the acromegaly group were as the following; mean GH and IGF-1 = 1.878 ± 0.266 ng/ml and 314.812 ± 26.875 ng/ml (respectively), fasting blood glucose = 121.882 ± 7.076 mg/dl, creatinine = 0,727 ± 0,028 mg/dl, alanine aminotransferase (ALT)= 16.5 ± 0.969 IU/l, prolactin = 7.106 ± 2.245 ng/dl, free thyroxine = 1.248 ± 0.061 ng/dl was TSH = 1.263 ± 0.168 uIU/ml.
Discussion
The current study demonstrated lower Hb, Hct, RBC count in CA; decreased erythrocyte deformability in AA and CA; and increased RDW and erythrocyte aggregation in AA and CA. Systemic oxidative stress parameters were found to be similar between the acromegaly and control groups.
Acromegaly is associated with a 2 to 2.5 times higher risk of cardiovascular disease and several studies linked excessive GH to hemodynamic alterations and increase in atherogenic risk factors such as inflammation and oxidative stress, which is still debated.1–5 There are several studies in the literature showing alterations in blood properties in acromegaly. For instance, Strauch et al 20 demonstrated reversible increase in plasma volume and RBC volume in acromegalic patients attributed to endogenous GH hypersecretion. Another study by Szczepanek-Parulska et al 14 suggested that acromegaly could be associated with higher erythrocyte MCV. Although plasma and RBC volume could not be evaluated in the present study, Hb, Htc and RBC count were found to be lower only in patients with CA when compared to the control group, which might be associated with received acromegaly treatment. On the other hand, RDW is attracting attention as a potential independent cardiovascular risk factor in acromegaly. Ucler et al 21 showed that RDW measurements were significantly higher in acromegaly patients with disease controlled by SA treatment. On the contrary, the current study showed that RDW was higher in both AA and CA groups than in the control group. In recent years, many clinical studies approved that the alterations in RDW levels could be associated with the incidence and prognosis in cardiovascular and cerebrovascular diseases. Therefore, in acromegalic patients, RDW as a predictive marker and an independent risk factor might be utilized in assessing cardiovascular diseases. However, the mechanisms of the association between RDW and the prognosis of cardiovascular disease remain unclear.
This is the first study investigating hemorheological properties of patients with acromegaly and demonstrated decreased EI and increased AI in both AA and CA. However, in the AA group, erythrocyte aggregation half time was also lower when compared to the control group. These findings might indicate that disease control in acromegaly may have a beneficial effect on erythrocyte aggregation half time while it seems to have limited impact on EI and AI. The observed decrease in EI at high shear stresses might be indicative of altered cell geometry (particularly surface area to volume ratio) in patients with acromegaly. Moreover, higher RDW values which indicate increased variability in RBC size might be associated with an abnormality in RBC production in acromegalic patients, and a reticulocyte count might have been valuable to reveal. However, the current study was not able to provide this information. Increased variability in RBC size found in the present study might have affected the EI but presence of a membrane abnormality seems unlikely given that there was no change in EI at lower shear stresses. Moreover, there was no statistically significant correlation between RDW and EI in the current study. To summarize, erythrocyte deformability can be affected in the circulatory system through a variety of mechanisms, including membrane distortion, increased viscosity, oxidative stress, hemolysis, membrane modifications, and lower ATP levels. 22 The findings of the current study on impaired EI may have been caused by a combination of these causes. Nevertheless, as this is a pilot study reporting hemorheological changes in acromegaly patients, more research on this subject involving larger populations is also required.
The documented increase in AI in both AA and CA groups in this study might suggest an increased tendency for blood cells to form clumps, potentially predisposing acromegalic patients to thrombotic events and impairing blood flow in microcirculation even the disease was under control. The compromised blood flow caused by reduced erythrocyte deformability and increased aggregation could contribute to the cardiovascular complications often associated with acromegaly, such as ischemic events. Moreover, these changes may further contribute to the metabolic disturbances frequently seen in these patients, possibly perpetuating a state of systemic oxidative stress and cellular damage.
Oxidative status is another topic of research in acromegalic patients which is blamed to be one of the key mechanisms of endothelial dysfunction in acromegaly.7–9,16,17 Ilhan et al 18 demonstrated decreased levels superoxide dismutase (SOD) and TAS in acromegalic patients and controlling the disease activity failed to improve oxidative status. Tabur et al 17 found increased serum prolidase activity, TOS, OSI, and lipid hydroperoxide; and reduced total free sulfhydryl levels in patients with acromegaly which were considered as indicative of increased systemic oxidative stress. On the contrary, Ozkan et al 19 found no difference between the acromegaly and control groups in terms of oxidative stress parameters, which also were not correlated with the atherosclerosis-related parameters such as flow mediated dilatation, increased carotid intima media thickness (CIMT) and epicardial adipose tissue thickness (EAT) in patients with acromegaly. In agreement with the study by Ozkan et al, 19 the current study did not find any statistically significant difference in systemic oxidative stress parameters between the acromegalic patients and controls. Hemorheological parameters are impacted by oxidative stress.23,24 All the same, alterations in oxidative stress do not account for the variations in hemorheological markers that we observed.
Despite the insights provided by this study, there are still several limitations that warrant consideration. Patients with acromegaly under treatment were included in the current study as these patients could not be left untreated in accordance with the ethical norms. Patients with acromegaly under treatment were included in the current study as these patients could not be left untreated in accordance with the ethical norms. We recommend conducting a similar study in newly diagnosed treatment-naïve acromegaly patients. The sample size in this study was relatively small, and further research with larger cohorts may be necessary to validate the observed hemorheological changes in acromegalic patients. Additionally, this study focused on erythrocyte deformability and aggregation, and future research should explore other parameters such as plasma and whole blood viscosities, reticulocyte count and inflammatory markers to obtain a more comprehensive understanding of blood flow dynamics in acromegaly.
In conclusion, this pilot study demonstrated reduced erythrocyte deformability and increased erythrocyte aggregation in patients with both active and controlled acromegaly, while systemic oxidative status remained unchanged. Further studies in this field are necessary for better understanding and managing hemorheological alterations in patients with acromegaly.
Footnotes
Acknowledgments
This study has been supported by the Pamukkale University Scientific Research Projects Coordination Unit (2016HZDP017). The authors declare no financial or proprietary interest in any product or company associated with any device, instrument or drug mentioned in this article. The authors appreciate Hande Senol, PhD, from the Department of Biostatistics for statistical assistance.
Funding
The author disclosed receipt of the following financial support for the research, authorship, and/or publication of this article.
Declaration of conflicting interests
The author declared no potential conflicts of interest with respect to the research, authorship, and/or publication of this article.