
Abstract
Background
Red blood cell aggregation is largely influenced by hematocrit and plasma protein content with aggregation increasing as hematocrit and fibrinogen increase. Aggregation measurement techniques include light-transmission or laser-backscatter, and the impact of measurement technique on aggregation measurements with respect to changes in hematocrit and plasma protein is not well understood.
Objective
The objective of this study was to evaluate aggregation measurement techniques with respect to common effectors of red blood cell aggregation.
Methods
We obtained whole blood samples from 10 healthy participants and varied hematocrit, plasma albumin, and plasma fibrinogen concentration in a sample of healthy male and female participants. We then measured red blood cell aggregation using a Myrenne Aggregometer (light-transmission aggregometer) and a Laser Optical Rotational Red Cell Analyzer (laser-backscatter aggregometer).
Results
For Myrenne, aggregation increased from 30% to 40% hematocrit, then declined at 50% hematocrit. Measurement in the LORRCA demonstrated an increase as hematocrit increased from 30% to 40%, and again increased at 50%, which differed from the light transmission method. Red blood cell aggregation increased with increased fibrinogen concentration, but did not change significantly as albumin concentration increased.
Conclusions
Red blood cell aggregation is expected to increase as hematocrit increases, but when light transmission aggregometry is used, aggregation decreases as hematocrit increases past 40%. Each measurement technique has its own set of methodological strengths and weaknesses.
Background
Blood is a non-Newtonian fluid with shear-thinning behavior that is due to red blood cell (RBC) aggregation, a low energy and easily reversible attraction that results in rouleaux formation at low shear-rates. RBC aggregation underlies the non-linear increase in blood viscosity at low shear-rate blood flow.1,2 As rouleaux move from the low shear-rate microcirculation and systemic venous system into the heart, atrial and ventricular contractions disaggregate RBC and the high shear-rate flow in the artery further monodisperses RBC. Monodispersion decreases blood viscosity and alters the distribution of RBC at branch points in the arterial microcirculation. Altered RBC aggregation plays a role in various cardiovascular, metabolic, and inflammatory diseases, such as sickle cell anemia, single ventricle congenital heart disease, diabetes, sepsis, or obesity.2–4 Changes in RBC aggregation observed in these diseases are due to hematocrit, plasma proteins, or both, all of which disrupt normal microcirculatory and venous blood flow.4–6 Hence, quantification of RBC aggregate formation provides insight into the mechanics of blood flow and adverse effects on the vascular system in health and disease. Two direct methods of RBC aggregation measurement are light-transmission and light-reflection, 7 which provide valuable kinetic information about how rouleaux form. The aim of this brief study was to evaluate measurement techniques and common effectors of red blood cell aggregation.
Methods
Native blood was drawn into ethylenediaminetetraacetic acid vacutainers from a population of 10 healthy volunteers (5 male, 5 female) aged 20–59 years old. All blood preparation was started within one hour of blood collection and rheology testing was started within four hours of blood collection. This study was approved by the Institutional Review Board at Children's Hospital Los Angeles, and participants provided informed consent for participation.
RBC aggregation was measured in triplicate by light-transmission aggregometry (Myrenne GmbH, Roetgen, Germany) using 35 µl of blood and laser-backscatter aggregometry (Lorrca MaxSis, RR Mechatronics, Netherlands) using 2.5 ml of blood. Myrenne measurements were done at room temperature, and Lorrca measurements were done at 37°C.
Hematocrit effect on RBC aggregation
RBC were suspended in either plasma or 3% 70kD dextran at 30%, 40%, and 50% hematocrit (hct). Aggregation was measured in Lorrca and Myrenne. Hct was measured using microfuge capillary tubes centrifuged at 12,000 G for 4 min. Whole blood hematocrit was adjusted by removing plasma after centrifugation to increase hct or by the addition of autologous plasma to lower hct.
Plasma protein effect on RBC aggregation
Normal levels of albumin (4.5 g/dL) and fibrinogen (300 mg/dL) were assumed. Albumin (A1653, Sigma-Aldrich, MO) was added to subjects’ 40% hematocrit blood samples to increase the albumin concentrations by 25% (1.125 g/dL) and 50% (2.250 g/dL), relative to assumed normal levels. Similarly, fibrinogen (F3879, Sigma-Aldrich, MO) was increased by 5% (15 mg/dL), 25% (75 mg/dL), and 50% (150 mg/dL). All protein experiments were performed in whole blood corrected to 40% hematocrit and suspended in native plasma at 37°C to reduce the time required to dissolve the albumin/fibrinogen. A portion of whole blood was centrifuged, and plasma removed to adjust fibrinogen or albumin concentration. After fibrinogen and albumin were dissolved in patient plasma, red blood cells were resuspended in the plasma at the specified hematocrit, which was confirmed using the spun hematocrit technique as described above. There was no change in plasma viscosity or blood viscosity with the addition of albumin or fibrinogen, measured over shear-rate range 37.5 s−1 to 1500 s−1 (data not shown).
Statistical analyses
Statistical analyses were performed using JMP© Pro (SAS Institute Inc., NC). Two-sample Student's T-test and Wilcoxon Rank Sum test were used for normally and non-normally distributed data. A mixed-effects model was used to test for differences in aggregation by type of suspension (dextran/plasma) and hematocrit (30%, 40%, 50%). For experiments testing change in aggregation at increasing albumin or fibrinogen concentration, we used repeated measures analysis. A p-value < 0.05 was considered statistically significant for each analysis.
Results
There was no difference in age (39.5 ± 7.30 years), height (170.2 ± 7.81 cm), weight (65.3 ± 7.77 kg), body surface area (1.75 ± 0.14 m2), or body mass index (22.4 ± 1.32 kg/m2) between male and female participants (total n = 10, data not shown). There was no effect of sex on aggregation measurements after controlling for type of suspension, hematocrit, and protein changes.
Using the Myrenne, there was a peak in aggregation at stasis at 40% hematocrit with a subsequent decline at 50% hematocrit in both suspensions (p = 0.0013, Figure 1(a)). As expected, RBC aggregation in dextran suspension was higher than plasma (p = 0.0003, Figure 1(a)). There was a larger drop in aggregation at 50% hematocrit in plasma (Suspension*Hematocrit, p = 0.0005) compared to dextran.
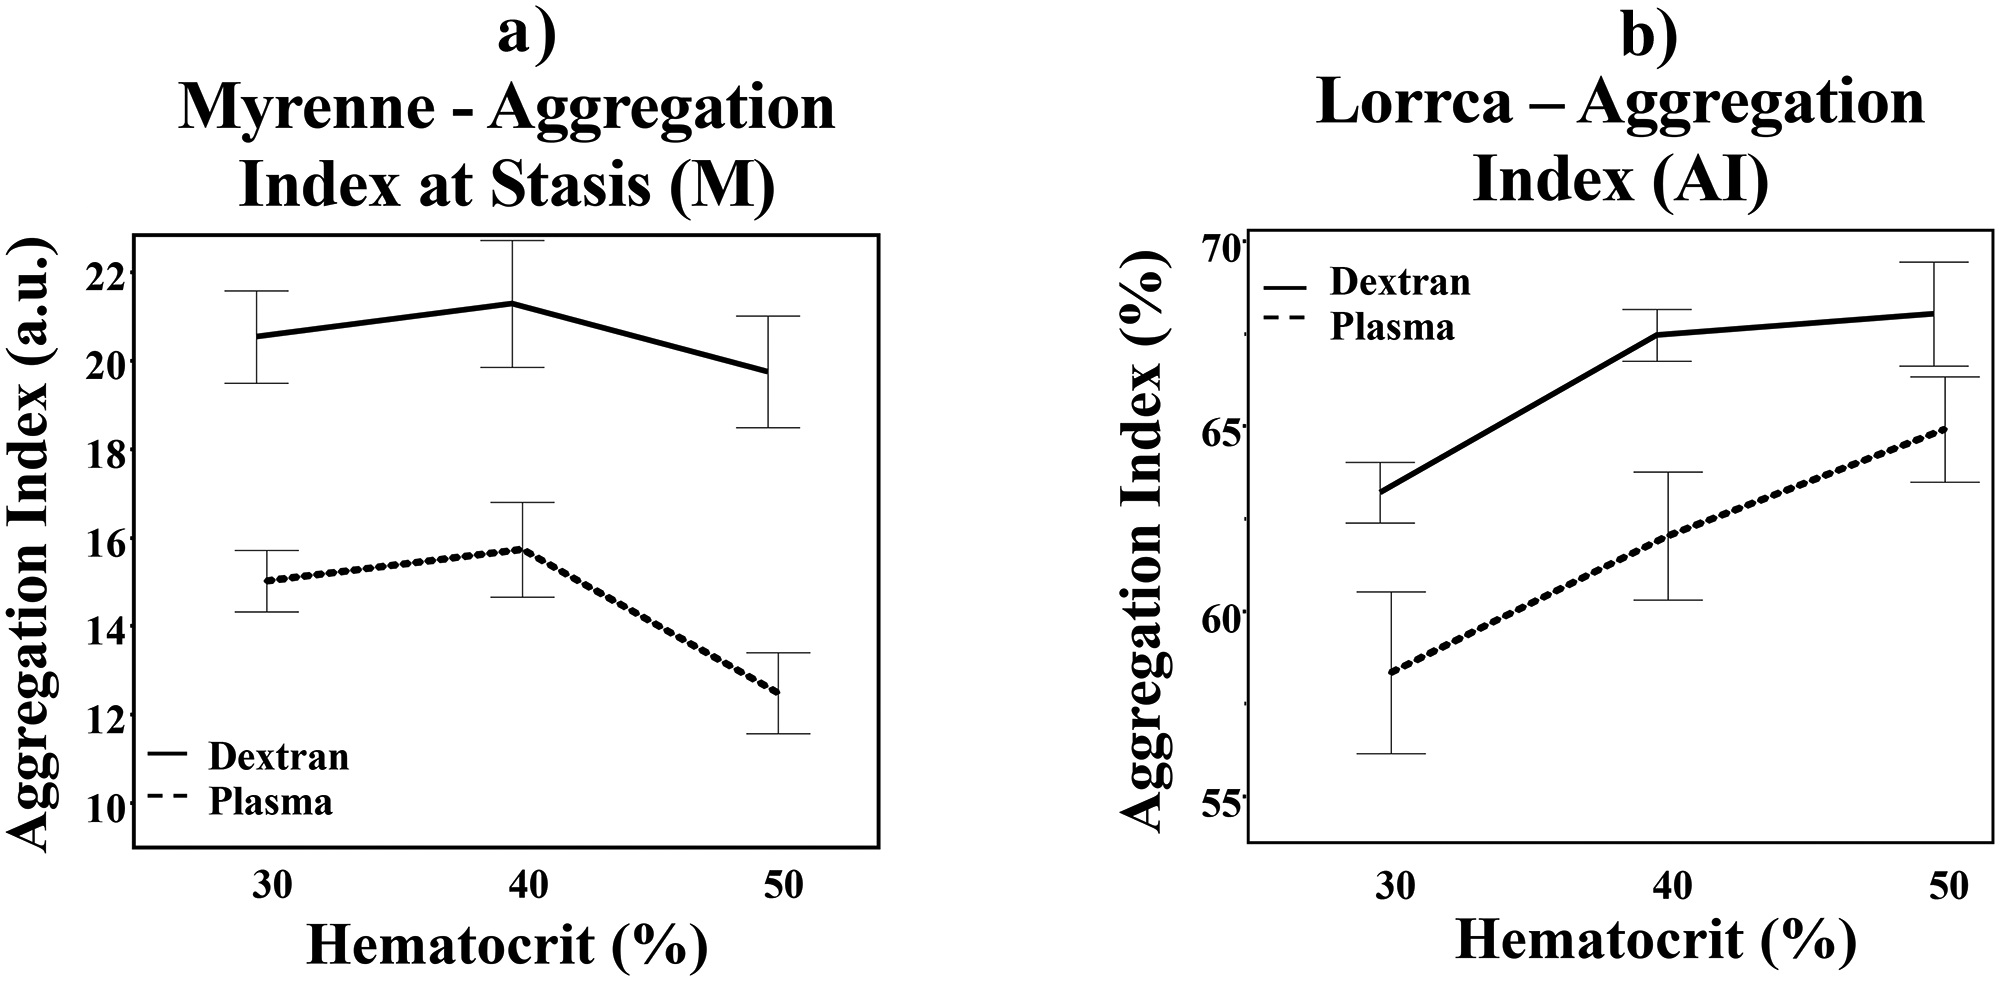
Red blood cell aggregation at varying hematocrit levels in dextran and plasma utilizing light-transmission (a) and laser-backscatter (b) measurement methods. Solid line = dextran. Dashed line = plasma. Error bar = 1 standard error from the mean.
Using the Lorrca, RBC aggregation in both dextran and plasma increased as hematocrit increased but did not have a drop in aggregation at 50% hematocrit (p = 0.0001, Figure 1(b)). There was a trend toward higher aggregation in dextran vs. plasma using the Lorrca (p = 0.0656) and there was no interaction between type of suspension and hematocrit (Suspension*Hematocrit, p = 0.1013).
Increased albumin did not affect RBC aggregation (p = 0.8714, Figure 2(a)). However, RBC aggregation increased as fibrinogen levels increased (p < 0.0001, Figure 2(b)).
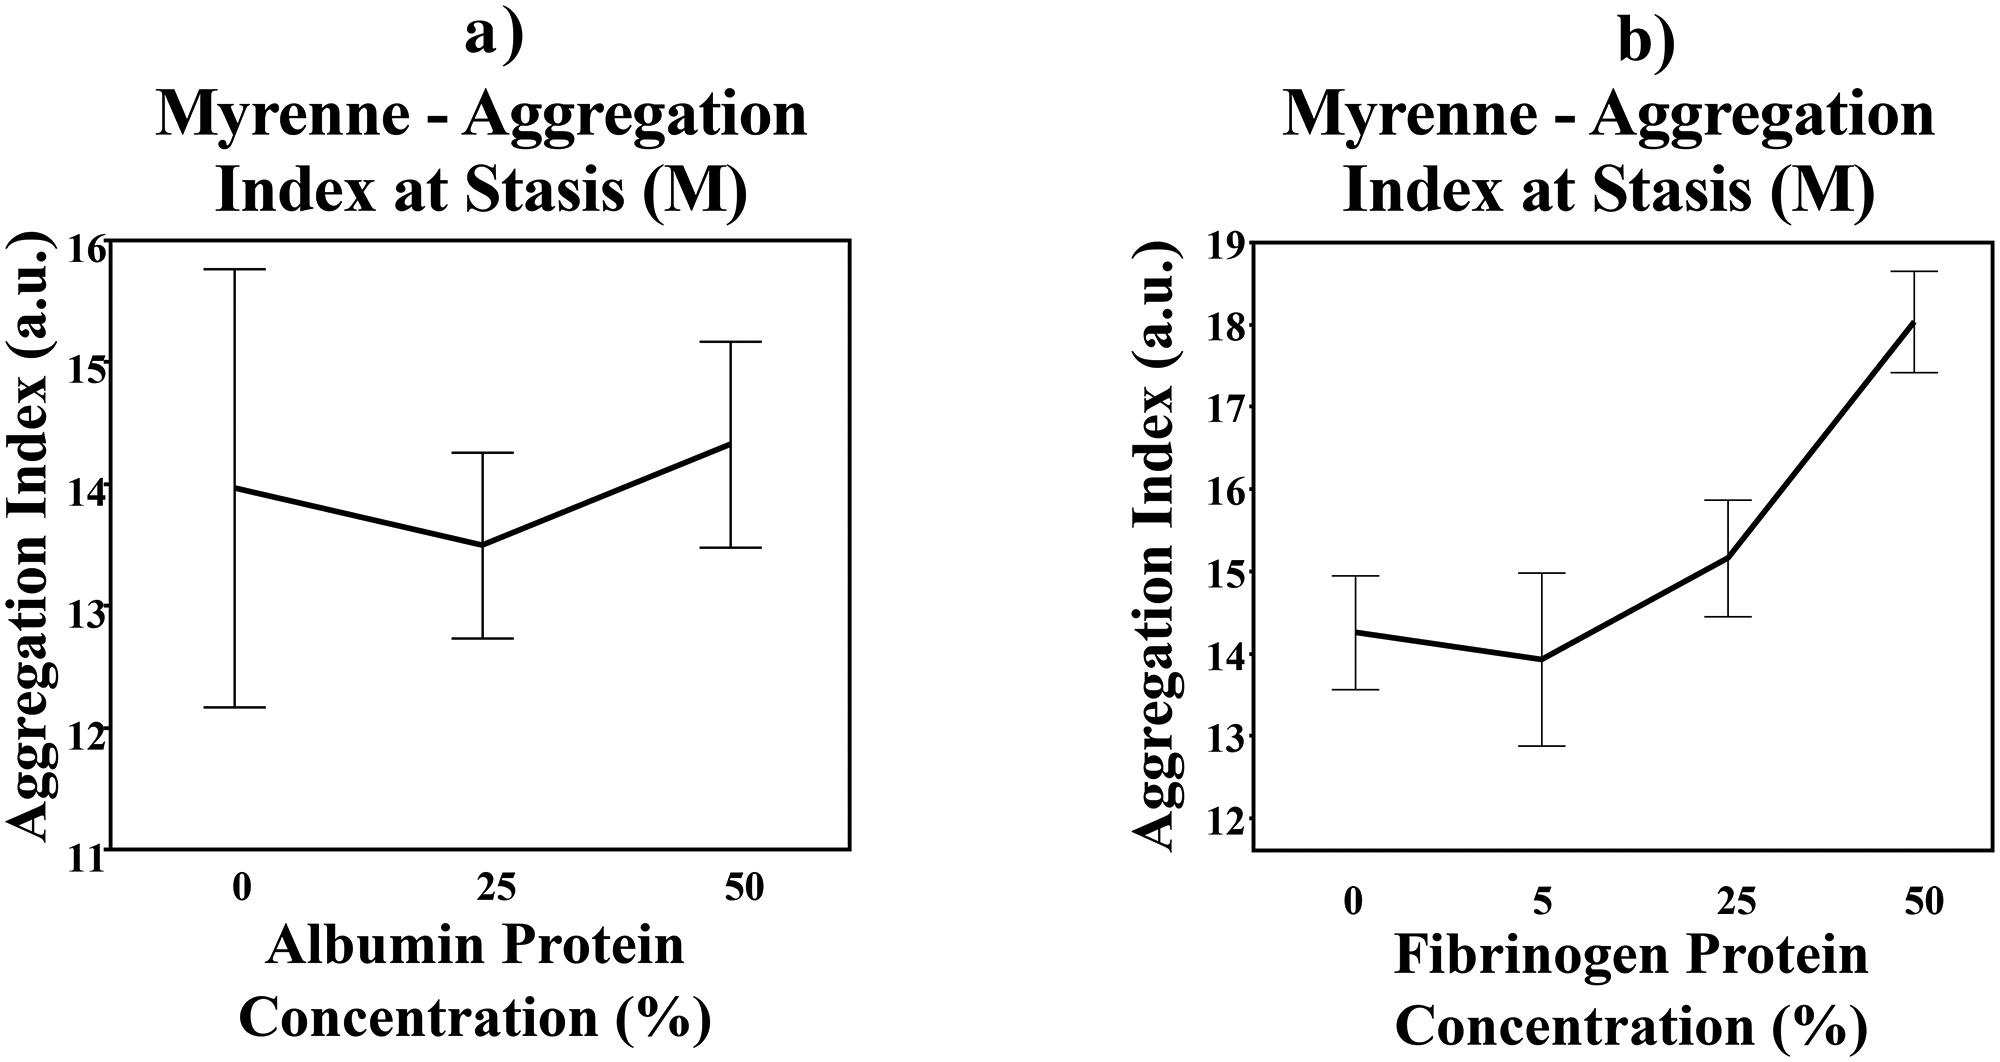
Red blood cell aggregation at varying albumin (a) and fibrinogen (b) protein concentration levels via light-transmission measurement method. Error bar = 1 standard error from the mean.
Conclusions
RBC aggregation increases with hematocrit to a theoretical maximum viscosity above which aggregation plateaus. However, our data suggests that the effect of hematocrit on aggregation differs based on the measurement method. We found that RBC aggregation peaked at 40% hematocrit then subsequently declined at 50% hematocrit when using the light-transmission aggregometer (Myrenne), which measures RBC aggregation by measuring the amount of light traveling through the RBC layer and hitting the detector on the other side. Therefore, increased light-transmission equates to more space between cell aggregates and thus increased aggregation; when this is measured over time, the kinetics of aggregation can also be determined. The decrease in RBC aggregation at 50% could be due to the smaller gaps between aggregates when the hematocrit increases above 40%, causing a machine-perceived decrease in aggregation. 8 With the laser-backscatter aggregometer (Lorrca), aggregation measurements continue to rise at hematocrit levels above 40% because this technique utilizes diffraction patterns which are dependent on the physical properties of individual RBC and RBC aggregates, not gap formation. These findings were consistent in both the plasma and dextran suspensions, confirming that the discrepancies in RBC aggregation measurements were due to systematic measurement differences that are hematocrit dependent.
The decrease seen in light-transmission aggregation measurement at hematocrit > 40% is not intended to discount the validity of the light-transmission technique. This is a valid technique that uses lower blood volume (35ul) compared to current laser-backscatter techniques (2 ml). These findings are meant to improve comparison between techniques and to ensure intra-laboratory methods provide consistent and comparable results. We did not explore RBC surface protein modification nor RBC mechanics, both of which are known to enhance or inhibit aggregation. 9
The suspending medium plays a significant role in aggregation strength and kinetics. 10 Suspending protein or polymer molecular weight and hydrodynamic radius (RH) impact RBC aggregation, with an RH < 4 nm inhibiting aggregation and RH > 4 nm enhancing aggregation. 10 Plasma fibrinogen has RH = 11 nm, which enhances aggregation; whereas albumin with RH = 3.5 nm has little effect on aggregation. Our aggregation measurements using whole blood corrected to 40% hematocrit with increasing fibrinogen and albumin concentrations confirm prior works. Interestingly, albumin forms oligomers at high enough concentration, which are known to enhance aggregation. 11 While not statistically significant, our data showed that aggregation appears to increase slightly at the highest albumin concentration, A previous study has shown a synergistic effect amongst the three primary plasma proteins (fibrinogen, albumin, immunoglobin), as immunoglobin increases RBC aggregation in the presence of elevated fibrinogen concentrations and normal-to-high albumin concentrations in plasma. 12 This highlights another modifiable feature of the suspending medium and future studies could explore the interactions amongst the plasma proteins.
In conclusion, red blood cell aggregation measurement is influenced by multiple factors including hematocrit, plasma protein content, and red blood cell properties. Aggregation measurement techniques have improved significantly, but each method has its own set of methodological strengths and weaknesses. Hematocrit correction to approximately 40% or lower should be considered to best match aggregation results across the two different techniques. Furthermore, RBC cellular mechanics, RBC surface protein and plasma characterization provide valuable insight into the mechanisms of aggregation and potential for secondary modifications. This is critical to our understanding of red blood cell aggregation and its disease specific alterations.
Footnotes
Funding
The author disclosed receipt of the following financial support for the research, authorship, and/or publication of this article: This work is supported by funding from National Heart, Lung and Blood Institute, NIH# 1 K23 HL 119627–01A1 (J.A.D.) and Additional Ventures Foundation (J.A.D.).
Declaration of conflicting interests
The author declared no potential conflicts of interest with respect to the research, authorship, and/or publication of this article.