
Abstract
Growing concern about economic inequality has generated a polarized narrative regarding the causes and consequences of extreme wealth. We contend that divided ideological positions obscure a more mundane reality about the typical wealthiest 1% households. Using data from the triennial survey of consumer finance, we demonstrate that there is substantial heterogeneity within the 1%. Contrary to public discourse, the typical 1% household does not have wealth reflective of popular rich lists, but derives a significant share of its wealth from ownership and active management of small- to medium-sized private enterprise. We use these findings to shed new insights on business families’ relationship to economic inequality and open promising new areas of inquiry regarding the role of the family business in society.
Economic inequality in the United States has been steadily rising since 1983 (Wolff, 2012), placing the wealthiest 1% at the center of public discourse (Keister, 2014; Piketty, 2014). Narratives surrounding the 1% have become deeply polarized. On the one hand, the 1% are exalted as self-made success stories that reflect legitimate market returns to talented individuals and so perpetuate the American dream (Kaplan & Rauh, 2013). This perspective reflects a merited self-made wealth ideology that stresses the value of free market capitalism and legitimates wealth accumulation as a necessary incentive for economic growth and prosperity (Beckert, 2004). On the other hand, the 1% are vilified as unmerited inheritors of family fortunes (Moriarty, 2012), opportunistic corporate and financial executives unfairly redistributing rents from labor (Bebchuk, 2009) with a rapacious financial sector preying upon small savers (Atkinson, 2015). At either end of the polarity are differing normative conceptions about the how the firm should be governed and the appropriate role of the corporation in society.
An emerging body of research is forming to address the relationship between business interests and economic inequalities. One stream of work sees market-oriented governance and managerial practices as a driver of inequalities (Cobb, 2016; Davis, 2009). Another views rising economic inequality as a growing source of potentially threatening contingencies for corporations (Bapuji, 2015; Bapuji & Neville, 2015). With this article, we contribute to this new area of research by drawing attention to a prevalent, but often unregarded, form of corporate governance manifested in the family firm. We define the family firm as a business entity that is privately owned and managed by a household. Unlike traditional shareholder value and managerialist models of corporate governance, which see owners, managers, and workers as distinct constituencies, family firm governance fuses ownership and control into the hands of an owner-manager or owning family. The fusion of ownership and control concentrates family financial capital in productive non-financial assets (e.g., factories, machines) and incorporates family labor in the form of entrepreneurial insight and executive oversight into the business. As such, business family households are neither “working rich” nor “rentier capitalists” (Saez, 2009).
By utilizing the triennial Survey of Consumer Finance (SCF), we identify a substantial population of owner-managers by decomposing the income and wealth portfolios of the top 1% of U.S. households. By doing so, we aim to achieve two primary objectives. First, we go beyond analyses of “rich lists” such as the Forbes 500 richest Americans (Kaplan & Rauh, 2013), which have established billionaire entrepreneurs and wealthy inheritors as the public face of the 1%. We reveal the 1% to be a heterogeneous class of some 1.6 million households (Saez & Zucman, 2014). The typical 1%er household has a net worth of $29 million and derives the most significant portion of its wealth from active ownership and management of unincorporated small- to medium-sized enterprises (SMEs), generally considered to be “family firms.” Thus, family firms represent an important factor in the 1% that does not conform to the dominant narratives. Second, we consider how this neglected factor relates to economic inequality and open up new avenues for promising research at the intersection of family business, society, and inequality. We identify an unresolved ambiguity with respect to family governance and inequality: whereas some scholars view SME family firms as a stakeholder friendly organizational form (Miller, Le Breton-Miller, & Scholnick, 2008) that may mitigate inequality in the communities they serve, we suggest that family businesses constitute an understudied social class that serve their own dynastic interests through the use of distinct wealth accumulation mechanisms, which permits the transfer of substantial wealth and social advantage to succeeding generations. However, we posit that the balance of family firms’ effect on inequality may be contingent on income versus wealth inequality and institutional context (Judge, Fainshmidt, & Brown, 2014).
To make these contributions, we begin by considering how models of corporate governance have influenced inequality in North America over time. Corporate governance defines the distribution of power among different stakeholder interests and as such plays an important role in shaping how business intersects with society. We build the argument that the omission of family firm governance from this debate has led to an incomplete picture of the agents influencing wealth inequality (Saez & Zucman, 2014).
Corporate Governance and Inequality
In his authoritative depiction of the rise of managerial capitalism, Alfred Chandler (1977) documents the dynamics of its central institution, the professionally managed multidivisional firm. The multidivisional firm is owned by dispersed shareholders, but controlled and operated by professional executives. Chandler characterized the United States as the “seedbed of managerial capitalism” affirming the Berle and Means (1932) thesis that the separation of ownership and control was the distinctive feature of American capitalism. For many, the American managerialist model represented an equitable and egalitarian form of capitalism where meritocratic corporate structures provided the possibility of upward mobility. A variety of management practices such as wage setting, promotion, and skill development were determined with reference to internal labor markets and firm-specific benchmarks, which enabled employment and income security (Cobb, 2016). In the managerialist conception of the firm, the largest American enterprises were socially significant institutions, a natural product of social needs and pressures that served the interests of multiple interests (Selznick, 1957), and in Davis’ terms “soulful” and socially responsible entities (Davis, 2009). In the managerialist conception of firm governance dispersed ownership (Berger, 1987) and countervailing power, institutions protected workers and consumers from the worst excesses of powerful corporations (Galbraith, 1968/1952), a view captured in a popular refrain of the era that “what was good for General Motors was good for America.”
Managerialism placed significant power over resource allocation and rent distribution into the hands of corporate executives and was not without its critics. Oliver Williamson (1963) suggested that managerialism in the multidivisional firm relaxed the constraints imposed by market forces and led to a “greater emphasis on non-profit goals of interest groups other than that of stockholders” (p. 1032). Jensen and Meckling (1976) provide an agency theoretic critique of self-serving professional executives in the managerial controlled firm. Milton Friedman’s (1970) famous essay on the corporate social responsibility (CSR) of the corporation can be read as a polemic against the excesses of 1960s era managerialism.
Managerialism was partially eclipsed during the 1980s with the rise of a competing conception of firm governance—the shareholder value model (Fligstein, 1990). The shareholder value concept views the firm as a nexus of contracts and an expendable tool which is subordinate to the interests of its owners. The financial value of the firm could be established by a “chop shop” model and the firm could be legitimately dismantled if the sum of its parts were greater than the whole (Davis, 2009). Moreover the boundaries of the firm became more permeable and organizational subunits, and production facilities were readily outsourced or offshored on the basis of current costs (Cobb, 2016). The emphasis on shareholder value ushered in an “investor revolution” by placing significant control into the hands of capital markets that favored the redistribution of corporate rents away from labor to shareholders (Davis, 2009; Useem, 1993). Paradoxically, the rise of shareholder value governance also increased returns to corporate executives as managerial compensation became increasingly linked to stock ownership (Goldstein, 2012). While the pursuit of shareholder value produced steady increases in corporate profits, returns to labor decreased over the same time period. Brynjolfsson and McAfee (2014) show that as corporate profits as a percentage of gross domestic product (GDP) have increased over time, wages as a percentage of GDP have decreased from over 65% of GDP in 1950 to just over 55% of GDP in 2014 (Berstein & Raman, 2015). The result is a decoupling of median household income and job employment from GDP growth despite improved labor productivity (Brynjolfsson & McAfee, 2014).
Both managerialism and shareholder value systems omit the role and prevalence of family firm governance in the U.S. business and society landscape. Advocates of managerialism were indifferent to the family firm, which they associated with inefficiency and nepotism and emphasized the technical superiority of professional management. Chandler (1977) went so far as to declare the demise of the family firm as an important corporate form among large-scale American enterprise. Advocates of shareholder value governance also highlighted the value destroying effects of family ownership on publicly listed corporations (Morck, Wolfenzon, & Yeung, 2005). These depictions of the family firm have been instrumental in fueling a long-running narrative of the family firm as an antiquated and inefficient type of organization that is incompatible with technologically dynamic capitalism. Some contemporary theories of the family firm have sustained this rather dysfunctional narrative of viewing family businesses as an emotional organizational form (Gomez-Mejia, Cruz, Berrone, & De Castro, 2011) that would go so far as rejecting sure economic gain for the sake of a socio-emotional attachment to the firm (Gomez-Mejia, Takacs Haynes, Nunez-Nickel, Jacobson, & Moyano-Fuentes, 2007).
However, a now largely forgotten exception to Chandler’s conventional wisdom of the time was a body of work by social class theorists who proposed that a significant concentration of wealth remained in the hands of an elite “capitalist class” of old money families. Zeitlin (1974) argued that the separation of ownership and control was a “pseudofact” that deflected attention from critical social problems and that “identifiable families and other cohesive ownership interests” remained “principal shareowners in . . . large corporations, as well as the owners of other forms of large-scale income-bearing properties” (p. 1079).
According to Zeitlin, the continued concentration of corporate ownership by wealthy families was veiled by the frequent use of nominee accounts. Through nominee accounts corporate interests are not readily linked to individual owners, but rather held in the name of voting trusts, foundations, and holding companies. Indeed it is only recently that research diligently tracing ultimate beneficiaries of shareholdings has been able to reestablish the extent of family ownership in U.S. public listed firms (Anderson & Reeb, 2004; Villalonga & Amit, 2006). Even still, estimates of family control are likely to be understated. The recent leak of the Panama Papers revealed the prevalence of nominee accounts and mechanisms used by elite families to obscure their business interests and the true magnitude of their wealth. Today, Zeitlin’s analysis appears prescient in light of contemporary debates about economic inequality and public discourse characterizing the “1%.” Nevertheless, the capitalist class literature on the enduring power and concentration of family wealth in the economy simply “fizzled out” in the late 20th century (Gilding, 2005).
Recently, a revanche of the capitalist class literature has occurred around the issues of income and wealth inequality. The income inequality strand portrays a working rich narrative suggesting that labor market dynamics have created increasing levels of inequality over the past three decades. The dynamic driving rising inequality is the appearance of a new class of top income earners that is appropriating a disproportionate fraction of productivity gains arising from technological change and globalization (Saez, 2009). This form of inequality is believed to be particularly accentuated in the United States due to the rise of equity-based executive compensation (Bebchuk, 2009) and large bonuses paid to top hedge fund managers and law partners.
The other strand of capitalist class literature can be seen in wealth inequality arguments that evoke a re-emergent rentier class in a “capital is back” narrative (Piketty, 2014; Saez & Zucman, 2014). This view emphasizes inherited wealth and is prevalent in a wider range of mature industrial societies, including societies that are not typically associated with inequality such as Norway (Hansen, 2014), France, and Sweden (Piketty, 2014). According to this perspective, long-run average returns on capital greater than the rate of economic growth (the now well-known equation, r > g) produces widening economic inequality. This phenomenon is accentuated among top wealth owners benefiting from the “scale” effects of contemporary portfolio capital management techniques generating significantly higher than normal rates of return. Moreover, the resurgence of wealth inequality is driven by a longer run intergenerational dynamic. Unlike income generating capacity (talent, know-how, skill, effort), which is not readily transmissible to children, financial wealth is heritable. Thus, there is a concern for the re-emergence of rentier capitalists, a generation of wealthy individuals who are able to live well on their inherited wealth alone.
However, total economic inequality is the sum of both income and wealth inequality and the two prevalent narratives described above overlook a third, more ambiguous phenomena—the business family. Business families own substantial non-financial assets in the form of unincorporated business equity, and generate both employment and capital income from their assets. Thus, the business families among the 1% wealthiest Americans fit neither the predefined narratives of “working rich” or “rentier” capitalists.
Capital Portfolios in the U.S. Wealthiest 1% Households
Income and Wealth Inequality Trends
Both income and capital wealth contribute to economic inequality, but they are sometimes confused. Income refers to periodic cash flows from employment, dividends, interest, rents from real estate, and periodic capital gains (Keister, 2014). Capital wealth is equivalent to household net worth (the sum of household assets net of debt and other liabilities). Household wealth can be further decomposed into non-financial and financial assets. Non-financial assets include the value of a principal residence, other real estate, and unincorporated (i.e., private) business assets (Keister, 2014). Financial assets include cash accounts, stocks (investments in publicly listed firms), bonds, pooled investment funds, and retirement accounts. Our focus is on wealth, but employment and business income play an important role since business families derive both profits and executive compensation from their self-managed businesses. Further, business families also exhibit high savings rates (Quadrini, 1999), which contribute to wealth accumulation. It is well established that wealth inequality is more extreme than income inequality in the United States (Keister, 2014; Keister & Moller, 2000) and long-term trends in wealth inequality are becoming more pronounced. Keister and Moller (2000) estimate that the top 1% wealthiest families owned approximately 30% of wealth in the 1950s, which has grown to 38.5% in 1995. President Obama, in the 2014 State of the Union address, announced that the wealthiest 1% now possess some 40% of the nation’s wealth. Oxfam (2015) estimates that in 2016, the top 1% worldwide now control more than 50% of global wealth. According to Saez and Zucman (2014), the rise in wealth inequality is due entirely to the growth in the top 1% wealth share, a narrow band of approximately 160,000 households. This ultra-high net worth class accelerated from possessing 12% of national wealth in 1979 to 22% of national wealth in 2012. However, the wealth of the remaining 1.4 million 1%ers tracks more closely to overall population gains.
Accurately capturing the financial structure of wealthy families is problematic. Wealthy families are typically reluctant to disclose the extent of their wealth rendering rich lists unreliable (Kaplan & Rauh, 2013; Keister, 2005) and failing to provide a comprehensive picture of wealth holdings (Piketty, 2014; Piketty & Saez, 2001). The most reliable source for wealth distributions is the Federal Reserve’s SCF which has become the standard in research on inequality (Keister, 2014; Keister & Lee, 2014; Wolff, 2012). The SCF is a triennial survey of some 6,000 U.S. households since 1983. The SCF includes fine-grained data on diverse households’ income and asset sources. Special efforts are taken to (a) oversample from wealthy households to ensure an accurate representation of their holdings (identified through Internal Revenue Service data; Johnson & Moore, 2005) and (b) improve data accuracy and impute missing data (Keister, 2014; Kennickell, 2008, 2011). Consistent with previous research (Keister, 2014), we use the five imputations as independent observations and apply sample weights to correct for oversampling. Thus, for the 6,015 families interviewed for the SCF in 2013, there are 30,075 observations. The SCF sample also specifically excludes individuals identified in rich lists or where the data provided cannot be concealed to protect confidentiality (Kennickell, 2008).
Decomposing the Finances of the 1%
In our analysis, we review previous findings, but also present original empirical estimates from the 1989 to 2013 SCFs. As recent research has closely covered 2001 to 2010 and because more recent data are now available, we focus on the 2013 SCF unless otherwise noted. Following Keister (2014), we calculate the top 1%, next 9%, and 90%.
In 2013, to be included in the top 1% income earners requires $692,925 and to be included in the top 1% based on wealth requires $7.88 million in assets. Both income and wealth in the 1% are highly skewed toward the right side of the distribution (Bulmer, 2012). Table 1 presents a detailed decomposition of the finances of the 1%, 9%, and 90% as determined by net worth. The percentages show the ratio of a particular asset or income category as a percentage of total net worth. The average 1% has 66.0% of wealth in non-financial assets compared with 35.5% of wealth in financial assets. 1
2013 Wealth Decomposition for the 1%, Next 9%, and 90%.

We compare the typical (median) 1%er, situated at the midpoint in the distribution with the average (mean) 1%er who is situated higher in the echelons of the wealth hierarchy. Substantial differences between mean and median income and asset values suggest that the 1% is a heterogeneous category. There are large differences between mean and median values for non-financial ($51.9 million vs. $16.1 million median) and financial assets ($27.9 million compared with $9.3 million). The SCF differentiates between actively managed businesses where the household is involved in both ownership and management of a private enterprise, and non-active (i.e., passive) businesses where the household holds ownership interest but is not involved in management. A full 76% of individuals in the 1% own an actively managed business and 87% have at least some private business ownership. However, passive business assets are only utilized by the upper echelon of the 1% (i.e., median values are 0 for these categories). There are also substantial differences in actively managed business assets with mean value of $34.8 million compared with a median value of $5.9 million.
Given that more than 50% of the households in this category will have fewer business assets than the median 1%er, these data suggest that the typical 1%er is a prosperous small- to medium-sized business household generating a comfortable income from its operations. This lower segment of the 1% may be characterized as entrepreneurial owner-managers. In addition, this segment of the 1% do not seem to fit into the characterization of super-managers deriving large employment incomes or capital gains from stock-based compensation. Rather the SCF data show that this segment of the 1% typically has a business that generates $13 million in revenues with some 30 employees. While the typical 1%ers do not possess the enormous wealth associated with Forbes billionaires, they do represent a prosperous class whose business holdings constitute a significant part of their asset portfolio. Business income (i.e., profits) represents a greater source of income for the 1%, while income from employment (wage salary) is substantially lower (as a % of net worth) for the 1% (0.8%) compared with the 9% (5.4%) and 90% (41.6%).
Taking a broader view, the inequality in U.S. household asset portfolios is evident in Table 1. The most important asset for the 9% and 90% household segments is the primary residence (24.8% and 106.6% respectively) and retirement accounts (19.0% and 39.2%). However, these two assets represent a smaller portion of the 1%’s overall wealth (4.1% for primary residence and 2.0% of retirement accounts). By far the largest concentration of wealth for the 1% occurs in actively managed businesses (44.3%). This asset category consists of businesses where the individual or a household member has an active management role. Further, we find that the 1% has private business ownership in 4.6 firms (2.9 actively managed and 1.7 passively owned firms) compared with an average of 0.13 for the 90% (0.12 actively managed and 0.01 passively owned firms).
These findings are consistent with and augmented by evidence from Wolff (2012) that the top 10% of households hold 91.9% of business equity (61.4% by the 1% and 30.5% by the next 9%). Moreover, the prevalence of entrepreneurial owner-managers among the wealthiest 1% is not a recent phenomenon. In their analysis of the 1989 SCF data, Cagetti and De Nardi (2008) find that 63% of the wealthiest 1% households have entrepreneurs who declare being self-employed by owning and actively managing a privately held business. By this definition, these entrepreneurs hold some 68% of the total wealth owned by the wealthiest 1%.
Trends in the 1%’s Wealth Sources
Figure 1 shows the composition of major financial and non-financial asset categories as a percentage of net worth for the 1% and 99% for each triennial wave of the SCF from 1989 to 2013. We present this as a stacked percentage of net worth to clearly show how sources of wealth vary substantially between the 1% and 99%. We find that active businesses consistently represent the largest asset category of the 1% (save for a brief surge in the value of financial assets during the 2001 dot-com boom) fluctuating between 40% and 45% of net worth. Passive business ownership consists of a non-trivial 5% to 10% of net worth for the 1%. However, active businesses represent a far lower share of net worth for the 99%, hovering just below 10%, and passive business ownership is practically non-existent at less than 1%.
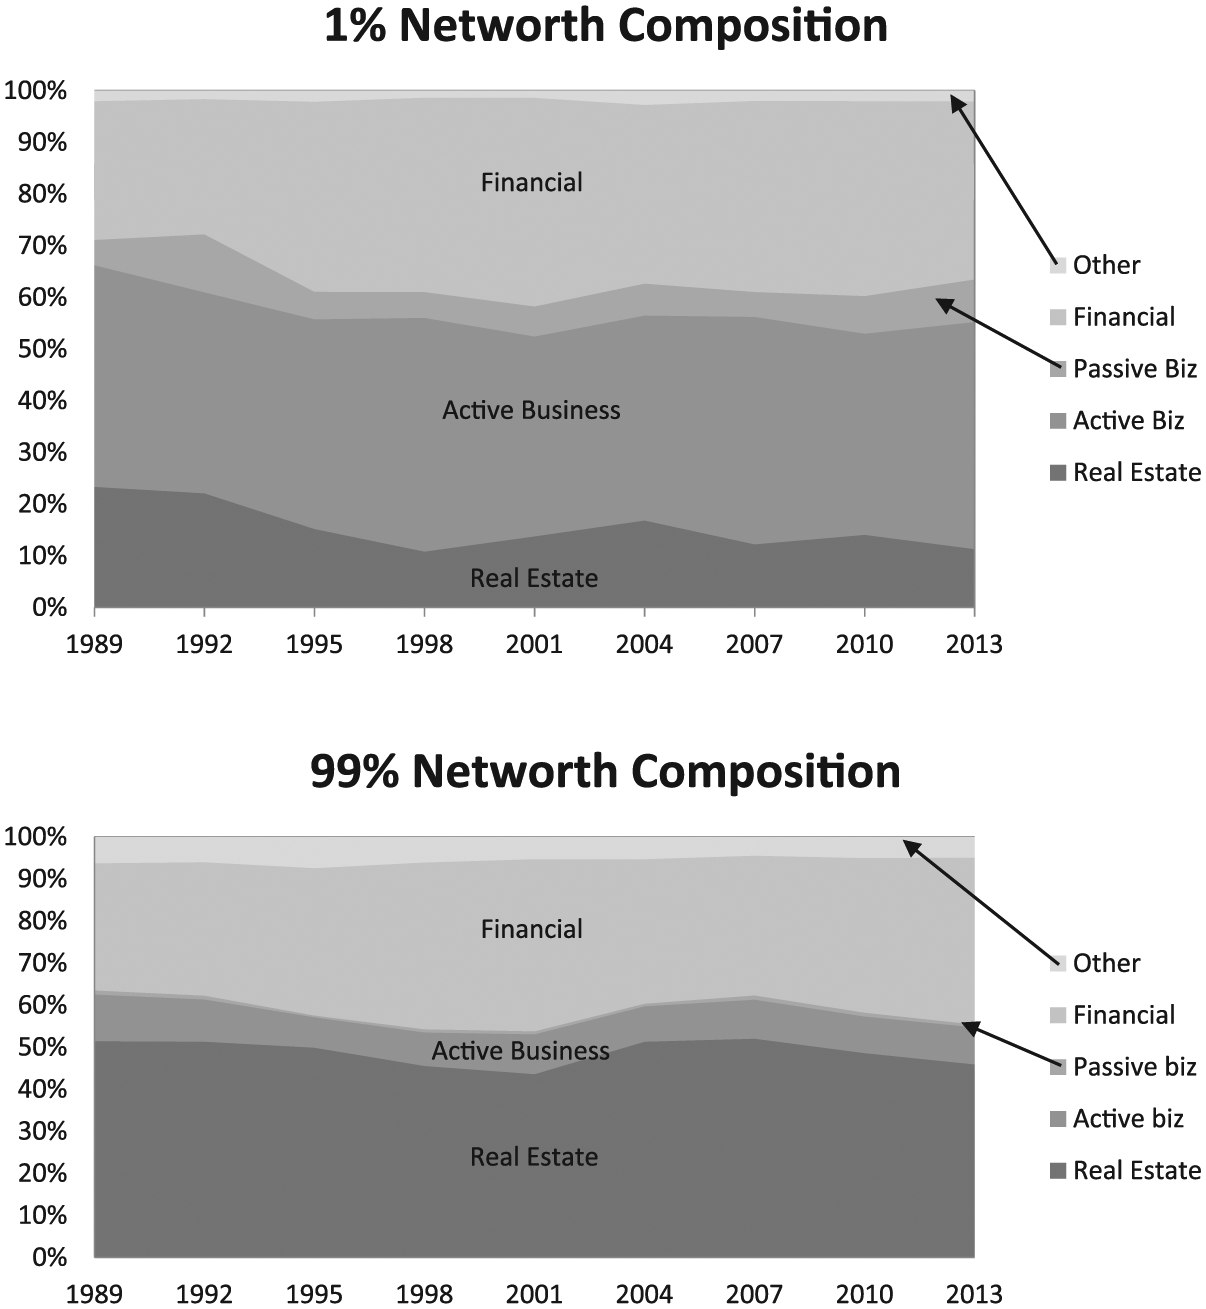
Composition of the net worth of the 1% and 99% from 1989-2013.
Further, real estate is a small fraction of the 1%s wealth, but is by far the largest source for the 99% at about 50%. Taken together, these data point to the existence of business families as a core category of the top 1% and support our view that the wealthiest households are a prosperous class owning and managing SMEs.
The Persistence of Wealth Inequality
Business families constitute a significant part of the 1% and, we suggest, also contribute to the persistence of wealth inequality. Studies of intergenerational wealth mobility find much continuity among the wealthiest classes. We draw on these studies to identify the key mechanisms behind the role of business families in wealth inequality. These include heterogeneous preferences for savings and wealth accumulation, the transmission of social and human capital, and the role of inheritance in the form of bequests and gifts. We briefly consider each of these factors.
Heterogeneous Preferences
Differences in household preferences for wealth accumulation explain diverging patterns of household wealth consumption, saving, and risk bearing. First, households differ in their preference (and abilities) for utilizing wealth in their own lifetime versus passing it on to future generations. The leading explanation for wealth accumulation and consumption is a lifetime income hypothesis (Modigliani, 1986) in which household members seek to accumulate wealth during their productive working lives which they consume in their retirement. The data in Table 1 provide much support for this hypothesis among the 9% and 90%. In both the 9% and 90% household wealth categories, after the primary residence (which is largely debt financed), retirement accounts represent the most important asset in household wealth portfolios (39.2% and 19% respectively). This suggests that the vast majority of households cannot transfer much wealth to future generations. An alternative preference is a “dynastic” explanation in which altruism toward descendants encourages wealth accumulation beyond life consumption needs to fund inheritances to children (Gale & Scholz, 1994). We consider inheritance in more detail below. Second, households may differ in their saving preferences and abilities. Based upon data from a U.S. panel study of income dynamics, Quadrini (1999) finds that, compared with working families, business families are distinguished by much higher savings rates. Business families typically own their business for long time periods over which they accumulate wealth. Consequently, business family members typically stay in or rise to a higher level in the wealth hierarchy compared with working families who typically remain in or descend to lower positions. Quadrini (1999) concludes that the low turnover among business families in the upper echelons of the wealth hierarchy is related to higher savings, accumulated wealth, and lower borrowing constraints that limit participation in entrepreneurship to a narrow range of already wealthy families. Third, households may differ in attitudes toward risk taking that influences asset ownership and allocation (De Nardi, 2015; Wolff, 2012).
Transmission of Social and Human Capital
The idea that successful entrepreneurs can transmit skills and idiosyncratic knowledge to their family members is prevalent in the business family literature (Handler, 1994). Yet, popular understanding of wealth mobility is perhaps best reflected in the maxim “shirtsleeves to shirtsleeves in three generations” describing the rise and fall of large business fortunes. Becker and Tomes (1994) find some support for the maxim by examining intergenerational elasticity (IGE) of income, estimating the correlation between incomes of fathers and sons to be only 0.2. This low correlation indicates that children’s incomes rapidly regress to the mean, suggesting that “practically all the advantages or disadvantages of ancestors tend to disappear in only three generations” (Becker & Tomes, 1986, p. S28). The authors reason that income generating capacity (e.g., talent, know-how, skill, effort) is not easily transmissible from parents to children. However, the authors find intergenerational wealth to be much less elastic, up to 0.7. This is in line with Mazumder’s (2005) IGE estimate of 0.6, which indicates that the benefits of having wealthier parents persist over five to six generations. These effects limit economic mobility and begin to capture other factors beyond human and social capital that are passed on to future generations.
Inheritances
Unlike income generating capacity (e.g., human capital) that is not easily transferred across generations, financial wealth is heritable and has a strong direct effect on the wealth of the beneficiary. Apart from the principal residence, the vast majority of households have relatively few assets to transmit to the following generation. Consequently, inheritances are concentrated in the upper registers of the wealth hierarchy. We find that the top 10% are more than twice as likely to receive an inheritance compared with the lower 90%. Recent studies examining intergenerational wealth mobility (as opposed to income) have found strong support for the persistence of wealth inequality. De Nardi (2015) finds that family background is a powerful source of wealth inequality, in large measure due to bequest motives and inheritance across generations. Inheritance makes up a significant source of net worth within the wealthy class. Based on the 1983-1986 SCF data, Gale and Scholz (1994) find that inheritances represent 31% of aggregate net worth, while gifts are the source of another 20% of aggregate wealth. Both inheritances and gifts occur primarily at the top 10% of the wealth distribution (Gale & Scholz, 1994). Using data from the National Longitudinal Survey of Youth, Keister (2005) finds that receiving a trust fund and an inheritance has an extremely strong effect on adult wealth. Keister (2005, p. 22) concludes that recipients of “trust funds accumulate more assets as adults and are more upwardly mobile” and that inheritance accounts for at least 50% of the net worth of all U.S. families.
Evidence From Forbes “Rich Lists”
Clearly, the typical 1%ers that we find in our sample are not the well-known “billionaires” who populate the Forbes rich lists. Not only are rich list individuals excluded from the SCF sample (Kennickell, 2008), the threshold to make the very bottom of the Forbes 400 list was 1.3 billion in 2013 (“The Complete List of the Forbes 400 Members,” 2013), which is equal to the absolute maximum in the 2013 SCF sample. An influential study of inherited wealth found that societies where billionaire’s heirs’ wealth is large relative to GDP will be characterized by political rent seeking and sluggish rates of innovation and economic growth. However in societies where self-made entrepreneur billionaire wealth is large relative to GDP, the economy will demonstrate greater vitality and fewer signs of corruption (Morck, Strangeland, & Yeung, 2000). The annual production of rich lists by magazines such as Forbes and Fortune typically reflects an ideology that self-made wealth is merited and economically beneficial. In this vein, Kaplan and Rauh (2013) provide a skill and technology-based account of the 2011 U.S. Forbes rich list. They find that this list is mainly comprised of “those who were able to access education while young and apply their skills to the most scalable industries: technology, finance, and mass retail” (Kaplan & Rauh, 2013, p. 36). They use this as evidence that inherited wealth as a source of billionaire wealth may be becoming less important in an increasingly economically mobile U.S. society. Nevertheless, Kaplan and Rauh’s (2013) own study demonstrates the importance of growing up in a wealthy household for wealth accumulation. The authors concede that only 20% of the Forbes 400 wealthiest U.S. individuals in 2011 grew up in a family with little to no wealth, whereas 80% grew up in a family with either some wealth or wealthy. While there is growing mobility among the membership of rich lists, “the added mobility comes from those who would be considered upper-middle-class” (Kaplan & Rauh, 2013, p. 46). Thus, the ability to reach the upper wealth echelons is still largely determined by family background and observed wealth mobility is largely restricted to the wealthiest classes.
Discussion
We have argued that the public narrative around inequality is anchored in deeply entrenched ideological positions. Liberal market advocates articulate the need for a robust system of incentives and property rights enabling intergenerational capital transfers that are viewed as vital for the effective functioning of capitalist societies (Beckert, 2004). Advocates of social justice and equality of opportunity argue for constraints on the accumulation of capital through steeper progressive income and wealth taxation (Piketty, 2014). Both sides of the debate seek to achieve rhetorical power for their position by emphasizing anecdotes of wealthy individuals at the extremes points in the wealth hierarchy. Some praise the merits of self-made billionaire entrepreneurs in the Forbes 400 (Kaplan & Rauh, 2013) while others emphasize the unmerited inheritance of a large percentage of the same Forbes rich list (Moriarty, 2012).
We suggest that these rival narratives obscure a more mundane reality. The majority of the U.S. 1% own relatively modest fortunes and are neither rentier capitalists nor overpaid executives. Rather, our analysis of the 1% reveals an entrepreneurial class that owns and directs substantial wealth in the form of unincorporated business assets. These business families fuse ownership and management into a consolidated form of corporate governance that puts assets to productive use by providing jobs and stimulating economic growth. At the same time, we suggest that this class devises economic strategies that perpetuate privilege, business ownership, and wealth across generations. This conclusion uncovers important, but more complex factors underlying growing economic inequality than the loudest ideological voices in the public narrative. As such, this view opens up important avenues of research exploring family firm’s role in the larger ecology of business, society, and inequality.
Corporate Governance and Family Business Implications
1%er business families constitute a different organizational form than traditional corporate governance research acknowledges. Business families fuse investor and manager roles in a way that contrasts with the Berle and Means’ (1932) separation of ownership and control hypothesis and as a result are often overlooked by dominant corporate governance logics of managerialism and shareholder value. Our analysis resonates with a largely forgotten stream of capitalist class literature (Gilding, 2005; Zeitlin, 1974) in finding that families represent an elite social class that has retained control of business interests during the rise of professional investor and managerial classes. Thus, family business interests have prevailed despite forces toward meritocratic managerial development and hyper-rational capital markets. However, whereas the capitalist class literature focuses almost exclusively upon the owners of large publicly listed companies (Palmer & Barber, 2001; Zeitlin, 1974), our findings suggest that members of the U.S. “capitalist class” are more likely to originate as entrepreneurs in owner-managed SMEs. Accordingly, our article responds to recent questions raised by inequality scholars concerning where “elites come from today and the role of organisational sites and practices in their creation and perpetuation” (Riaz, 2015, p. 1092).
The 1% business families we document in this article are also not well represented in extant family business literature. Theories of family influence on firms cover a wide spectrum from negative to positive (Jiang & Peng, 2011) producing mixed meta-analytic findings about their relative efficiency (Carney, Van Essen, Gedajlovic, & Huegens, 2015; Van Essen, Carney, Gedajlovic, & Huegens, 2015). However, in the wake of Chandler’s (1977) managerialist thesis, a stream of literature has portrayed family firms as a conflict riven and inefficient entity prone to high mortality rates (Gedajlovic, Carney, Chrisman, & Kellermanns, 2012; Ward, 1987). More recently, socio-emotional wealth has suggested that firm-specific attachments engender dysfunctional family firm decision making such as inefficient risk bearing (Gomez-Mejia et al., 2007), reluctance to engage in international expansion (Gomez-Mejia, Makri, & Kintana, 2010), and underinvestment in research and new technology (Chrisman & Patel, 2012). In this perspective, family firms are unlikely to exit their business (DeTienne & Chirico, 2013) and take large risks only when the firm is in threat of failure (Gomez-Mejia et al., 2010).
Our study points to an alternative mode of strategic decision making but on the family, rather than the firm, level of analysis. While a substantial amount of the 1% derive wealth from business interests, their wealth is spread across several businesses (4.6 in our sample), asset classes, and financial instruments. Our results resonate with studies finding business families owning a portfolio of firms over their history (Sieger, Zellweger, Nason, & Clinton, 2011; Zellweger, Nason, & Nordqvist, 2012) and gradually liquidating ownership positions in the founding firm (Franks, Mayer, Volpin, & Wagner, 2012). These findings point to a more economically rational calculation where asset allocation decisions are optimized on the household level rather than a firm level. No longer isolated in a single business entity, accumulated family wealth can be reallocated over time beyond a focal firm to achieve dynastic wealth goals and to provide for family beneficiaries. Accordingly, our article adds greater specificity to recent findings about the relationship between inequality, financial and human capital, and individual entry into entrepreneurship (Xavier-Oliveira, Laplume, & Pathak, 2015). For their members, wealthy business families reduce the credit constraint on entrepreneurial entry, encourage new business formation beyond the founding firm, and likely provide the cultural and social capital necessary for the practice of effective business ownership.
Family Business, Society, and Inequality
As a prominent segment of the 1%, the continuing role of business families in attenuating or exacerbating economic inequality remains fertile territory for future research. According to the Rawlsian theory of justice as fairness, intergenerational inequalities perpetuated by wealthy business families should benefit everyone. In Rawls’ (1971) view, the expected inequalities described above can be justifiable only if the difference in expectation is to the advantage of the representative man who is worse off, . . . [e.g., an unskilled worker]. The inequality in expectation is permissible only if lowering it would make the working class even worse off. (p. 78)
To the extent that family firms meet the Rawlsian criterion, they may be considered justifiable as a vital part of a prosperous, property-owning democracy that holds out the promise of a better life for everyone.
Indeed, family firm research often provides arguments that are consistent with the Rawlsian criterion for justifiable inequality. For example, family firms’ social and economic contributions are often quantified in terms of their job creation, tax returns, and GDP contributions (Astrachan & Shanker, 2003). There is support for a stewardship hypothesis suggesting that family firms hold a long-term perspective on their firm’s activities and nurture a lasting community of employees (Miller et al., 2008). Further, a study of French family firms advances the view that families’ long-term commitment to the firm enables owners to enter into implicit contracts with employees in which owners gain greater cooperation in exchange for assurances of employment continuity (Sraer & Thesmar, 2007). Empirical support for the position is found in a study of European family firms’ responses to the 2008 financial crisis where Van Essen, Strike, Carney, and Sapp (2015) found that, compared with non-family firms, family-controlled firms are less likely to lay-off employees or reduce pay in the wake of the crisis. Small to medium-size family firms have also been found to be less likely to outsource activities (Memili, Chrisman, & Chua, 2011). Stewardship toward communities also manifests in family firms’ superior environmental performance (Berrone, Cruz, Gomez-Mejia, & Kintana, 2010) and showing greater social responsibility toward external stakeholders (Cruz, Larraza-Kintana, Garcés-Galdeano, & Berrone, 2014). Collectively, this line of research implies that family firm governance is “stakeholder friendly” and less likely to be associated with aggressive market-oriented management practices that engender economic inequality (Cobb, 2016).
Nevertheless, given the current state of research, we cannot unequivocally claim that family firms meet the Rawlsian criterion for justifiable inequality. This is because there is a strong contrary narrative in family firm research suggesting that family firms have a “dark-side.” Since family firms fuse ownership and control in the same hands, there are few organizational checks and balances on owner-managers’ decision making (Carney, 2005). Insofar as business families demonstrate altruism to family members and favored employees, they may also choose to act inequitably toward employees whom they consider outsiders, thereby violating norms of both procedural and distributive justice (Lubatkin, Ling, & Schulze, 2007). Moreover, a substantial body of research identifies conflict between controlling families and minority investors (La Porta, Lopez-de-Silanes, Shleifer, & Vishny, 2002), a problem that is heightened in jurisdictions where family firms are prevalent and there is limited protection for minority investors (Jiang & Peng, 2011). In such settings, working-class investors who hold their savings in pension and mutual funds are liable to face expropriation by opportunistic family owners. Thus, the mixed findings with respect to family managed firms and their governance practices suggest that business families could either mitigate or aggravate inequalities.
Future research exploring the conflicting influence of business families on economic inequality may find reconciliation by differentiating between income and wealth inequality. On the one hand, business family stewardship of stakeholders may be linked to lower levels of income inequality. Milton Friedman suggests that CSR is a form of income redistribution (Friedman, 1970) and business families’ commitment to CSR and local communities may encourage this leveling force (Berrone et al., 2010; Dyer & Whetten, 2006). Further, without specifically referencing family firms, Cobb’s (2016) claims that governance mechanisms reflecting long-term orientation and non-financial motives should reduce market orientation have direct implications for family firms. Family firms are often seen as long-term oriented (Anderson & Reeb, 2004; Le Breton-Miller & Miller, 2006) and less financially oriented (Gomez-Mejia et al., 2011) and thus should reduce income inequality. On the other hand, stewardship behavior toward family members may exacerbate wealth inequality. The same features of long-term orientation and non-financial motives may lead families to divert financial commitments from the firm and toward family members (Lubatkin et al., 2007) to perpetuate dynastic intentions (Gilding, 2005). In this way, business family stewardship of wealth for the family creates a concentrated accumulation of capital that is transferred across generations and limits the upward wealth mobility on a societal level.
In addition, institutional context is likely to play an influential role in the relationship between family firm governance and inequality. In particular, the varieties of capitalism perspective may provide fruitful direction for inequality researchers. This stream of literature points to national variation among a set of interrelated sectors, including finance, education and training, and social welfare provision that define distinct forms of capitalism. Each unique form of capitalism produces outcomes that vary in the degree to which they satisfy stakeholders interests (Hall & Soskice, 2001). Research in this perspective finds that the relationship between wealth creation and equality can take a variety of institutional forms (Judge et al., 2014). Broadly this literature points to institutional weaknesses that generate hierarchical and oligarchical varieties of family capitalism and riches associated with high and persistent levels of economic inequality (Fogel, 2006; Schneider, 2009). Alternatively, Scandinavian and Germanic varieties of capitalism engender substantial family business sectors, but are associated with greater social and economic equality. For instance Germany’s Mittlestand, celebrated in the literature as an important contributor to Germany’s industrial prowess (Herrigel, 2000), has been described as a worthy entrepreneurial middle class that is “neither urban working poor nor wealthy landed estate owners living off rents but a person of solid and legitimate wealth” (Berghoff, 2006, p. 264). Whether or not the owner-manager SMEs that populate the upper echelons of America’s wealth hierarchy constitute a comparable Mittlestand class remains an open and not unfanciful question.
Footnotes
Acknowledgements
We would like to thank the guest editors for their guidance in the review process. We greatly appreciate research assistance provided by Jérémie Peloso and Linda Rice. We are also grateful to the Business Families Foundation for insights and feedback on a previous version of the article.
Declaration of Conflicting Interests
The authors declared no potential conflicts of interest with respect to the research, authorship, and/or publication of this article.
Funding
The authors disclosed receipt of the following financial support for the research, authorship, and/or publication of this article: This research was generously supported in part by the Social Sciences and Humanities Research Council of Canada (SSHRC).