
Abstract
This study seeks to examine the mechanisms by which a corporation’s use of philanthropy affects its reputation for corporate social performance (CSP), which the authors conceive of as consisting of two dimensions: CSP awareness and CSP perception. Using signal detection theory (SDT), the authors model signal amplitude (the amount contributed), dispersion (number of areas supported), and consistency (presence of a corporate foundation) on CSP awareness and perception. Overall, this study finds that characteristics of firms’ portfolio of philanthropic activities are a greater predictor of CSP awareness than of CSP perception. Awareness increases with signal amplitude, dispersion, and consistency. CSP perception is driven by awareness and corporate reputation. The authors’ contention that corporate philanthropy is a complex variable is upheld, as we find that CSP signal characteristics influence CSP awareness and perception independently and asymmetrically. The authors conclude by proposing avenues for future research.
Keywords
Corporate giving is becoming big business and a major strategic issue for firms as they increasingly position themselves as socially responsible organizations. In 2014, Walmart and its foundation distributed over US$1.4 billion in in-kind donations and grants around the world. Whether corporations can benefit from philanthropic activities has consequently received increasing attention from managers and researchers (Saiia, Carroll, & Buchholtz, 2003). A 2008 Conference Board survey found that the principal management issue for most respondents was measurement of the outcomes of their firm’s philanthropic activities (Cavicchio & Torok, 2008). The sensitivity to corporate giving’s outcomes is also reported in Maas and Liket (2011) who found that between 62% and 76% of firms listed in the Dow Jones Sustainability Index (DJSI) measured the effectiveness of their philanthropic activities. To aid both firm managers and scholars in their quest to identify how corporations can benefit from philanthropic activities, we propose that it is essential to understand corporate philanthropy’s influence on the firm’s reputation for social performance.
Understanding corporate philanthropy’s effect on the firm’s reputation for corporate social performance (CSP) is important for many reasons. Studies have long contended that a reputation for CSP is a significant determinant of many positive organizational outcomes, such as overall reputation (Brammer & Millington, 2005; Fombrun & Shanley, 1990), organizational attractiveness to potential employees (Greening & Turban, 2000; Lin, Tsai, Joe, & Chiu, 2012; Turban & Greening, 1997), favorable corporate evaluations and product impressions from consumers (Brown & Dacin, 1997; Lii & Lee, 2012), and partial buffering from scandal revelations (Janney & Gove, 2011). Moreover, in the extensive literature investigating the effect of CSP on financial performance (Griffin & Mahon, 1997; Margolis & Walsh, 2003; Orlitzky, Schmidt, & Rynes, 2003; Roman, Hayibor, & Agle, 1999), a firm’s reputation for CSP is often seen as a mediating variable between CSP and financial performance. 1 Of course philanthropy is one of many aspects of CSP (Waddock & Graves, 1997), but philanthropy is particularly important as it is characterized by a great degree of discretion (Hadani & Coombes, 2015). Understanding the effect of corporate philanthropy, which can be seen as a voluntary, nonobligatory, and nonreciprocal transfer of wealth from the corporation to its external stakeholders (Godfrey, 2005; Hadani & Coombes, 2015; Seifert, Morris, & Bartkus, 2004), on the firm’s reputation for CSP is also critical as increasing resource scarcity is making firms increasingly strategic in their philanthropic donations (Liket & Maas, 2016; Saiia et al., 2003).
In this study, we use signal detection theory (SDT; Green & Swets, 1966; Peterson, Birdsall, & Fox, 1954) to examine the relationship between corporate philanthropic contributions and the firm’s reputation for CSP. Drawing on prior literature (Gardberg & Schepers, 2008; Rindova, Williamson, Petkova, & Sever, 2005), we conceive reputation for CSP as consisting of two dimensions: CSP awareness and CSP perception. CSP awareness refers to the “collective awareness and recognition” (Rindova et al., 2005) of stakeholders regarding the firm’s CSP, whereas CSP perception refers to the stakeholder evaluations of the firm’s CSP, their positive or negative evaluation of the firm’s CSP. According to SDT theory, firms send various signals about themselves via their corporate philanthropy. Firms’ stakeholders, who receive these signals under uncertain conditions, are not always able to discriminate the signal from the noise, and thus cannot decide whether the corporation is socially responsible or not. It is therefore important to distinguish between stakeholder recognition of the firm’s CSP (CSP awareness) and stakeholders’ appraisal of the firm’s CSP (CSP perception), because they reflect two distinct but still interconnected signaling processes: signal receipt and evaluation. We expect that firms influence stakeholders’ CSP awareness and perception via signals constructed by corporate philanthropy. Moreover, higher CSP awareness is expected to affect CSP perception. In this way, CSP awareness will partially mediate the relationship between corporate philanthropy and CSP perception.
Drawing on multiple data sources, including a database of 33,562 individual evaluations of 60 companies collected by the Reputation Institute (RI) and Harris Interactive (HI) as part of their Reputation Quotient (RQ) Annual 2001 study, we analyze the effect that different aspects of corporate philanthropy have on the firm’s reputation for CSP. Overall, we find that characteristics of firms’ portfolio of philanthropic activities are important predictors of CSP awareness but not CSP perception. CSP awareness increases with signal amplitude (dollars contributed), signal dispersion (number of areas supported), and signal consistency (presence of a corporate foundation). CSP awareness mediates the relationship of the signal characteristics with CSP perception. In addition, respondents used corporate reputation as a substitute for CSP characteristics when awareness was low. Foreign firms suffer from lower awareness and lower perception of their activities even after controlling for age in the United States, size, and profitability. In addition, our control variables demonstrate that both CSP awareness and CSP perception vary across sex, race, and age.
We organize the rest of this article as follows. We briefly discuss our understanding of the reputation for CSP and identify its two constituent dimensions: awareness and perception. We then introduce SDT as a platform to link corporate philanthropy with reputation for CSP. Following that introduction of SDT, we describe our data and methodology, and provide the results of our analysis. We discuss our findings and conclude with implications for academics and managers as well as recommendations for further research.
Reputation for CSP
Following extensive work in the reputation literature (Fombrun, Gardberg, & Barnett, 2000; Fombrun & Riel, 1997; Gardberg & Fombrun, 2002; Rindova et al., 2005), we conceive a firm’s reputation for CSP as the estimation in which the firm’s various stakeholders hold its CSP. A firm’s reputation for CSP results from the accumulation of various positive and negative CSP signals, which enhance and diminish reputation, respectively (Cornelissen, Haslam, & Balmer, 2007; Janney & Gove, 2011; Rao, 1994). It can shape overall corporate reputation, as stakeholders use the firm’s CSP activities as signals that allow them to evaluate the firm and its activities under conditions of incomplete information (Fombrun & Shanley, 1990). Moreover, reputation for CSP has been found to enhance several positive organizational outcomes such as attractiveness to labor markets and favorable product impressions by consumers, inter alia (Brammer & Millington, 2005; Brown & Dacin, 1997; Greening & Turban, 2000; Janney & Gove, 2011; Lii & Lee, 2012; Lin et al., 2012; Turban & Greening, 1997).
Overall, corporate reputation has been mainly viewed from an economics and an institutional perspective. These perspectives jointly propose that reputation is a bidimensional concept consisting of stakeholders’ awareness and perception. For our purposes, we draw on prior literature on CSP reputation (Gardberg & Schepers, 2008; Rindova et al., 2005) to propose that reputation for CSP consists of two dimensions: CSP awareness and CSP perception. As per the study of reputation from an institutional perspective (Rindova et al., 2005), CSP awareness refers to stakeholders’ “collective awareness and recognition” regarding the firm’s CSP. CSP perception refers to the stakeholder evaluations of the firm’s CSP as good or bad. As per the study of firm reputation from an economics perspective (Rindova et al., 2005), CSP perception can be seen as reducing the uncertainty caused by information asymmetries that stakeholders face in dealing with firms (Fombrun & Shanley, 1990; Lopatta, Buchholz, & Kaspereit, 2016). For example, Siegel and Vitaliano (2007) found that firms which sell credence or experience goods whose quality cannot be verified prepurchase, use their CSP to signal that they are reliable with trustworthy products.
Conceiving reputation for CSP as a bidimensional concept allows us to refine the understanding of signaling processes occurring at different levels. For example, stakeholders might be very aware of a firm’s CSP but perceive that the firm is performing very poorly. This combination is quite a common phenomenon when a firm becomes instantly known due to its involvement in a crisis, but is also blamed for it due to its CSP lapses. The BP Gulf of Mexico explosion is a good example.
This approach complements prior research by adding a multilevel process. In building our theory, we use awareness as the level of specific knowledge of a firm’s philanthropic activities, and evaluation to indicate the degree to which perception of a firm is positive or negative. In this approach, we draw on signaling theory that enables us to identify corporate philanthropy’s underlying attributes that hold signaling capacity to affect firms’ CSP awareness and perception. The next section offers pairs of hypotheses.
SDT and Corporate Philanthropy
SDT (Connelly, Certo, Ireland, & Reutzel, 2011; Green & Swets, 1966; Peterson et al., 1954; Swets, Tanner, & Birdsall, 1961; Weigelt & Camerer, 1988) is an information economics theory that discusses the process by which corporations and other parties try to relay positive information about themselves under conditions of information asymmetry and uncertainty. According to these theories, corporate behaviors, such as philanthropy in our research setting, signal information about a company’s products, current CSP and policies as well as future intent to various current and potential stakeholders. Due to uncertainty, the perceiver (in our case, the relevant stakeholder) is attempting to discriminate signal from noise, and determine when the signal is present and credible: in this case, to determine whether the corporation is a socially responsible corporation or not. This approach implies that the more pronounced the signal is, the greater the difference between the mean value of the signal and the mean value of the noise; the greater its breadth, its spread over different activities; and the greater the signal’s clarity, its consistency over time, the greater the likelihood that a signal receiver (stakeholder) will interpret it correctly (Swets, 1961; Weigelt & Camerer, 1988). A stakeholder will correctly perceive a firm to be socially responsible when it actually is, or will correctly perceive a firm not to be socially responsible when it is indeed not responsible. In other words, the stakeholder will avoid both kinds of errors: perceiving the firm to be what it is not or perceiving it not to be what it is.
Though initially focused on the perception of sensory data, SDT applications have broadened to include other forms of perceptual data (Martin, 1975). Ye and Van Raaij (2004) examined the construction of brand equity in the mind of consumers using SDT. Robertson, Eliashberg, and Rymon (1995) investigated firm interactions with respect to new product signals, looking at hostility and signal credibility of the sending firm, and also the receiver characteristics of the competitor firms. It has been widely used in management, marketing, and finance contexts, including research studies on CSP (Lin et al., 2012; Riordan, Gatewood, & Bill, 1997; Robinson, Kleffner, & Bertels, 2011; Turban & Greening, 1997), labor markets (Spence, 1973), organizational reputation (Behrend, Baker, & Thompson, 2009), new product introduction (Akerlof, 1970), and price (Milgrom & Roberts, 1986). Basdeo, Smith, Grimm, Rindova, and Derfus (2006) used SDT to investigate the relationship between market actions and the construction of firm reputation. Heil and Robertson (1991) used SDT to examine competitive market actions between firms. Germane to this research, they modeled corporate philanthropy as one mechanism to assert competitive advantage. Prabhu and Stewart (2001) explored how managers interpret competitors’ signals over time and across market contexts. They found that the focus and strength of the incumbent’s signals influenced entrants’ perception of aggressiveness. They also explored the efficacy of bluffs. Cohen and Dean (2005) explored how top management team composition and legitimacy signals information during an initial public offering. Zhang and Wiersema (2009) examined how CEO background signaled credibility during CEOs’ certification of corporate financial statements. Lin et al. (2012) found that firms’ corporate citizenship attracted job seekers. In summary, SDT explains how organizations and stakeholders manage the asymmetric information and the uncertainty that underlies much of strategic decision making.
We propose that SDT provides a strong theoretical background for understanding corporate philanthropy, offering insights into firm-consumer signaling and interfirm (or competitive) signaling. Corporate philanthropy, which Carroll (2004) places at the top of his corporate social responsibility (CSR) pyramid to illustrate its discretionary nature, is one means by which firms stake out competitive advantage over other firms (Basdeo et al., 2006; Heil & Robertson, 1991; Weigelt & Camerer, 1988), signal that the firm stands out from its competition (Werner, 2011), and influence the institutional impression of the firm (Godfrey, 2005). In particular, SDT enables us to gauge the signaling power of corporate philanthropy and its likely impact on firms’ reputation for CSP.
We distinguish three signal elements that allow a firm to better position itself among its stakeholders, via its philanthropy. One element is the amplitude of the signal, for example, the amount of money given by the firm to charity. Signal amplitude is analogous to the volume of a sound; a stronger amplitude signal is more likely to be distinguished from the background noise. The second element is signal dispersion. Signal dispersion’s effect varies in the same way as a floodlight sheds light over a large area but with low intensity per area, versus the dispersion effects of a spotlight or the focused beam of a laser. The greater the dispersion of the signal, in this case the spread of the firm’s philanthropic activities in many areas, the greater the chance that a cause dear to a particular stakeholder will be included; but for a given level of donations this spread also means that the less noticeable will be the effect to a particular cause. The third signal element is signal consistency. Consistency in this particular case means that the signal is consistent and unambiguous about what it means in spite of the background noise around it. In our particular case, we take the presence of a corporate foundation as an indicator that the firm intends to consistently contribute to its philanthropic causes. We assert that each of these three signal elements plays an important role in how stakeholders understand what a firm signals through its philanthropy and therefore all three should impact the firm’s reputation for CSP.
As noted earlier, SDT is grounded on the premise that signals direct the attention of firm stakeholders under information asymmetry and uncertainty conditions. However, in order for a signal to relieve uncertainty, it needs to be not only strong (amplitude) but also clear and unambiguous. While a firm’s overall size of donations, or the signal amplitude, may indicate commitment to CSP, stakeholders may interpret the signal inaccurately for several reasons, including transmission noise or appropriateness (Gardberg & Fombrun, 2006). In terms of individual awareness, corporations that send volatile signals (of varying frequency and/or amplitude) will have a greater chance to be discounted or disregarded by individuals, as the signal is likely to be interpreted as noise. However, corporations that send consistent signals will have a clearer signal, and individuals will have a greater likelihood of attentiveness to such signals.
We develop our theory first by considering an example of effective corporate philanthropy. One of the most ubiquitous charities from one of the most ubiquitous firms, McDonald’s Ronald McDonald House, is a charity serving families whose children are hospitalized with cancer (narrow signal dispersion). McDonald’s targets the family market with its “Happy Meals” and playgrounds at many of its restaurants, serving at lower prices relative to competitors. In this case, price does not necessarily convey high quality (Milgrom & Roberts, 1986). Yet, McDonald’s has established a niche philanthropy, which strongly identifies it with its target market. And by establishing a philanthropic market leader position, McDonald’s has effectively warded off all challenges to this space. 2
Whereas consumers might see this philanthropy as a friendly gesture, the philanthropy is very potent in terms of its competitors. McDonald’s has proactively established its footprint via dominant levels of contribution and marketing in this space (signal amplitude), and no new entrants are able to gain footing. Though such signaling does not threaten the immediate future of other competitors in terms of their overall product (Heil & Robertson, 1991), it does serve as a barrier to entry for them to move into this philanthropic branding space. Further, McDonald’s has been very consistent in branding this presence, and has contributed successively over the years to continue its presence (signal consistency). Such consistency renders the signal McDonald’s sends to customers and competitors as highly credible. Robertson et al. (1995) identified these two signal characteristics (hostility and credibility) as important in new product announcements, and we consider them equally important here in terms of defending the philanthropic space. Had McDonald’s not been assertive or consistent in terms of establishing its philanthropic space, others might have considered entering this market. As it is, no challenges have been made due to these attributes, and McDonald’s has a very strong branding presence with its charity.
The cosmetics industry and its cause-related marketing efforts with breast cancer philanthropies are analogous, though more than one cosmetics firm has used such cause-related marketing efforts. In these instances, no single firm has adopted an overly aggressive stance that would preclude others from entering the marketing space, in an instance of what Nalebuff and Brandenburger (1997) might consider as co-opetition. In this case, all firms are made better off by no single firm claiming the space as its own, though this type of behavior does also open the door to industry free riders.
Signal Amplitude
Signal amplitude refers to the magnitude or strength of a signal, which is analogous to the volume of a sound. With stronger amplitude, a signal is more likely to be distinguished from the background noise. By extension, the greater a firm’s philanthropic contribution, the greater its influence on the firm’s reputation for CSP.
Greater philanthropic contributions increase the signal strength to receivers and thereby increase CSP awareness. Philanthropic signals can only be effective if the public receives and is aware of them. A primary tenet of the attention literature is that actions of organizational stakeholders depend on their attention focus (Ocasio, 1997). The concept of relative attention contends that there is competition for attention (Bouquet & Birkinshaw, 2008), in our case, between firms. Accordingly, firms whose message is stronger are more likely to receive attention. Following this logic, we propose that the amount of company philanthropic donations will increase what individuals know about a firm’s activities. Thus, we propose,
As we note earlier, the majority of scholars have proposed a positive relationship between the amount of philanthropic contributions and corporate financial performance or other positive stakeholder outcomes. For example, Lev, Petrovits, and Radhakrishnan (2010, p. 182) found that “charitable contributions are significantly associated with future revenue, whereas the association between revenue and future contributions is marginally significant.” Based on their findings, they argue that consumer perception plays an important role in charitable contributions’ influence on future sales. These findings contribute to the extant literature, which has identified firm’s reputation for CSP as a mediating variable between its various forms of CSP and financial performance (Griffin & Mahon, 1997; Margolis & Walsh, 2003; Orlitzky et al., 2003; Roman et al., 1999; Ullmann, 1985). Therefore, it is reasonable to expect that signal amplitude will enhance CSP perception. Thus, we propose,
Signal Dispersion
A firm’s dispersion, or breadth, of philanthropic activity is our second attribute of interest. Firms can manipulate dispersion by varying the number of causes to which they contribute. In other words, the content breadth of a firm’s philanthropic behavior, signal dispersion, can be defined as number of charitable arenas to which the firm contributes, such as education, medical, or housing. The [Taft] Directory of Corporate Giving separates causes into 10 categories. A firm could choose to focus its contributions on a single category such as education, or use a multitargeted approach to address the needs of a more diverse group of stakeholders. As firms rarely contribute to a single cause, most have a portfolio of citizenship or philanthropic activities (Gardberg & Fombrun, 2006). Thus, the content of this portfolio, rather than or in addition to the amount contributed, may shape awareness and perception by altering signal detection. Our premise is that, for any given year, firms or their foundations have a fixed amount of monies to distribute. Firms that opt for the multitargeted approach may vary both the number of charitable categories and the number of grants, giving more dollars to fewer categories or charities, or fewer dollars to more categories or charities. In other words, given fixed amounts of monies, firms face a trade-off between their signal amplitude per category and their signal dispersion.
Yet, some firms’ philanthropy budget may not be a fixed amount of money. These firms would have the opportunity to select categories, and then allocate budgets accordingly. In this instance, the firms avoid a trade-off and the relationship between signal amplitude and signal dispersion would be positive.
Firms using the multitargeted approach will be concerned with affecting an optimal number of relevant stakeholder groups. Firms may even be more strategic. For example, both Boeing and Intel give to science education specifically. The number of causes to which a firm donates will influence awareness of firm CSP through the diversity of stakeholder groups affected. Different stakeholders will not be aware of or pay attention to all the philanthropic activities of the firm. Stakeholders will tend to pay more attention to categories that are important/closer to them and less attention to categories that are less important/further away from them. A firm that donates only to education, for example, will primarily affect and be recognized by families with children, whereas another firm that donates to both education and hospitals would be recognized by families with children and also families with members needing hospitalization, such as elderly relatives. Hence, the second firm would potentially create a greater awareness of its CSP in the community than the first. Basdeo et al. (2006) found that the greater the number of corporate strategic actions, the more effective the signaling. Thus we propose,
On the other hand, given that firms have a fixed amount of monies from which they make their donations, increasing the number of categories (signal dispersion) of donations will reduce the amount of contributions for a given charitable category. Therefore, we expect that the greater the dispersion of a firm’s charitable donations, the less the signal amplitude per category that a firm will be transmitting. Further, we expect that the relationship between signal dispersion on CSP perception will be positive but decreasing, for the following reasons. As we mentioned earlier, given that firms face a trade-off between their signal amplitude per philanthropic category and their signal dispersion, we expect that the more stakeholders a firm reaches, the less impact it will have on them. Recall that stakeholders will most likely not be aware of the overall CSP of the firm, but only the CSP activities of the philanthropic categories that matter for them the most. Thus we propose,
Signal Consistency
The third consideration is signal consistency. In order for a signal to relieve uncertainty, it must be consistent and unambiguous. While a firm’s overall size of donations, or the signal amplitude, may indicate commitment to CSP, the firm’s stakeholders may interpret a signal inaccurately for several reasons including transmission noise or appropriateness (Gardberg & Fombrun, 2006). In terms of individual awareness, corporations that send volatile signals (such as inconsistent signals) have a greater chance to be discounted or disregarded by individuals, as the signal may likely be interpreted as noise. However, corporations that send consistent signals will have a clearer signal, and individuals will have a greater likelihood of attentiveness to such signals.
For society to be aware of a firm as a socially responsible corporation, the firm must consider strategic reputation building. Signal perception is hindered when the signal varies over time, making it difficult for receivers to discriminate between signal and noise. In the case of philanthropy, a game-theoretic approach to such reputation building indicates that the firm would need to establish a reputation as a “giving” firm by signaling the willingness to give (Weigelt & Camerer, 1988). A firm that gives a great deal one year and, ceteris paribus, gives little or nothing the next, will not establish reputational consistency. Consistent contributions provide clarity and enhance readability by reducing transmission noise. Thus, one motive for corporations to create foundations is to buffer social performance initiatives from annual financial performance and to provide consistent funding for their philanthropic initiatives.
Firms also vary in their commitment to corporate philanthropy. Companies establish and endow charitable foundations to buffer contributions from annual financial performance, to allow autonomy to pursue activities that may not correspond with those of the firm and/or to shelter the firm itself from business cycle fluctuations (Brown, Helland, & Smith, 2006; Petrovits, 2006). For instance, some firms, such as American Airlines, funnel contributions through their corporate foundations. Others, such as Home Depot, prefer to make direct contributions. A third group performs both. Brown et al. (2006) found no difference between firms with foundations and those without in terms of total giving, giving per employee, giving per dollar assets, or giving per dollar sales. However, those with foundations have larger boards, lower debt ratios, lower institutional holdings, and lower block holdings than those without.
In summary, the function of the signal in SDT is to reduce uncertainty on the part of the receiver (Swets et al., 1961; Weigelt & Camerer, 1988). For those who are attentive to corporate philanthropic endeavors, we theorize that uncertainty would be heightened to the extent that corporations are volatile in their contributions. Such volatility could be noted through donation intermittence or amount of corporate contribution. On the other hand, corporations that are consistent in their contribution level over time will send clear signals to their constituents regarding their philanthropic position. Thus, we propose,
Partial Mediation
Finally, we hypothesize that CSP awareness of social performance will directly affect CSP perception, thereby partially mediating the relationship between the signal amplitude, dispersion, and consistency of company philanthropic donations and CSP perception. In order for stakeholders to evaluate social responsibility signals, they must detect these signals. Moreover, as Janney and Gove (2011) argue, unknown firms, which have not emitted sufficient signals for stakeholders to observe and therefore evaluate them, are assumed to be of low quality. However, the relationship between CSP awareness and CSP perception may not be perfectly correlated because awareness of social responsibility can lead to both positive and negative CSP perception, depending on the appropriateness of the activities. Greater awareness of inappropriate activities will hurt perception. Specifically,
Methodology and Data
We used a database of 33,562 individual evaluations of 60 firms collected by the RI and HI as part of their RQ Annual 2001 study. Prior scholars have used the publicly available RQ scores for corporate reputation (Kiousis, Popescu, & Mitrook, 2007). Although the U.S. online population is approaching parity with the general population, some groups are underrepresented online (such as people above the age of 65). Thus, the data were propensity weighted to be representative of the U.S. adult population. The Wall Street Journal reported additional results on January 16, 2002 (Alsop, 2002). Individual-level data, such as CSP awareness and CSP perception as well as self-reported demographic data, were drawn from this database.
We collected firm-level variables from various secondary sources such as the (formerly Taft) Directory of Corporate Giving (Fombrun & Shanley, 1990; Hadani & Coombes, 2015; Lev et al., 2010; Saiia et al., 2003; Seifert et al., 2004), Internal Revenue Service (IRS) Form 990s for foundation tax filings (Hadani & Coombes, 2015), the Foundation Directory, and Compustat. We collected secondary data for 2000, the year prior to the RQ study, to better ascertain causality.
Measures
Dependent variables: CSP awareness and CSP perception
For CSP perception, we used the Social Responsibility dimension of the RQ as our dependent variable (Fombrun, Gardberg, & Sever, 2000). The three items were as follows: This company supports good causes; this company is an environmentally friendly company; and this company behaves responsibly toward the people in the communities in which operates. Each item is rated with a 7-point Likert-scale. The three items loaded on one factor with a Cronbach’s alpha of .91 and factor loadings of 0.90, 0.93, and 0.93, respectively, explaining 84% of variance. 3 We calculated the latent variable CSP perception by weighting the three variables by their respective factor loadings.
CSP awareness (H7) was operationalized as the response to the following item: “How much do you feel you know about [firm name] when it comes to its . . . Social Responsibility?” using a 3-point scale, with 1 = a lot, 2 = some, and 3 = little/nothing. We reverse coded the responses to facilitate interpretation.
Independent variables
Signal amplitude (H1/H2) was operationalized as the log of the total amount of money a firm donated to philanthropic activities (Brammer & Millington, 2005; Waddock & Graves, 1997). If information was missing from the Directory of Corporate Giving, we searched for corporate foundation 990 tax forms. If information was missing from these sources, we treated the amount as $0, to be consistent with SDT.
Signal dispersion (H3/H4) was operationalized as the number of causes a firm supported based on the number of categories from the Directory of Corporate Giving to which a firm donated. This directory lists 10 categories: Arts and Humanities, Civic and Public Affairs, Education, Environment, Health, International, Religion, Science, Social Services, and Other. We used only eight of the categories because the coding of International and Other appeared to be inconsistent. We took the square of signal dispersion to test H4.
Signal Consistency (H5/H6) was operationalized as a dichotomous variable, 1 if the firm had a corporate foundation; otherwise 0 (Fombrun & Shanley, 1990).
Control variables
We include both firm-level and individual-level control variables. Consistent with prior research on social performance, we control for firm size with the log of net sales, profitability with return on assets (ROA), and industry with two-digit Standard Industrial Classification (SIC) codes using 2000 data from Compustat (Hadani & Coombes, 2015; Seifert et al., 2004). We also control for foreignness because scholars have suggested that foreign firms would be at a disadvantage compared with local firms in choosing appropriate social performance activities (Gardberg & Fombrun, 2006). We obtained the location of corporate headquarters from Compustat to construct foreign, where 1 equals foreign; and otherwise 0 (Zaheer, 1995). Due to its mutual status, we were unable to find comparable financial data for State Farm Insurance and eliminated it from our sample. Company age in the United States was drawn from corporate websites and the Gale Group’s Business and Company Resource Guide. We also control for a firm’s overall corporate reputation as it appears to condition perception of corporate giving (Bae & Cameron, 2006; Lii & Lee, 2012) using an item from the survey. As signal interpretation can vary across contexts and individuals (Prabhu & Stewart, 2001), we control for respondent sex, race, and age at the individual level using self-reported data. Missing demographic data reduced our sample to 27,166 individual evaluations of 59 firms.
Analysis
We tested hypotheses predicting CSP awareness (H1, H3, and H5) using an ordered logit model because the item is a limited dependent variable. We used a negative log-log setting for the logit model because the distribution of responses revealed a greater likelihood of low awareness of social responsibility. We tested hypotheses predicting CSP perception (H2, H4, H6, and H7) using ordinary least squares (OLS). All models were estimated using SPSS version 23.
Results
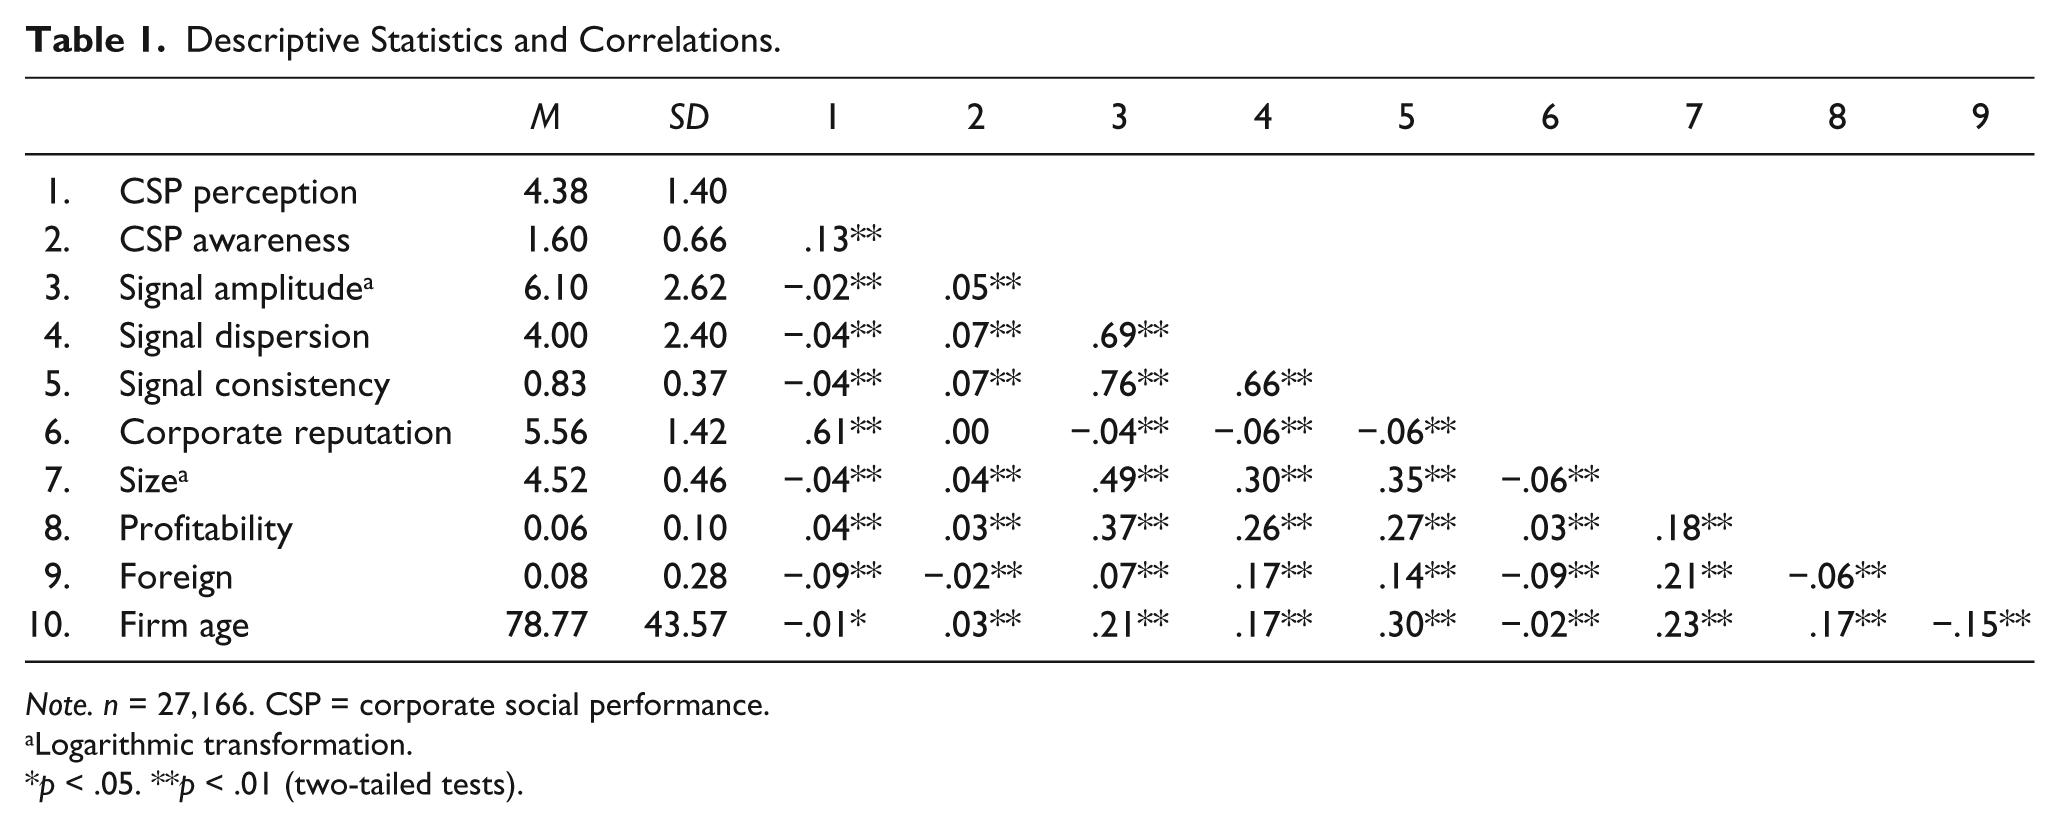
Table 1 contains descriptive statistics and correlations for our study variables. The largest and smallest firms in our sample are Exxon-Mobil and Yahoo!, respectively. The most profitable and least profitable are Intel and Amazon.com, respectively. Of the sample firms, 83% had foundations.
Descriptive Statistics and Correlations.
Note. n = 27,166. CSP = corporate social performance.
Logarithmic transformation.
p < .05. **p < .01 (two-tailed tests).
The mean level of CSP awareness was low, but the standard deviation indicates that a good number of respondents did have high awareness of corporate philanthropy. More than half the sample responded that they knew “a little” about the firm’s social responsibility. The eight foreign firms in our sample are headquartered in Germany, Japan, the Netherlands, and the United Kingdom. All have assets, employees, and distribution in the United States.
CSP perception is highly correlated with corporate reputation; however, CSP awareness is not correlated with corporate reputation. Signal amplitude is highly correlated with both signal dispersion and signal consistency. Firms with foundations tend to contribute more money overall to more causes. Surprisingly, signal amplitude is negative and weakly correlated with corporate reputation. In addition, large, older, and more profitable firms tend to contribute more money. Due to our large sample size, many variables appear statistically significantly correlated even though with very low coefficients.
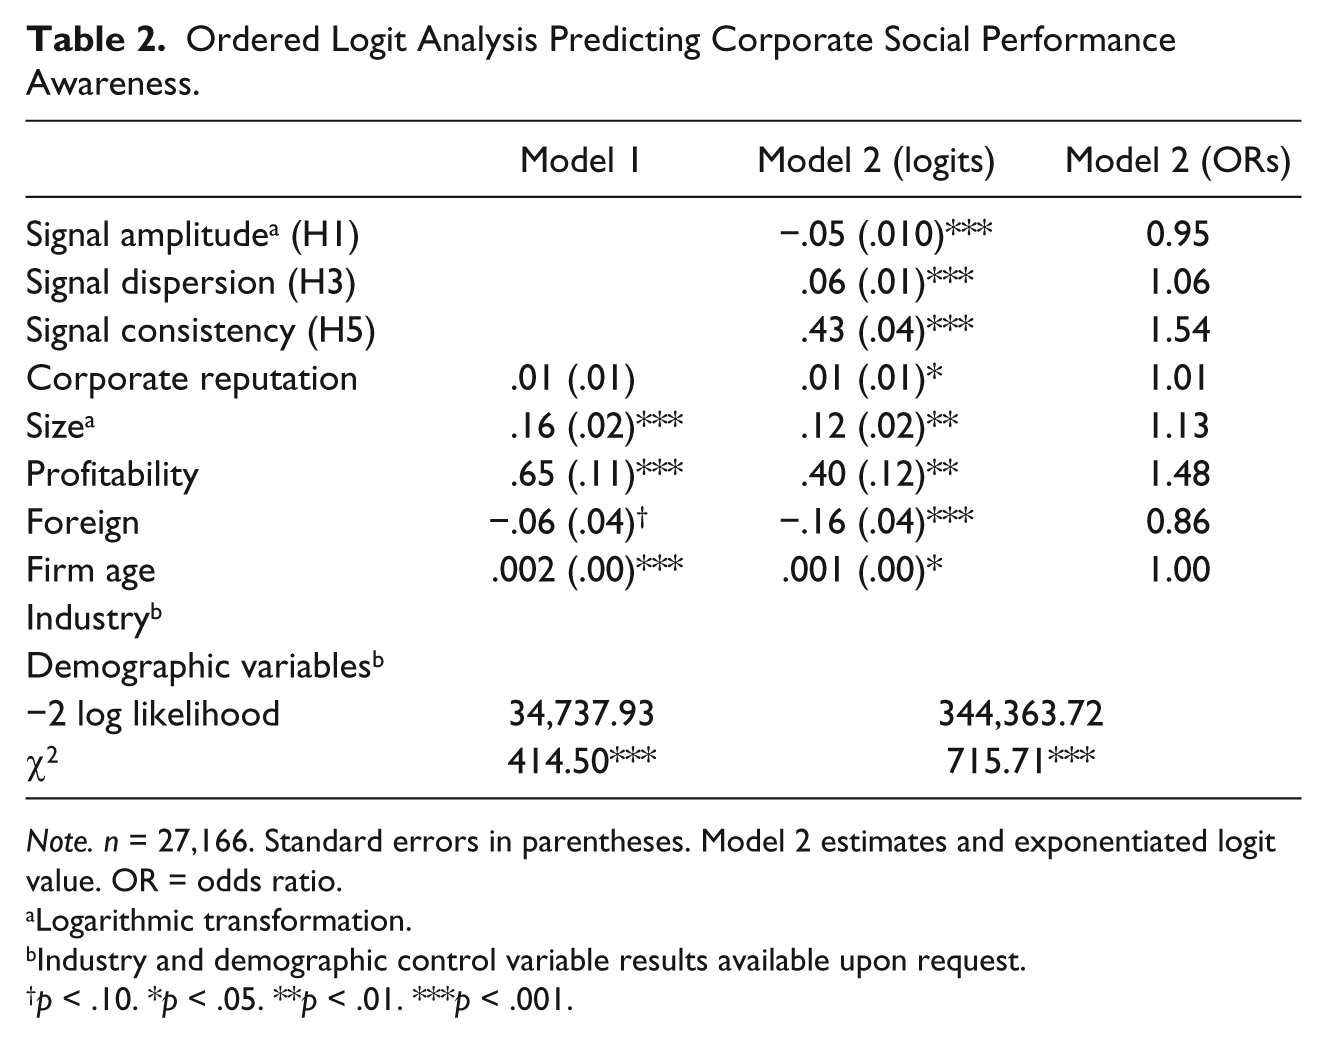
Although some correlations in Table 1 are quite high, most of our estimated variance inflation factors (VIFs) were well within tolerances. The highest VIF score was 4.86 for one of the industry dummy variables, which was within the threshold of 10 (Hair, Anderson, Tatham, William, & Black, 1998) suggesting that our model estimates do not suffer from multicollinearity. Table 2 contains the results of our ordered logit analysis. Model 1 contains our control variables for predicting CSP awareness. Model 2 adds the direct effects, testing H1, H3, and H5 that improve the explanatory power of the model observed in an increase in the chi-statistic2. We also converted the estimates (logits) of Model 2 to odds ratios to facilitate interpretation. The odds ratio measures effect size based upon the ratio of the odds of one event versus another occurring. An odds ratio of 1 denotes that the probabilities of two events happening are each 50%. An odds ratio greater than 1 denotes the degree to which social responsibility awareness is more probable than lower awareness. An odds ratio less than 1 denotes the degree to which low awareness is more likely than high awareness.
Ordered Logit Analysis Predicting Corporate Social Performance Awareness.
Note. n = 27,166. Standard errors in parentheses. Model 2 estimates and exponentiated logit value. OR = odds ratio.
Logarithmic transformation.
Industry and demographic control variable results available upon request.
p < .10. *p < .05. **p < .01. ***p < .001.
Model 1 tests our control variables. Size and profitability were positively and significantly (p < .001) related to CSP awareness. However, foreignness is negatively and marginally significantly (p < .10) related to CSP awareness. Age has a neutral effect on CSP awareness. Model 2 tests H1, H3, and H5. Counter to our expectations, greater investments in philanthropy were negatively associated with CSP awareness, thus rejecting H1. Broad content dispersion was positively associated with CSP awareness (p < .001), as predicted (H3). Signal consistency was positively associated with CSP awareness (p < .001) supporting H5. The control variables remain statistically significant, while corporate reputation’s positive relationship with CSP awareness gains statistical significance.
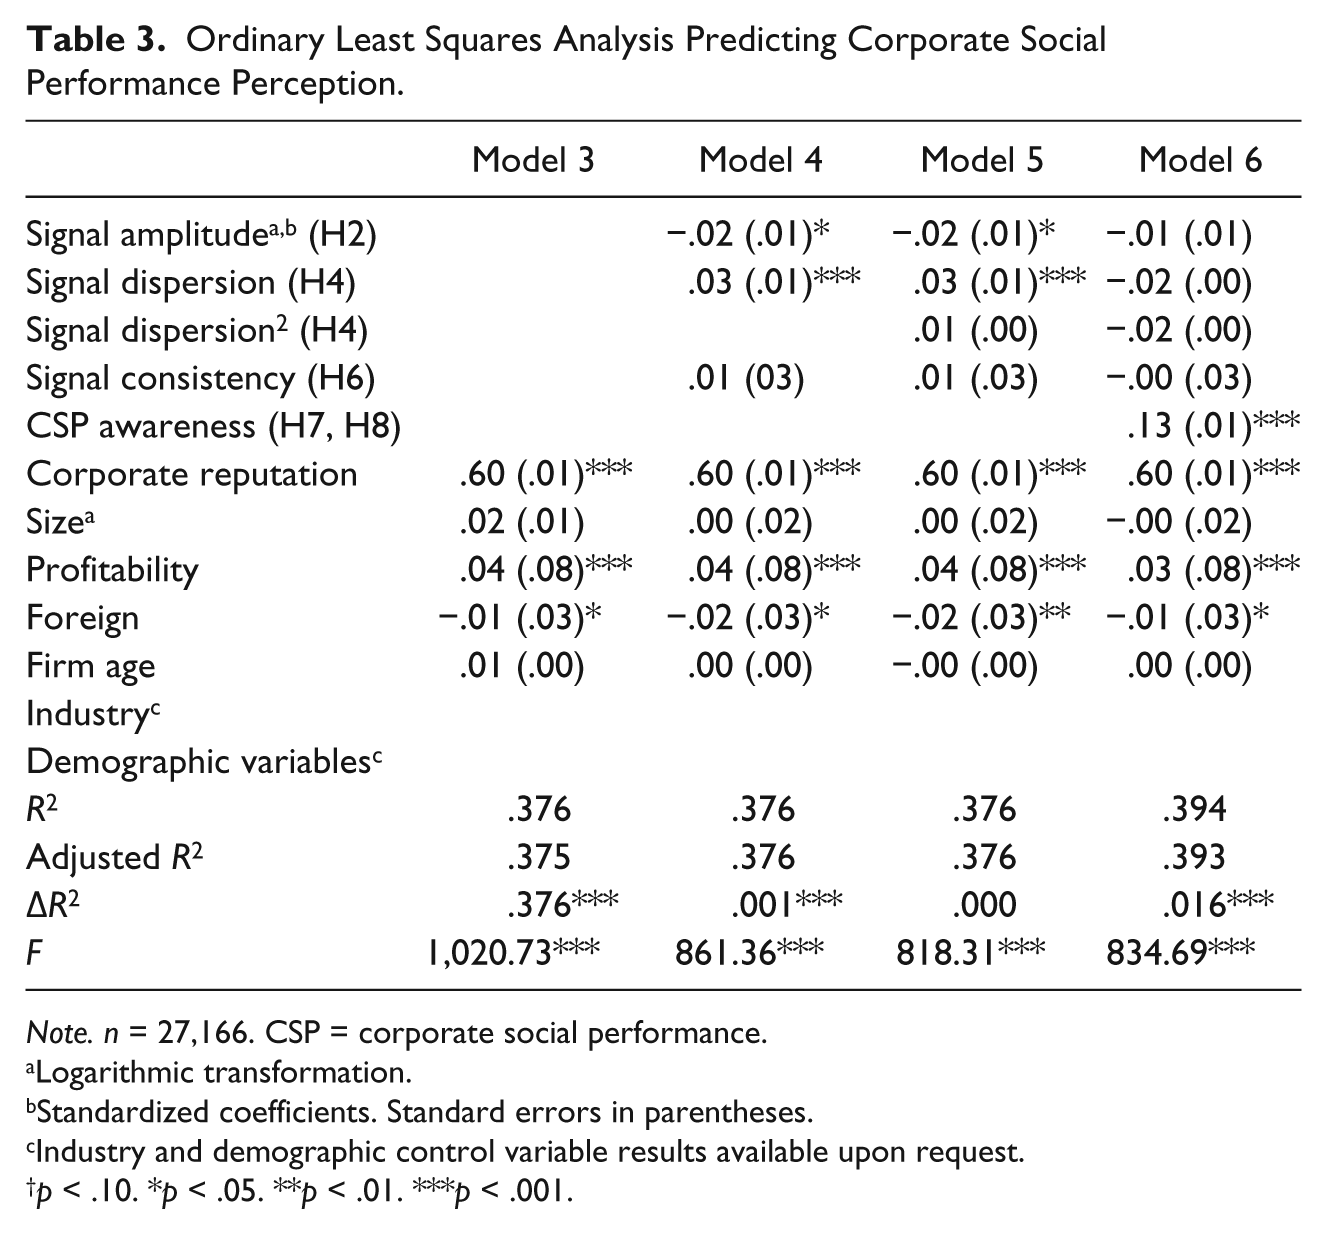
Table 3 presents the OLS analysis predicting CSP perception. Model 3 includes only the control variables. The effects of corporate reputation and profitability are positive and statistically significant (p < .001) and the effect of foreignness is negative and statistically significant (p < .01). In Model 4, we add the three independent variables to test H2, H4, and H6. The effects of the control variables are robust across models. H2 proposes that greater signal amplitude leads to greater CSP perception. Counter to expectations, the coefficient of signal amplitude is negative. H4 proposes that greater signal dispersion increases CSP perception at a decreasing rate. Contrary to H4, we find that signal dispersion is positively associated with CSP perception (p < .01) and the squared term is not statistically significant in Model 5. H6 proposes that greater signal consistency enhances CSP perception. Counter to our expectations, signal consistency is not related to perception of CSP.
Ordinary Least Squares Analysis Predicting Corporate Social Performance Perception.
Note. n = 27,166. CSP = corporate social performance.
Logarithmic transformation.
Standardized coefficients. Standard errors in parentheses.
Industry and demographic control variable results available upon request.
p < .10. *p < .05. **p < .01. ***p < .001.
In Model 6, we add the hypothesized mediating variable, CSP awareness, to the analysis. Consistent with H7, we find that CSP awareness is positively and statistically associated with CSP perception (p < .001). Moreover, signal amplitude and dispersion lose statistical significance. Conversely, the model estimates for consistency reject H6. Notably, the addition of the main independent variables increases the explanatory power of our models as seen in increases in adjusted R2.
We utilize information from three models (Models 2, 4, and 5) to test for the mediating role of awareness of CSP in the relationships of signal amplitude, dispersion, and consistency with perception of CSP (H8). According to Baron and Kenny (1986), certain conditions apply for the presence of a mediating effect. First, the effects of the signal characteristics in Model 2 and Model 4 must be statistically significant. Second, in Model 6, the effect of awareness of CSP must be statistically significant and the absolute values of the effects of the signal characteristics must be smaller than the ones in Model 4. These conditions apply only in the case of signal amplitude and dispersion lending partial support to H8. In other words, awareness of CSP partially mediates the effect of signal dispersion on perception of CSP.
Sensitivity Analysis
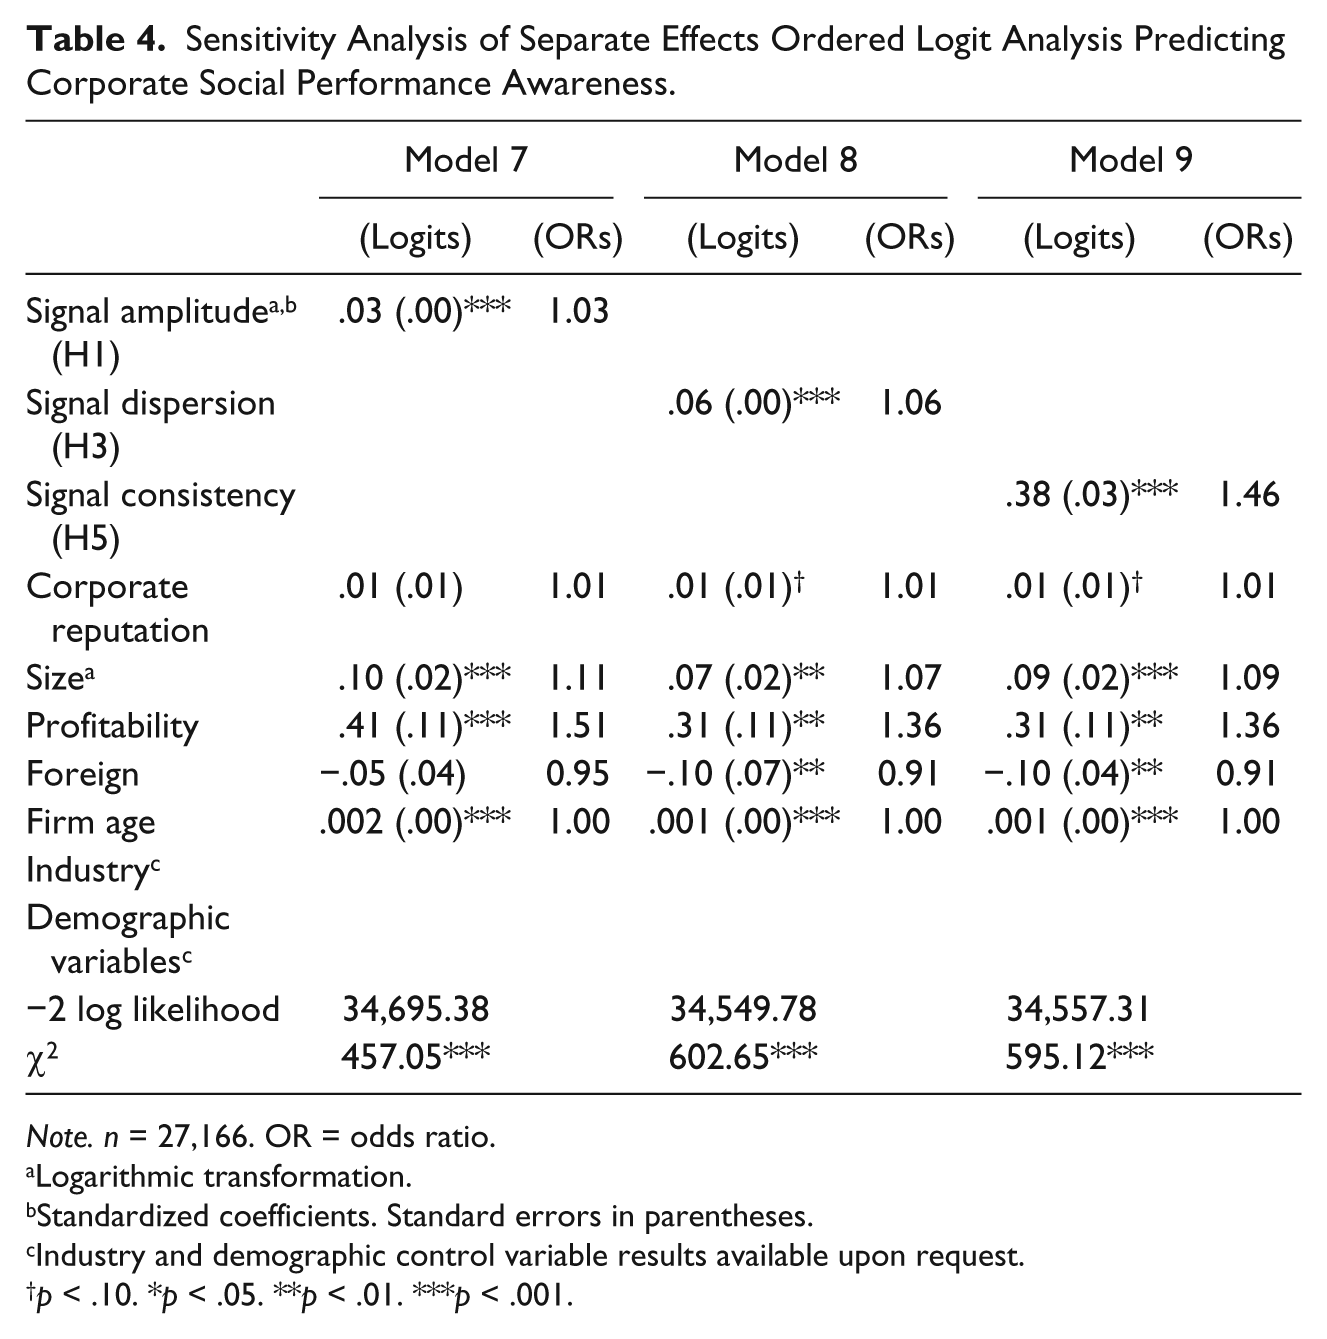
The complex interaction between the signal characteristics may confound their distinct relationships with awareness and perception of CSP. For example, the funds a firm donates to philanthropic activities may determine the spectrum of activities—beyond average monies per activity—and duration and repetition of philanthropic engagement. These concerns led us to examine the sensitivity of our initial results by also testing the individual relationships of the independent variables with CSP awareness and CSP perception. The new results appear in Tables 4 and 5.
Sensitivity Analysis of Separate Effects Ordered Logit Analysis Predicting Corporate Social Performance Awareness.
Note. n = 27,166. OR = odds ratio.
Logarithmic transformation.
Standardized coefficients. Standard errors in parentheses.
Industry and demographic control variable results available upon request.
p < .10. *p < .05. **p < .01. ***p < .001.
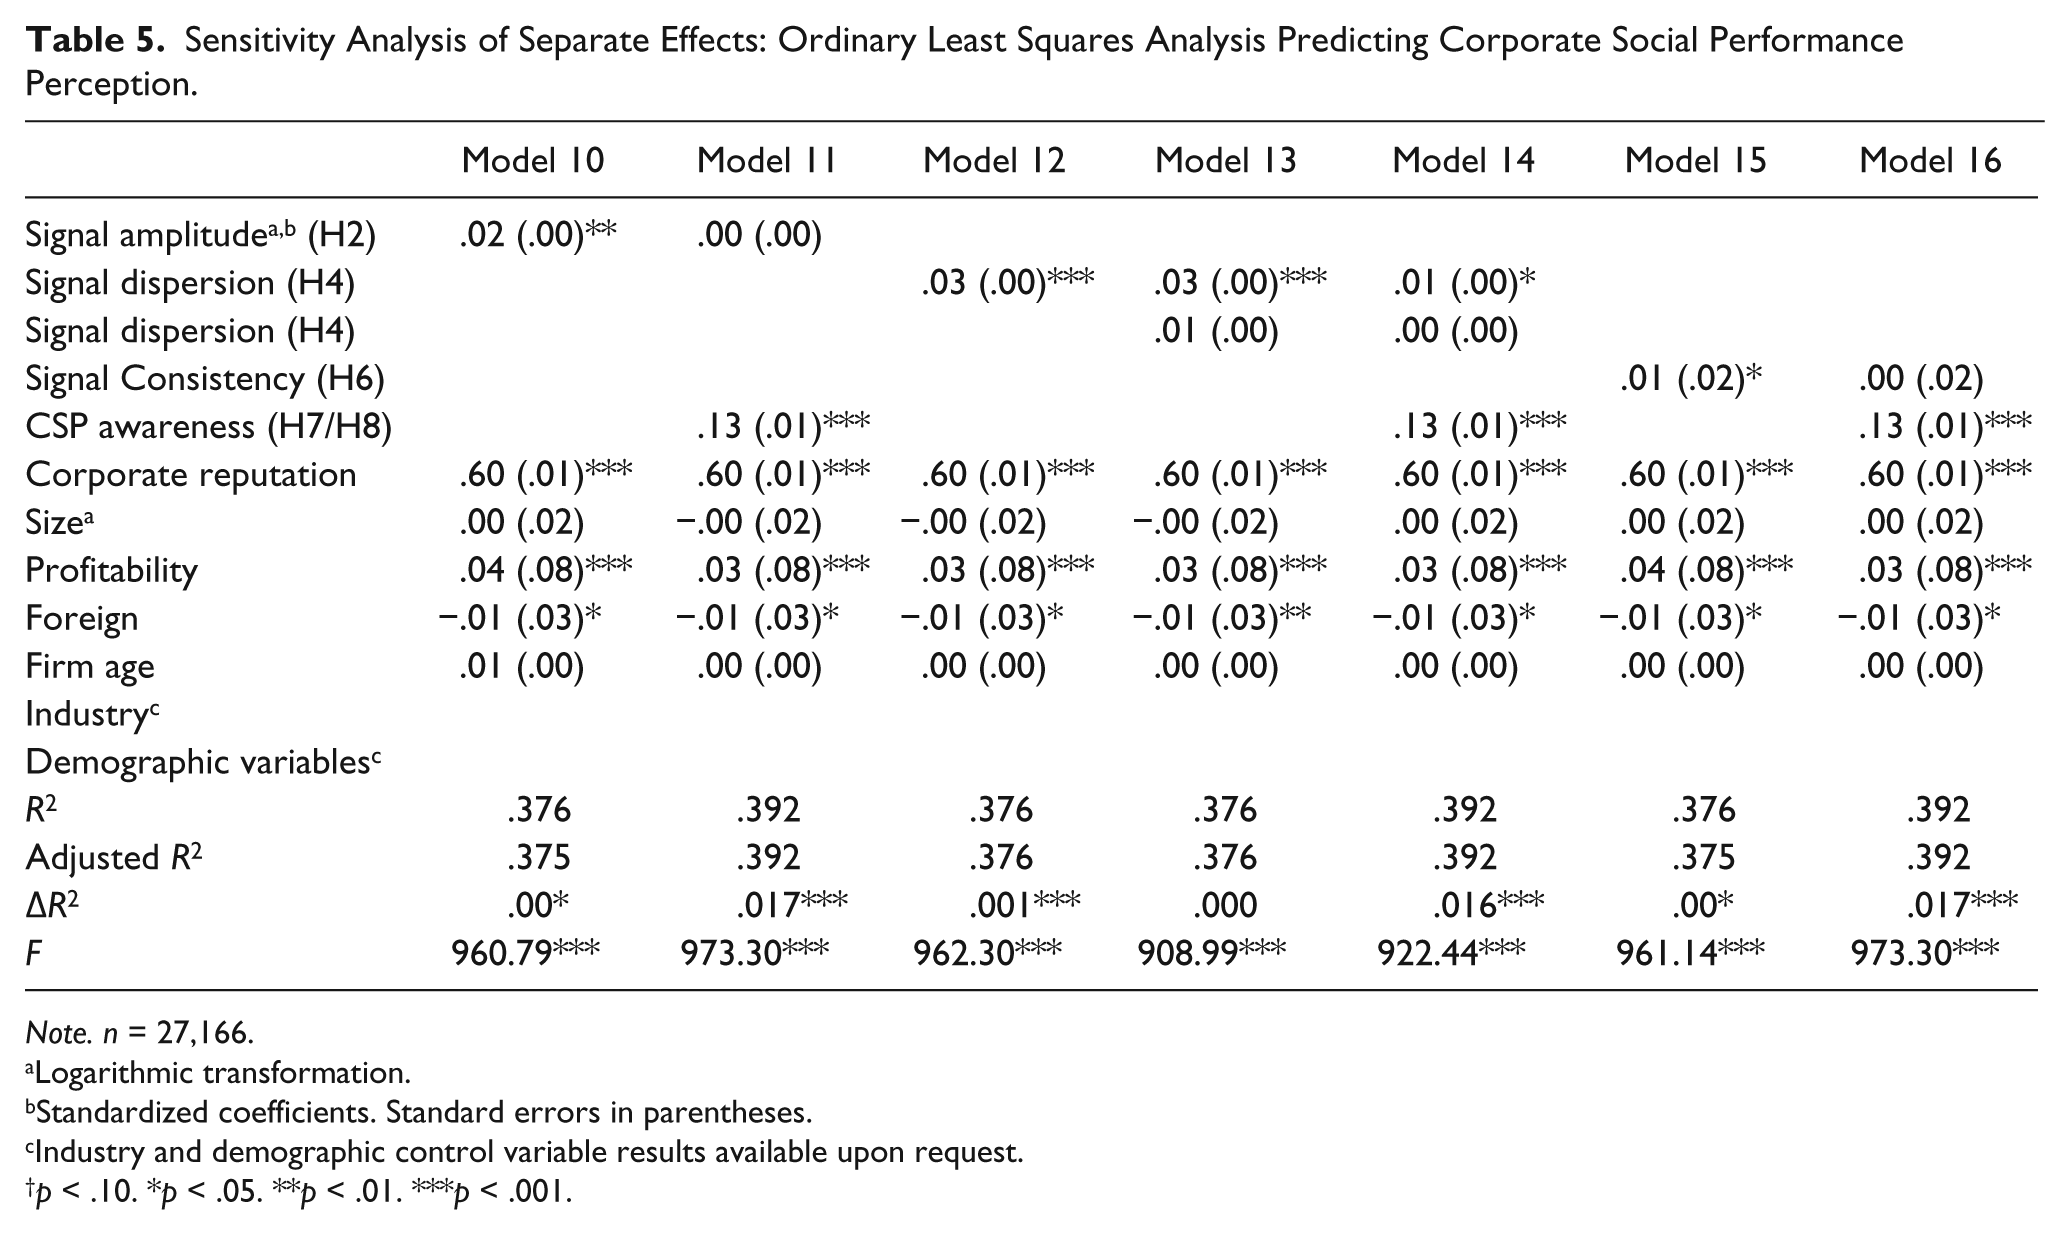
Sensitivity Analysis of Separate Effects: Ordinary Least Squares Analysis Predicting Corporate Social Performance Perception.
Note. n = 27,166.
Logarithmic transformation.
Standardized coefficients. Standard errors in parentheses.
Industry and demographic control variable results available upon request.
p < .10. *p < .05. **p < .01. ***p < .001.
Table 4 pertains to the individual relationships of signal characteristics with CSP awareness. All three signal characteristics are positive and statistically significantly related to CSP awareness. With regard to the individual relationships of signal characteristics with CSP perception (Table 5), the new estimations suggest that all individual signal characteristics and awareness of CSP are conducive to CSP perception (coefficients are positive and statistically significant at conventional levels). These findings are in congruence with H2, H6, and H7, according to which signal amplitude, signal consistency, and awareness of CSP are positively associated with CSP perception, respectively, and in conflict with H4, which proposed that signal dispersion affects CSP perception in a decreasingly positive fashion. In Model 12, signal dispersion remains positively associated with CSP perception when signal dispersion squared is entered into the equation. However, signal dispersion squared is negative but not statistically significant. Moreover, the control variables are qualitatively similar to the initial analysis, supporting our intuition about the possible implications that the underlying interactions between signal characteristics may have on our results.
Similar to the main analysis, we utilize information from multiple models to examine the mediation effects. With regard to the individual partial mediation, we find support for all hypotheses. For signal amplitude, signal dispersion, and signal consistency, the coefficient declines and level of statistical significance declines when CSP awareness is entered into the regression.
Lastly, we ran several analyses to check for the sensitivity of our results to alternative operationalizations of our measures. For example, we calculated CSP perception as the mean of responses on the three items and reran the analysis. Given the similar factor loadings across the three items, it was not surprising that the results were consistent. We substituted foundation contributions for total contributions with similar results. We substituted the number of grants the foundation distributed for the number of funding areas, with similar results. We also ran analyses omitting Wal-Mart, which served as an outlier, distributing over US$82 million through over 70,000 grants in 2001; overall, results were robust. We are confident that CSP awareness and CSP perception are distinct but related components of CSP reputation.
Discussion and Conclusion
Using signaling theory, we tested a model to examine the effect of philanthropic donations on reputation for CSP. In this section, we summarize our results and our contributions to the signaling theory and signal detection literature as well as the CSP literature.
Overall we find support for the supposition that CSP reputation is composed of two distinct but related dimensions—CSP awareness and CSP perception. In addition, we find that signal amplitude (signal strength based on the amount of contributions) does not adequately explain CSP awareness. Rather, signal dispersion (number of philanthropic areas) and signal consistency (presence of a corporate foundation) were critical determinants of CSP awareness.
We also observe that the determinants of CSP awareness and CSP perception differ. In contrast to CSP awareness, signal amplitude, signal dispersion, and signal consistency individually contribute little to explain CSP perception. In fact, CSP awareness and corporate reputation are the strongest predictors of CSP perception.
For firms, the funds allocated to philanthropy can be quite large. Thus, we need to address the economic significance as well as statistical significance of our analysis. It is difficult to define economic consequences when predicting a Likert-type scale. However, we have compelling evidence that despite the fact that firms are spending millions on CSP, the U.S. public is fundamentally ill-informed about these activities. We first discuss CSP awareness using the odds ratios reported in Table 4. A firm that has donated an average annual contribution of US$44.6 million can increase its CSP awareness by 0.23 points on a 3-point scale with a US$1 million increase in amplitude, ceteris paribus. A firm that has contributed to four areas can increase its CSP awareness by 0.24 points by increasing its dispersion by one area. Firms with corporate foundations had 1.48 the CSP awareness of firms without foundations.
CSP perception was measured with a continuous variable, so the results in Table 5 are easier to interpret than those of CSP awareness. We calculate the marginal effect of an increase in a signal characteristic for the firms’ mean level using the unstandardized coefficients. When a firm contributes an additional $1 million, it can increase its CSP perception by 0.05 points on a 7-point scale, ceteris paribus. A firm that increases its dispersion to an extra area increases its CSP perception by 0.02. Firms with corporate foundations had 0.05 points higher CSP perception than firms without foundations. A 1-point increase in awareness increases CSP perception by 0.28 points. A 1-point increase in corporate reputation increases CSP perception by 0.59 points.
When we revisit these data, we observe that over half the sample reported knowing little or nothing about a company’s CSP even when they were familiar with the company. In addition, almost 20% of the sample responded “not sure” to all three variables used to construct CSP perception. Our results suggest that stakeholders rely on overall corporate reputation to evaluate CSP when their awareness is low. This finding is consistent with extant research that shows a conditioning effect of corporate reputation on CSP evaluations. In sum, large investments in corporate philanthropy can only pay off if they are consistent over time, reach a variety of stakeholders, and the firm has a good reputation.
We refine the signaling literatures by identifying three features of signals—amplitude, dispersion, and consistency—that resonate with conceptualizations of sound and light signals. These signal features can be applied to other strategic actions. In addition, we hope that we inspire other scholars to consider signal features from the physical sciences.
Via this theoretical contribution to signaling research, we make three main contributions to the philanthropy literature. First, within the “strategic philanthropy” literature (Gautier & Pache, 2015; Liket & Maas, 2016; Porter & Kramer, 2002; Saiia et al., 2003; Wang & Qian, 2011), our research reveals causal mechanisms that link philanthropy to the firm’s reputation for CSP and, subsequently, financial performance. Consistency and corporate reputation, itself, are clearly elements of stakeholder influence capacity (Barnett, 2007). Second, while extensive scholarship has investigated corporate philanthropy’s effect on different stakeholders (Barone, Norman, & Miyazaki, 2007; Luo, 2005; Wang & Qian, 2011), there is very little research that explores the signaling aspect of philanthropy, a research gap we partially rectified by investigating the effect that three distinct components of philanthropic signals (amplitude, dispersion and consistency) have on the overall CSP reputation of the firm. Third, by distinguishing among these three distinct signal components of philanthropy, we contribute to an existing gap in the literature that does not clearly identify an array of possible philanthropic strategies (Frumkin, 2010; Gautier & Pache, 2015) and conceptualizations of corporate philanthropy and CSP as portfolios of activities (Gardberg & Fombrun, 2006).
Our results suggest that the relationships of corporate philanthropy and CSP awareness with CSP perception are more complex than indicated by most academic studies. Consistent with Gardberg and Fombrun (2006), reputation for CSP is better formulated as a multidimensional phenomenon consisting of amplitude (financial commitment), dispersion (causes), and consistency (formal structures and routines). Regarding CSP awareness, our findings indicate that, in addition to the size of the firm’s donations, its dispersion in many charitable activities and consequently many stakeholder groups, with corresponding interests for those activities, does matter. In short, we find that by increasing the breadth of their charitable donations, firms can reach a greater number of stakeholder groups and therefore achieve greater levels of CSP awareness. Moreover, our finding that the existence of a corporate foundation has a positive impact on CSP awareness indicates that stakeholders become more aware of firms which show consistency in their charitable donations through having a foundation. Firms can give money to their foundations in years when organizational slack allows them to be more generous (Buchholtz, Amason, & Rutherford, 1999) and refrain from giving money to their foundations in more lean years, whereas their foundation maintains a consistent, yearly presence in various charitable activities in all years (Seifert et al., 2004). Generally, this interpretation of our findings regarding signal consistency agrees with the notion of “time compression diseconomies,” introduced by Dierickx and Cool (1989), who argued that firms cannot develop certain intangible resources by spending large sums of money in short periods of time, but by being consistent in their spending over the years.
Concerning our findings regarding CSP perception, there are a few points to be made. First, as expected and in accordance with other empirical results in the literature (Lev et al., 2010) we found that signal amplitude, signal dispersion, and signal consistency are positively associated with CSP perception; however, once we account for CSP awareness, their direct effect on perception declines. Further, the conditioning effect of corporate reputation (Bae & Cameron, 2006; Lii & Lee, 2012) stems from an overall lack of awareness about firms’ CSP.
We believe that our research more closely resembles the ways in which managers and their agents, such as public relations (PR) firms, design and implement CSP rather than the ways in which academics perform research. From conversations with practitioners, we have a sense that they tend to identify the trade-offs between the number of areas targeted versus the amount per area. However, consistency in targeting areas may not be as salient. Our findings can help practitioners develop a portfolio of activities (Gardberg & Fombrun, 2006) that reduces noise and enhances credibility and authenticity.
Limitations and Further Research
While we are pleased with our extension of previous work, we recognize some limitations to this study. In contrast to McWilliams and Siegel (2000), we do not control for research and development (R&D). In our sample, many firms had R&D expenses and advertising expenses that did not reach the level reported in Compustat. However, corporate reputation should capture the secondary effects of these expenses. An additional limitation is the threat of common method variance from the use of questionnaire-based measures. However, several elements of our research design reduce this possibility. First, the three independent variables and firm-level control variables were collected from several different archival data sources. Second, although the hypothesized mediating variable and dependent variables originated from the same questionnaire administration, these two variables were separated from each other in the questionnaire, minimizing causal connections by respondents completing the items (Chang, van Witteloostuijn, & Eden, 2010). Third, the individual-level control variables are fact-based demographic characteristics (such as gender and sex), which also reduces the possibility that questionnaire administration affected responses (Chang et al., 2010; Podsakoff, MacKenzie, Lee, & Podsakoff, 2003). Fourth, a factor analysis of the questionnaire items satisfied Harman’s one factor test, as a single factor did not emerge from the factor analysis and one general factor did not account for the majority of the covariance among the variables (Podsakoff et al., 2003).
Endogeneity is a possible limitation for most model testing. We included corporate reputation as a control variable to capture omitted variables from the regressions models that could be correlated with any of the independent variables and in the special case of a relationship of simultaneous determination between the dependent variable and any of the independent variables (simultaneity). Driven by pertinent theory, we do not consider any of our independent variables to be codetermined with the dependent variables. In particular, our main independent variables represent firm-level behavior, whereas the dependent variables represent individual subjects’ responses. Additionally, driven by both theory as well as prior empirical work, we have expended extra effort to include in the models all pertinent controls related to the survey subjects and sample firms to alleviate the potential that omitted variables could give rise to endogeneity.
An additional potential limitation is the age of our data set, which the RI and HI collected in 2001. However, recent independent research by these organizations reinforces the role of CSP. For example, in its 2015 Media Release Report for the RQ (p. 4), HI (now part of Nielsen) states,
Of all reputation dimensions, Social Responsibility remains a high bar, with only five companies achieving excellent rankings on this dimension and 24 companies rated Poor or Very Poor. Companies continue to struggle to be viewed as a good member of the community.
Given the currency of the issue and the richness of the individual-level data set, we believe the insight into the reputation process remains a useful contribution.
While supporting the notion that corporate philanthropy research has been oversimplified, our research opens several opportunities for future research, such as more qualitative analysis of corporate activities and the use of additional statistical techniques, such as hierarchical linear modeling, to tease out these relationships. Rather than count the number of causes, we could use the percentage of foundation funds focused on each cause. It would also be interesting to examine the relationships of the causes to each firm’s line of businesses, as well as within different institutional environments (Gardberg & Fombrun, 2006).
In conclusion, we hypothesized and found that the characteristics of corporate philanthropy affect perception of social performance. We find that research on corporate citizenship activities and their consequences requires a more fine-grained conceptualization of activities. Using expenditures alone is not an adequate conceptualization of the activities. In our theoretical development, we distinguish three elements of signal strength. Signal amplitude, signal dispersion, and signal consistency operate together to shape CSP awareness and CSP perception. We assert that each plays an important role in understanding the relationships among actual CSP and reputation for CSP.
Footnotes
Acknowledgements
The authors would like to thank Duane Windsor and the editors of this special issue—Antonio Argandoña, Christine Choirat, Rosa Chun, and Donald Siegel—as well as the anonymous reviewers, whose feedback enhanced our article and its contribution. The authors also would like to acknowledge the Reputation Institute, Harris Interactive, Charles Fombrun, and Joy Sever for access to data as well as the research assistantships of Jenny Rea and Afzaal Mohammed. We also greatly appreciate feedback on earlier versions of this paper from reviewers and audiences during an International Association for Business and Society (IABS) conference and an Academy of Management conference where it appeared in the Best Paper Proceedings.
Declaration of Conflicting Interests
The authors declared no potential conflicts of interest with respect to the research, authorship, and/or publication of this article.
Funding
The authors disclosed receipt of the following financial support for the research, authorship, and/or publication of this article: Support for this project was provided by a PSC-CUNY Award, jointly funded by The Professional Staff Congress and The City University of New York.