
Abstract
The Sustainable Apparel Coalition’s Facility Environmental Module (FEM) is one of the world’s most advanced “data-driven governance” initiatives. The FEM represents an important new strategy in the governance of Global Value Chains. This article reports on a multi-year study to evaluate how firms have implemented the FEM, and whether and under what conditions it leads to improvements in factory performance. It finds that while the FEM represents an important step in improving environmental measurement systems, the program currently acts like a “scale without a diet.” Companies are now better able to measure performance, but many have not implemented the mechanisms needed to motivate systematic improvements. This article offers recommendations for how to strengthen data-driven governance systems and explores their implications for managers.
Multiple crises rocked the global apparel industry in 2020. The COVID-19 pandemic led to an economic crisis that rapidly reduced consumer demand for apparel, which led to bankruptcies across the industry. In turn, brands and retailers were exposed for withholding payments for already produced garments, cutting contracts, and requesting discounts for future orders. 1 An even larger scandal exposed forced labor of Uyghur minorities in Xinjiang China, including factories producing for the “Better Cotton Initiative.” 2 These scandals added to growing consumer and NGO concerns about the apparel industry’s role in labor controversies, local pollution incidents, and climate change. 3 The crises of 2020 showed that the apparel industry was not fully in control of its own supply chains, highlighting problematic management and misaligned incentives across the industry.
Despite advances in supply chain management, “big data” monitoring systems, and literally billions of dollars invested in “corporate social responsibility” efforts, initiatives such as new sustainability standards, codes of conduct, monitoring systems, and capacity-building programs have largely failed to drive meaningful progress in the environmental or labor performance of the apparel industry. 4 Even brands and retailers committed to improving practices have seen limited, one-factory-at-a-time effects. Some of the most “socially responsible” brands in the industry have been caught up in the Uyghur forced labor scandal. 5
Continued non-compliance with environmental and labor standards is due in part to the structure of the industry. Complex supply webs, four or five tiers deep, down to raw material production, to subcontractors of subcontractors, make it very hard for brands and retailers to have full visibility or control over their supply chains. At the same time, most apparel factories produce for 20 or more brands, and thus receive complicated, sometimes conflicting Corporate Social Responsibility (CSR) requirements. Apparel factories complain about being required to conduct 20 slightly different audits by 20 different buyers, with sometimes conflicting requirements for the exact placement of fire extinguishers. Rarely does a single buyer have much influence over a given factory’s practices. 6 More importantly, buyer demands on pricing, delivery times, and quality standards often pressure factories to violate the environmental and social standards of those same buyers. 7
With the growth of “fast fashion,” eCommerce platforms, direct-to-consumer supply chains, and algorithms replacing traditional retail buyers, the apparel industry may now have even less control of its value chains. This has motivated a new round of experiments and initiatives—largely based on “big data” systems—to govern these increasingly complex, dispersed, and fast-moving supply webs.
This article seeks to answer a core set of questions around how the FEM has been implemented, what impacts it has had on factories and brands, and under what conditions it has driven improvements in factory performance. We proceed by first laying out the theory of data-driven governance, then examining the empirical results from 12,000 FEM factory audits, a survey of over 200 factories, and interviews inside factories in Bangladesh and China, and then providing analysis on the effectiveness of the FEM. We conclude with recommendations for corporate managers.
Data-Driven Governance
A wide range of analysts have argued that neither traditional government regulation nor individual corporate CSR initiatives are up to the task of governing the environmental and labor impacts of complex, dynamic global supply networks. 8 Instead, coalitions of industry actors and non-governmental organizations have emerged to manage sustainability issues within production networks. 9 These networks are increasingly turning to data-driven techniques of governance. Here we mean governance as multi-stakeholder systems of rules and institutions, where actors share power and design policies, standards, or regulations to coordinate or control supply chains. 10 This version of governance is relational, and quite distinct from internal corporate supply chain governance focused on such things as quality, speed, and innovation.
Sustainability data systems are of course not new. However, they are increasingly embedded within more advanced supply chain management systems. As brands and retailers have adopted data-based techniques for lean supply chain operations, demand forecasting, and product development, 11 there have been growing efforts to integrate sustainability data into these systems. In these emerging systems, brands and retailers can evaluate their suppliers on quantitative sustainability metrics (alongside price, quality, and delivery times) and thereby hold their suppliers accountable to sustainability standards. 12
In early data-based governance systems, which were primarily internal performance management systems, firms focused on investments that make them more resilient to supply chain disruptions and reputational risks. 13 Firms, not surprisingly, have also leveraged factory sustainability data (e.g., on energy, water, materials, and waste) for lowering costs and managing supply networks. Despite clear industry interest in data-driven systems, there is limited research on whether and when they are effective in supporting sustainability improvements.
The Global Value Chains (GVC) literature points to several key components and challenges to effective supply chain governance, including effective communication of information down supply chains (in this case, both product and sustainability standards); collaborative problem solving among actors in the supply chain; capacity building to perform and comply with standards; enforcement mechanisms; and incentives for action. 14 Each of these activities face challenges in implementation and raise questions about who sets the standards, monitors performance, builds capacity, and enforces the standards.
It is important to note a critical difference in many data-driven systems around their underlying models of information flow. The most common information flow we term “insider visibility,” which is defined by the transmission of standards and rules from buyers to suppliers, and a flow of policy or performance data from suppliers back to buyers. 15 Within this definition, information remains private. The second model we term “transparency,” where third parties, regulators, and/or consumers are provided access to information needed to make decisions. 16 For either information-flow model to support meaningful changes, the information needs to be appropriate for the objectives, delivered at the right time, fit within existing decision structures, and available to appropriate decision makers. 17
Brands and retailers in the apparel industry have been proponents of insider-visibility and generally resistant to public transparency. Many buyers believe that external stakeholders do not understand their business constraints, commitments, or processes. Even factory location information is viewed as confidential information. The proponents of insider visibility argue the key to changing supply chains is to resolve information asymmetries between suppliers and buyers. Recent research shows that suppliers are highly attuned to these buyer-supplier relationships, 18 responding most strongly to negative incentives (e.g., loss of contracts). 19 Still other research shows that these incentives are best packaged within committed, collaborative relationships, 20 where there is flexibility in contracts for suppliers to reform based on audit results. 21 Indeed, many supplier reform efforts are hamstrung by restrictive terms of contracts 22 or face auditors who are not focused on helping improve the factories. 23
Naturally, many stakeholders are skeptical of letting businesses govern themselves and have advocated for greater public transparency. 24 Transparency-based governance frameworks envision consistent and comparable data, where stakeholders can hold businesses accountable through reputation-focused media campaigns, activist-investing, consumer voting-with-their-dollars, or a centralized process for public comparison and “ratcheting up” of standards. 25
Despite information being central to data-driven governance, procuring sustainability information has proven exceedingly difficult. 26 Even the most basic form of supply chain information—factory location data—has been marred by inaccuracies and missing data. Factory labor and environmental performance data are even more problematic. Where information has been produced, the lack of broad market uptake has limited comparability across buyers and suppliers. 27
A number of initiatives (such as ISO 14000) have responded to the challenges of gathering performance data with systems focused instead on process-based standards. 28 However, it is not clear how and when process-based programs yield improved performance in areas that touch on core business practices. 29 Despite increasing demands for performance and process data, suppliers are still most attuned to metrics on price, quality, and on-time delivery.
The Sustainable Apparel Coalition
The Sustainable Apparel Coalition (SAC), a 12-year-old multi-stakeholder initiative, has developed one of the most sophisticated data-driven governance systems in any industry. The primary output of the SAC has been the “Higg Index,” a suite of six data tools that include a factory environmental assessment; factory labor assessment; brand environmental assessment; product life cycle analysis tool; material sustainability index; and a tool for sourcing agents. The Facility Environment Module (FEM), now in version 3.0, is the most developed and deployed of these tools. It should be noted that the majority of our empirical data comes from the FEM v2.0 implementation. The FEM is an annual assessment of an apparel factory’s environmental management capabilities, procedures, and plans. These data are self-reported by the factory, can be verified by an auditor, and then shared via the Higg Index platform with buyers who request it.
Originally developed by Nike and the Outdoor Industry Association, the Higg Index has been managed, refined, and expanded by the Sustainable Apparel Coalition (SAC) 30 and its members. The Higg Index has sought to become the global standard for not only measuring sustainability in apparel and footwear factories, but also for creating decision support tools to improve the sustainability of the industry.
The FEM assesses factory compliance and performance in seven environmental categories: air emissions, chemicals, energy, environmental management, solid waste, wastewater, and water. In version 2.0, the FEM had 12 questions that required a quantitative response regarding things such as emissions to air, energy use, and annual production. The bulk of the FEM consists of qualitative responses, and scores are calculated based on responses to a subset of binary “yes-no” questions. Most of the questions in the FEM focus on process and compliance questions, while performance measurements are still quite rudimentary.
The FEM was created to be the industry standard assessment, resolving several collective action issues. It was designed to replace buyers’ bespoke factory audits—enabling comparison across factories, brands, and products; reducing audit fatigue for suppliers; and enabling data sharing across the industry.
Essentially, leading apparel brands, retailers, Tier 1 manufacturers, and material suppliers have come together through the FEM to agree on what to measure, and then what to do to improve conditions. The foundation of this “theory of change” is data, performance metrics, tools to compare practices and factories, and ongoing processes to measure improvements.
Best practices are disseminated through an online platform as well as at regular manufacturer forums, the annual SAC member meeting, and through informal channels. The SAC outlined the FEM’s benefits to facilities as: Benchmarking by facility type allows facility managers to compare their performance against their peers. The module’s aspirational-level questions give manufacturers clear guidance on hotspots for improvement and outline the current best practices in the field.
31
The SAC added in 2018 that “the Higg Facility tools create opportunities for open conversation among supply chain partners so businesses at every tier in the value chain collectively perform better.” 32 Information, capacity building, and collaboration are central to the SAC’s strategy of governance.
To date, the FEM data for a particular supplier are not shared beyond individual buyer-supplier relationships. The SAC continues to discuss whether and how to share the data more widely. As SAC Executive Director Amina Razvi recently asserted, We absolutely agree that scores should be transparent. Open and credible data has always been the ultimate goal of these industry tools, and we are getting closer to this being realized. Manufacturer members of the Sustainable Apparel Coalition can already communicate their performance scores and, in the coming months, all verified Higg FEM assessments will be shareable.
33
Research
From a growth and coverage perspective, the FEM appears to be a major success. It has expanded across countries and down tiers in the supply chain. But how exactly has the FEM been implemented? What impacts has it had on factories and brands? And where and under what conditions has it driven improvements in factory performance?
Our research began with an analysis of 12,000 anonymized FEM v2.0 audits from 80 countries over four years. We then surveyed 243 “high-performing” facilities (according to FEM metrics) and conducted in-depth site visits at eight factories in Bangladesh and China. (See the Appendix for more detail on our research methods.) By combining analysis of the large N-sample, with interviews of factory managers, document review, and facility tours, we sought to understand exactly how the FEM was deployed in these factories, and what role data-driven governance schemes played in efforts to improve factory performance.
Our core questions center around how exactly the FEM has been implemented, what impacts it has had on factories and brands, and where and under what conditions it has driven improvements in factory performance. We are also interested in whether and how the FEM has responded to the main challenges identified by the industry: communicating clear information and standards up and down supply chains, identifying and sharing best practices, and motivating improvements.
Communicating Clear Standards
Our first question was whether the FEM helped convey a clear and consistent set of standards. This would appear to be the FEM’s largest success. Each year, the number of assessments has grown, culminating in over 4,000 FEM 2.0 modules posted in 2016. Seven hundred fifteen facilities submitted assessments in multiple years, and there were 663 on-site and 79 off-site verified modules. In the first year of FEM 3.0, in 2017, the number of assessments increased to 7,056. Figure 1 shows the growth in FEM assessments over time.
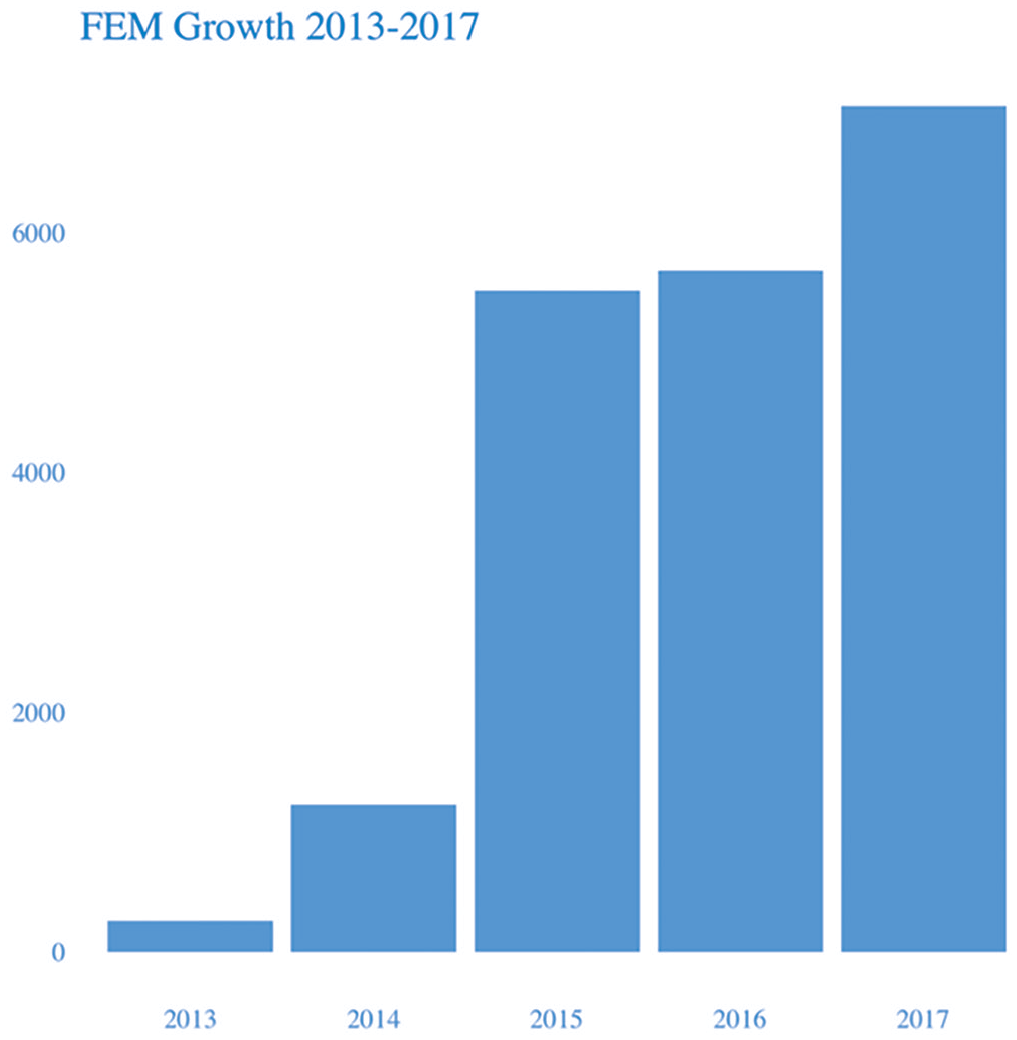
FEM modules posted by year. 2013-2016 show FEM 2.0 modules, while 2017 data show FEM 3.0 modules.
The FEM has achieved broad geographical coverage, with facilities assessed in over 80 countries, with China leading with 5,117 posted modules, India with 1,054 posted modules, Vietnam with 1,066 posted modules, and Bangladesh with 965 posted modules. Figure 2 shows the number of FEM assessments by country.

Top six countries for completed FEM 2.0 assessments.
While the FEM has grown very quickly, the facilities participating in our case studies noted they were still filling out multiple assessments for different buyers. In a number of Chinese facilities, we saw evidence that the FEM was beginning to satisfy multiple buyers’ requirements. By 2017, 124 brands and retailers (the buyers) had completed their own environmental modules, greatly increasing the number of connections identified within the system and likely motivating further adoption and use by facilities. The industry consulting firm Anthesis estimated in June 2017 that 20% of facilities were connected to multiple brands or retailers, likely alleviating some audit fatigue for those facilities.
Our visits to facilities in China and Bangladesh showed that despite efforts to simplify the FEM, facilities are still sometimes unclear about how to complete the assessment. Questions were often not worded clearly enough for facility managers, and buyers and third-party assessors often were not certain how to interpret responses. The FEM does provide support in its companion “How-to Higg” document. However, this was not translated into local languages. Several facilities noted that third-party assessors were not qualified to verify answers or provide support for more advanced questions in FEM v3.0. Since third-party assessors are key interlocutors of the Higg Index initiative, this represents a significant barrier to improvement.
Facilities are, of course, diverse in their operations and size. Unfortunately, the FEM v2.0 lacked a clear mechanism to classify facilities by type. For size, there were two questions: annual production weight and annual produced units. Responses were not standardized, nor was it possible to clearly identify faulty information. While flexible for facilities to enter information, the information is nearly unusable without more knowledge of the facility.
Moreover, each buyer may have different requirements based on their own internal goals. This means that even a standardized assessment like the FEM can generate discrepancies based on varying interpretations. Despite the FEM’s promise to alleviate audit fatigue, several brands had different standards for FEM responses. For example, while one brand might accept a local environmental lab chemical test, another would require international accreditation. The FEM did not provide guidance for a standard interpretation. This lack of specificity often resulted in extra work for environmental managers and multiple reports. While the FEM v.3.0 has worked to simplify and clarify questions further, this problem may be exacerbated as more brands use the FEM. Figure 3 shows that factories continue to employ additional Environmental Management Systems.
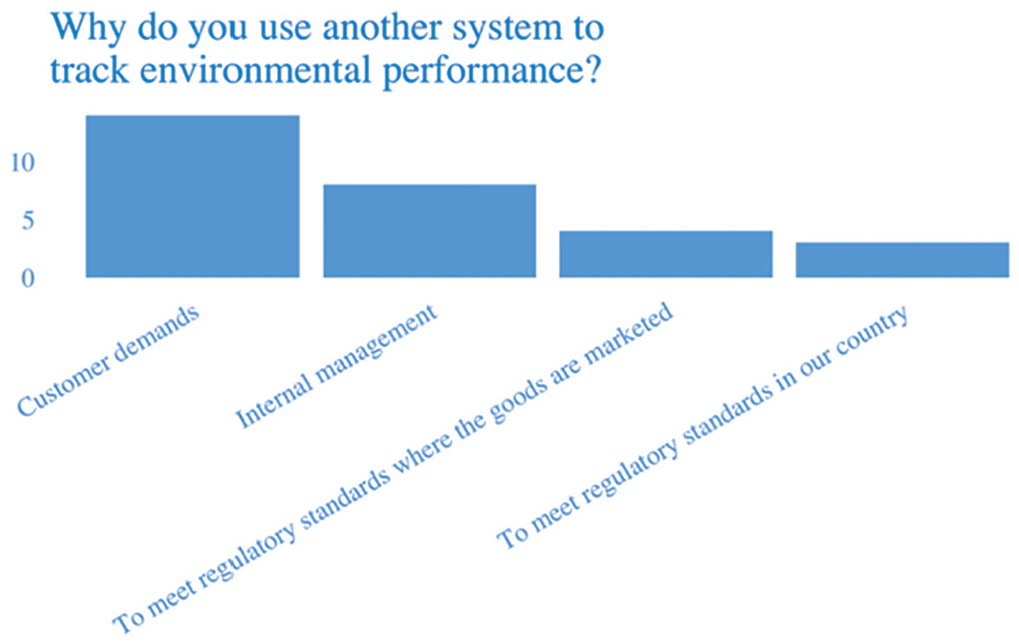
Why do you use other Environmental Management Systems besides the FEM?
Sharing Best Practices and Building Capacity
Our second question is whether the act of implementing the FEM—essentially assessing environmental conditions in a factory—helps factories identify their largest impact areas and build their technical capacity to implement sustainability improvements.
Factory capacity includes environmental management systems, technical knowledge, procedures for turning information into action, and mechanisms for learning. The FEM has two mechanisms for capacity building. The FEM acts as a prescriptive framework for environmental management, directing managerial attention by the questions asked and scoring framework. Indirectly, the FEM can serve as the basis for learning through interaction with other manufacturers, third parties, and buyers.
We can begin to assess the direct effect of the FEM through score trends. Table 1 shows FEM score changes over time. If FEM scores increase, then it would indicate that facilities have responded to the prescriptive nature of the FEM questions by making adjustments to improve their scores. Looking at the total FEM score change (last year minus first year) for facilities that have completed multiple FEM surveys, there is a minimal increase in scores. Facilities that have multiple years of on-site verification appear to perform slightly better than those that simply self-assess, yet the sample size is much smaller. Other research has shown that collaborative, on-site verification can enhance capacity building. 34
Total FEM Score Change from First to Last Survey for Those Facilities with Multiple Surveys.
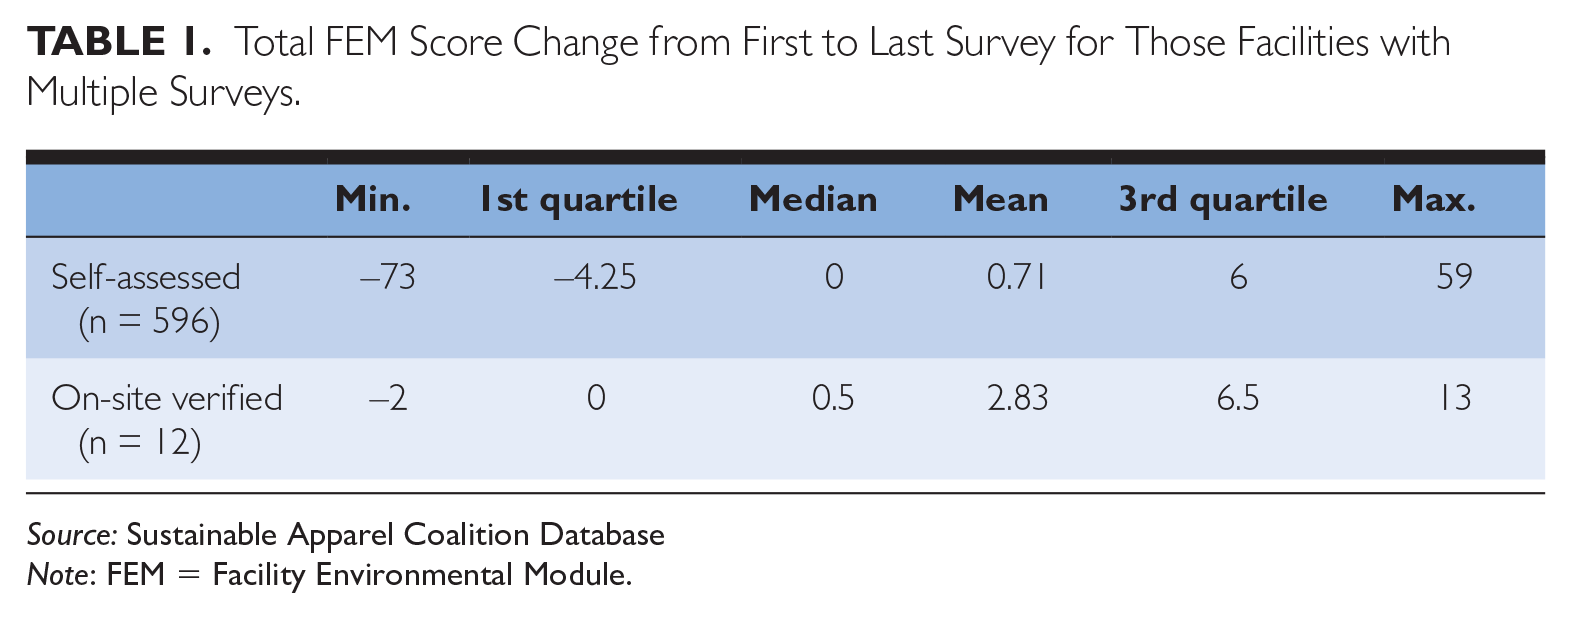
Source: Sustainable Apparel Coalition Database
Note: FEM = Facility Environmental Module.
In our survey and field visits, factories did report that the FEM had gotten their attention. The four Bangladeshi facilities we studied asserted that the FEM helped them craft a coherent vision for their environmental program, and that FEM section scores provided useful heuristics for allocating investment.
While the FEM may focus managerial attention toward specific issues, there is limited additional capacity building from the SAC. Facilities typically find solutions through in-house teams, third-party programs such as the Advisory Partnership for Cleaner Textile (in Bangladesh) or Clean by Design (mainly in China), or from buyers. These programs and partnerships provide facilities with best practices, implementation plans, and cost-benefit analyses. Even simple assessments and guidelines appeared to be helpful for less-advanced facilities.
However, our case studies and surveys showed that facilities were not receiving much feedback from buyers about the FEM. Figure 4 shows that sustainability communications, even with top-performing facilities, have remained mostly compliance-oriented.
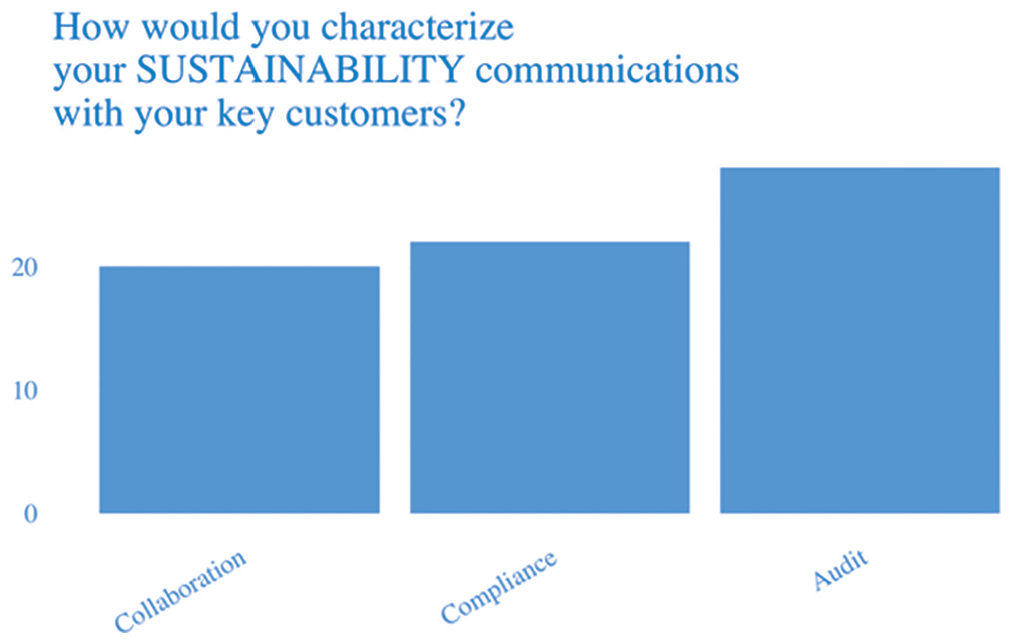
How would you characterize your sustainability communications with your key customers?
Despite this general trend, the FEM appeared to be most successful when coupled with buyer engagement and support. One facility noted that one of their buyers would host trainings with multiple facilities, as well as one-on-one training. Buyer support has been essential for more substantive environmental investments. Figure 5 shows that customer interactions have led to environmental improvements.
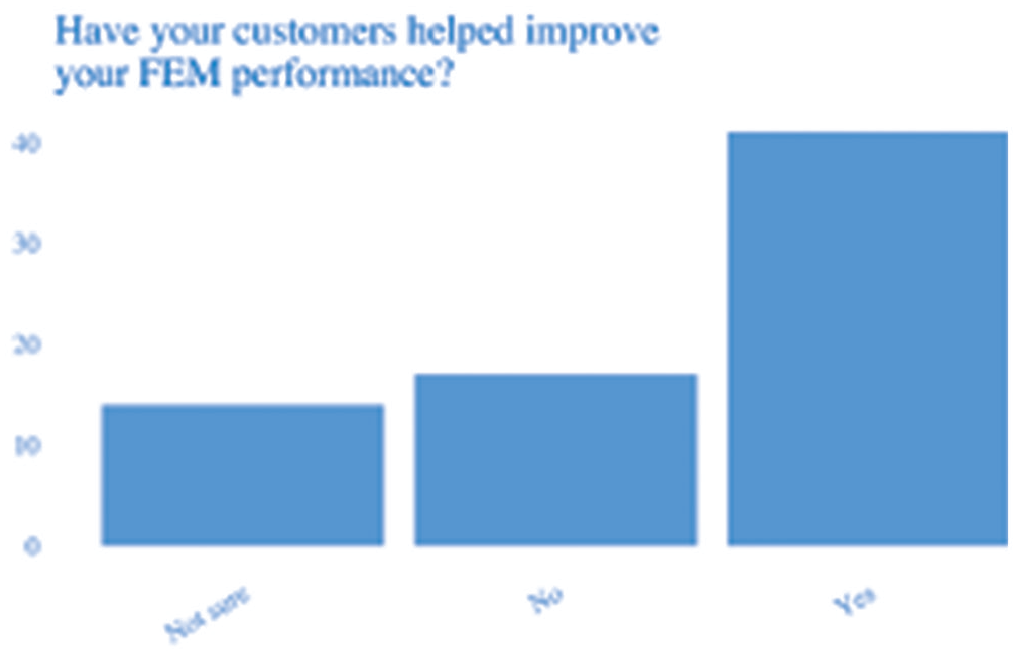
Have your customers helped improve your FEM performance?
Another key mechanism for learning—between peer facilities—remains limited within the FEM platform. The FEM data dashboard does not display comparisons with relevant facilities nor offer solutions that have been tested by other facilities. Facilities are not able to communicate with one another via the FEM platform. Factory managers expressed numerous times that seeing best practices from other factories would support their efforts. The SAC could do much more to support collaboration and capacity building.
Incentivizing Improvements
To properly evaluate whether the FEM has driven measurable improvements in environmental performance, it would be necessary to have a control group of facilities not using the FEM (or using a staggered cohort method). This control group and the FEM group would need to have comparable data. However, comparable data on facility environmental performance is the precise problem the FEM is trying to address. We thus triangulate from our three data sources to draw preliminary insights.
Changing outcomes is often dependent on motivating and incentivizing the changes. The base goals of the FEM—setting standards, enhancing collaboration, and supporting capacity building—all support changing incentives indirectly. By making information clear and actionable, facility management can potentially interpret changes as beneficial to their facility instead of as a burden. The FEM also seeks to reduce the number of audits a facility needs to conduct, which should save them money and staff resources.
For facility management, the benefits that matter most are those that will position their company for financial growth. Managers are keenly attuned to changes that will result in increased orders, better order-terms (financial as well as logistical), and more customers. These are direct changes to facility incentives that could have a large effect on environmental outcomes if they are tied together.
Facilities acknowledged that environmental management generally benefits them through cost savings. When facilities were asked a more direct question about contracts for new orders, the response was more mixed. As shown in Figure 6, the majority believed that their environmental management did help them win contracts; however, there were a large number of unsure and unlikely responses. This is an indication that facilities might see financial benefits in other areas, for instance, from resource conservation and efficiency gains. Yet, the FEM would more directly provide financial value to facilities if they knew their FEM performance would influence the contracts they receive. Factory managers in Bangladesh stated they would have liked to use the FEM data to market themselves to buyers. However, they were unsure of how to do so and if it would be effective.
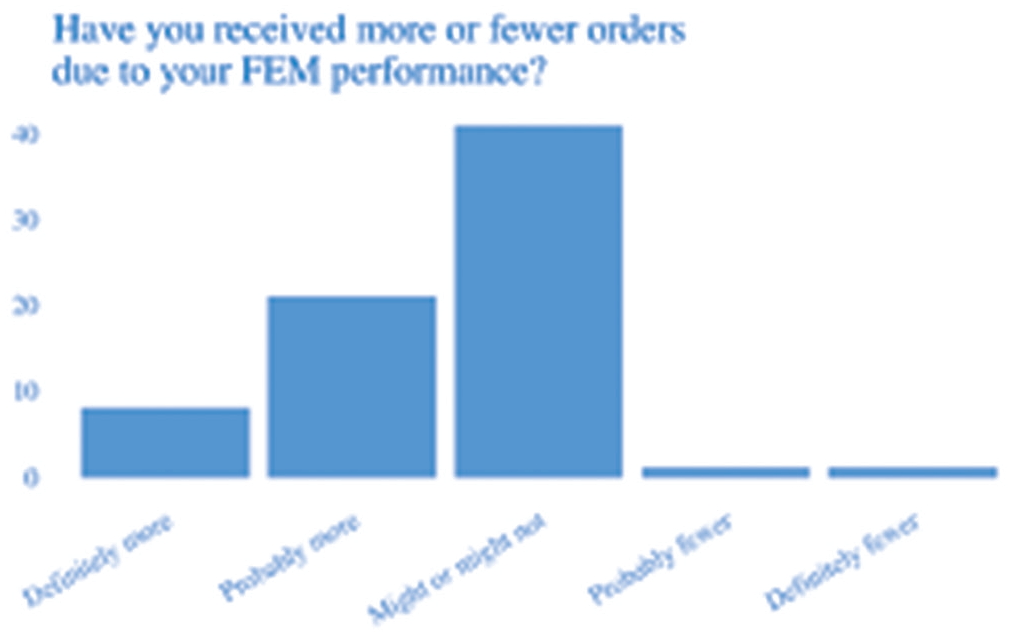
Have you received more or fewer orders due to your FEM performance?
High-performing facilities requested that the SAC help them to leverage FEM scores to gain new and better production contracts. The FEM is currently not linked into any of the other Higg Index tools, such as the design or sourcing modules. FEM data need to be delivered at the right time, to the right people in the most accessible format in order to become a more consequential piece of information for buyers. Overall, we did not see much evidence of the FEM substantially and directly influencing facility incentives. The SAC could be more intentional about testing incentives that drive improvements.
In our site visits, facilities demonstrated a number of innovative environmental practices. These changes included installation of high-fixation dyes to reduce water and chemical use, low-liquor dyeing machines that reportedly saved 70% of water use over conventional dyeing machines, and steam condensers to reduce water use and conserve energy. Other improvements included better organized chemicals and waste management processes, rainwater harvesting, auto-dye dispensers, variable frequency drives, a waste sludge dryer, waste incineration boilers, and an exhaust gas boiler.
Facilities are thus making specific improvements alongside the FEM. However, as noted in Figure 7, it is not clear that the FEM is the driver of these changes. Indeed, none of the changes mentioned above were prescribed by FEM 2.0 questions. A majority of survey respondents stated the FEM did not help them identify a specific improvement area.
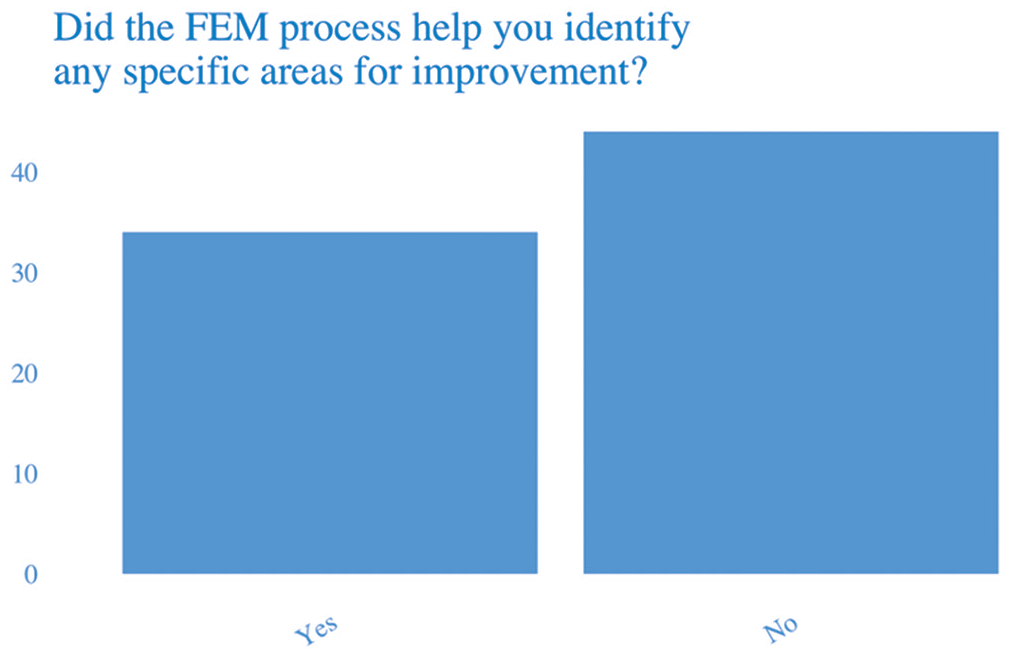
Did the FEM process help you identify any specific areas for improvement that you did not already know about?
Furthermore, it is not clear whether these process changes have yielded improved environmental conditions in the communities these factories operate. To properly evaluate whether the FEM has driven measurable improvements in environmental performance, it would be necessary to use data external to the FEM, in particular, local environmental quality and regulatory data. However, publicly available data on environmental performance is difficult to access, and even more difficult to attribute to individual facilities. 35 We thus rely on our three data sources to draw preliminary conclusions.
Conclusions
The challenges of managing the environmental and social impacts of global value chains can hardly be overstated. Over 30 years of initiatives by governments, international organizations, multinational brands, and NGOs have achieved quite limited progress in managing the negative impacts of apparel supply chains. 36 Continued poor performance is due in part to the structure of the industry, limited transparency, and conflicting incentives. The GVC literature points to several key challenges to effective governance: poor codification and communication of standards; limited collaboration between actors in the supply chain; limited capacity of firms to meet standards; ineffective enforcement mechanisms; and a lack of incentives for action. 37 As has now been well documented, implementing Codes of Conduct and third-party auditing systems, or developing simple capacity-building programs, have not been effective in creating consistent sustainability improvements. 38
The Higg Index and the FEM represent an important step in GVC strategies to improve environmental standards and measurement systems for the global apparel industry. However, much remains to be done. The FEM is essentially a scale without a diet. Or a workout plan. Or incentives to get in shape. There is measurement, but not nearly enough motivation to implement mechanisms to drive systematic improvements.
Implications for Corporate Supply Chain Managers
Our research is not just a story about factories needing to change. We also draw a number of insights for Corporate Social Responsibility and supply chain managers of global brands. Environmental improvements, rather than policies, processes, and reporting, will need to not only be measured and monitored, but also intentionally supported and rewarded. Innovative practices will then need to be shared across supply chains.
Information Collection and Sharing: While the FEM has made major advances in measurement standardization, there is a need to continue to improve data standards, quality, and verification. Improved data quality will increase confidence and use of data. 39 We recommend brands work to simplify the data they collect, to focus on actionable metrics, and then to show decisions are being made with the data, creating an incentive for improving data over time.
Collaboration: Due to the structure of the apparel industry, brands will need to collaborate to improve facilities that produce for multiple buyers. Buyers that share a facility should collaborate on standards and improvement timelines. Facilities should be able to share one improvement plan with multiple buyers. Buyers will need to agree on interpretation of questions and acceptable responses. Workers, communities, and stakeholders should be meaningfully involved in these processes. Recent successes of “worker social responsibility” and legally binding agreements show promise in bringing in workers and local governments into these efforts.
Capacity Building: Facility technical and managerial capacities need to be supported, not simply evaluated. Facilities should be directed to resources for improving performance. Facilities that demonstrate improvements should be rewarded with access to additional materials and training. As with Lean Manufacturing training programs, brands will need to encourage factories to communicate, compare, and share solutions with other factories.
Incentives: There is a need for real incentives for factory improvements. At present, the FEM only offers modest cost savings via reductions in audits. More meaningful incentives would include growth in sales, signing up top-tier buyers as customers, longer-term contracts, higher profit-margins contracts, or better payment terms. Poor-performing facilities, if performance cannot be improved in a timely manner, need to be substituted for higher-performing suppliers. Ultimately, buyers need to integrate environmental data into their core sourcing decisions.
In Table 2, we highlight some specific recommendations for CSR managers.
Summary of Recommendations for Corporate Supply Chain Managers.

Note: FEM = Facility Environmental Module; CSR = corporate social responsibility; SAC = sustainable apparel coalition;
CbD = Clean by Design; PaCT = Advisory Partnership for Cleaner Textile.
The case of the FEM shows that practitioners need to continually improve the quality—while narrowing the quantity—of the data they collect, with a focus on data that track actual performance in factories. Data systems should be designed to support action and to measure the impact of interventions on the root causes of problems. Managers then need to combine this with capacity building and incentives to motivate change.
In addition, we hypothesize that the Higg Index would benefit from moving toward public and consumer-facing transparency. Providing information that is detailed and standardized, as well as meaningful to consumers, will unlock incentives for buyers and suppliers. 40 Top-performing producers could receive recognition in the market and encourage continuous improvement and differentiation. Public transparency—first among buyers, and then to consumers—will help to build legitimacy and create additional incentives for action and innovation. This transparency can create new pressures on firms to act, become an ongoing accountability mechanism, and be a conduit of learning and continuous improvement.
Footnotes
Appendix
Acknowledgements
The authors would like to first thank the workers and factory managers in Bangladesh and China for graciously hosting, sharing their experiences, and completing our survey. The work would not have been possible without the support of Jason Kibbey, Amina Razvi, Elena Kocherovsky, and John Armstrong at the Sustainable Apparel Coalition and Higg.co for sharing the FEM data, their insights, connecting us with factories for the survey, and much more. Thanks to Phil Cory for help with data cleaning and analysis and the folks at Schneider-Electric for help accessing the FEM dataset. Thanks to our translator in China, Rina Lu, as well as Froylan Sifuentes and Elaine Zhu for document translation. Thanks to Adam Brennan and Angie Chen at C&A for their help connecting us with factories in China and a grant from the Laudes Foundation, where Jill Tucker and Sarah Ong provided indispensable support and feedback on the research. This study was reviewed by the UC Berkeley Committee for the Protection of Human Subjects, Protocol ID 2015-09-7910. Any errors that remain are our own.
Funding
The author(s) received financial support for the research, authorship, and/or publication of this article: This work was made possible by a grant from the Laudes Foundation.
Notes
Author Biographies
Dara O’Rourke, an Associate Professor at UC Berkeley, studies the environmental, social, and health impacts of global industry, founded GoodGuide.com, launched the Sustainability Science team inside Amazon.com, and conducted early research on Nike’s labor practices that helped ignite a new era of corporate accountability (
Niklas Lollo, a Principal Data Scientist at Higg.co, received his PhD in the Energy & Resources Group at UC Berkeley, and is an expert on “Data-Centric Private Governance” (