



Abstract
Patchiness in rural development remains a salient feature of many developed and developing countries that have struggled historically to overcome enormous national disparities in economic structure and well-being. This paper examines how one major, explicit rural policy ostensibly aimed at rural advancement—land reform—can impact uneven development in the countryside. It does so in Italy, where a major land reform redistributed large landholdings to individual peasant families after World War II. Based on original fine-grained data on land redistribution and a geographical regression discontinuity analysis that takes advantage of Italy’s zonal land reform approach, I find that greater land reform fueled comparative underdevelopment and precarity locally over the long term. Several related mechanisms delayed development in land reform zones: a slower transition out of agriculture, lower labor mobility, and an aging demographic. These are generalizable mechanisms that could operate in other cases of land reform beyond Italy.
Scholars have increasingly recognized the importance of left-behind rural peripheries in pockets of otherwise highly developed or developing countries. Economically stagnant rural locales can fuel out-migration, support for radical policy alternatives, a politics of resentment, lack of confidence in or even animus toward government, and the formation of place-based identities that stem from perceptions of deprivation (e.g., Cramer 2016, Gidron & Hall, 2017; Lehoucq, 2012).
A number of countries marked by these poorer rural areas have struggled historically to overcome enormous disparities in economic structure and well-being within the national territory. One important policy aimed at this transformation is land reform. Major land reforms that entail the large-scale redistribution of land have alone affected more than 1.5 billion people over the last century (Albertus, 2015). Countries such as Italy, Portugal, Chile, and South Korea launched large land reform programs in the second half of the 20th century that sought to level rural social and economic opportunities. Numerous other countries today, such as Brazil, Colombia, the Philippines, and South Africa have sizeable land reform programs that aim to redress historical injustices linked to land appropriation and broadly advance rural welfare.
But patchiness in rural development remains a feature of many of these countries. There are many plausible factors behind this pattern, such as industrialization, trade and infrastructure policies, and globalization. However, uneven development patterns are even present in areas that governments have sought to transform directly. This suggests training a focus on the consequences of rural policies themselves.
This paper provides one of the first empirical analyses of the developmental consequences of land reform using local-level land transfer data. It does so in a major case of late land reform in the West: land reform that occurred in Italy just after World War II. This was a prominent land reform viewed as key to uprooting communism and modernizing backward parts of Italy. The land reform had the support of the United States and other Western governments that believed large land ownership in Italy was a destabilizing force that had underpinned support for fascism and then served as a rallying cry for a snowballing worker’s movement.
I find that rather than rapidly advancing social and economic progress, land reform in Italy actually fueled underdevelopment locally. The analysis focuses on one of Italy’s largest land reform regions—the Maremma—that was located in central Italy. The delineation of the Maremma land reform zone led some municipalities to become targets of land reform by the central government and left otherwise similar, neighboring municipalities untouched.
I utilize a geographic regression discontinuity design to empirically identify the consequences of land reform exposure on development outcomes decades later. Areas that experienced greater land reform are comparatively more underdeveloped today than otherwise similar areas that experienced less land reform. The approach in this paper is similar to the pre-existing work by Caprettini et al. (2021) who use a geographic discontinuity approach to examine the political consequences of Italy’s land reform for the Christian Democratic party that ruled at the time of the land reform. These authors also focus on the Maremma zone as well as Delta Podano, a reform zone in northern Italy. 1
Several related mechanisms appear to have delayed development in places subjected to land reform: a slower transition out of agriculture, lower labor mobility, and an aging demographic. These are generalizable mechanisms that could have operated in other cases of land reform aside from Italy.
Further analyses cast doubt on several alternative explanations for the findings. These include pre-land reform differences in well-being, distortionary economic effects deriving from central government transfers, the possibility that residual large landholding and surviving brokerage networks may have driven underdevelopment, changing dynamics in economic sectors other than agriculture, and shifting investment to just outside the land reform zone.
The findings suggest a provocative and counterintuitive lesson: that the modern roots of underdevelopment in parts of the countryside lie not only in historical landholding but also in the policy solutions to that landholding in the form of land reform. In other words, land reform can contribute to the political roots of economic stagnation and a stalled rural–urban transformation. The final section of the paper provides a discussion of where these findings may generalize.
Land Reform and Development
High landholding inequality was a defining feature in most countries until the last century. Feudalism and colonial settlement patterns allocated enormous tracts of land to a small slice of powerful rural landowners. Landholding concentration persisted and remained politically salient well into the 20th century in most of Latin America, Southern Europe, Southern Africa, and East and South Asia. In these regions, smallholders, tenant farmers, and wage laborers faced onerous restrictions to movement (Rueschemeyer et al., 1992), choices of labor allocation (Albertus, 2017), the ability to access education (Galor et al., 2009), and the ability to accumulate land and to save and invest (Lipton, 2009).
Most scholars attribute sluggish development in inegalitarian rural economies at least in part to the pathologies of large landholding. Large landowners that command vast and uneducated labor pools can drive down rural wages and rural–urban migration (Rueschemeyer et al., 1992). This comes at the price of economic diversification, investment in human capital-intensive skills that are key to industrialization, and gains from urban agglomeration. Large landowners often oppose the rise of rival economic elites in cities that seek to shift government resources toward urban rather than rural constituencies, which can forestall modernization efforts (Ansell & Samuels, 2014; Galor et al., 2009). Furthermore, large landholders have historically opposed investment in public goods that underpin development such as widespread education and critical infrastructure (Engerman & Sokoloff, 2000).
Many policymakers starting around the 1950s advocated for land redistribution as a way to tackle rural poverty and inequality and unlock progress in the developing world, which would also help to undercut rural unrest and insurgency (Kapstein, 2017). Granting land directly to tenants and rural wage laborers was anticipated to address longstanding rural grievances over land appropriation and abuse by large landowners. Land reform would also underpin greater investment and production in rural areas by putting the land into the hands of those that worked it and eliminating land underutilization. This would in turn drive greater consumption and generate sufficient resources for rural dwellers to afford to send their children to school where they could learn skills to either enhance farm productivity or shift into the urban sector. Although advocacy for land reform has shifted over the decades to new modes and mechanisms, it remains an important plank of development thinking and is actively in place in countries such as Brazil, Colombia, Namibia, the Philippines, South Africa, and Venezuela.
A number of contributions support the notion that land reform can support development. Many scholars point to land reform in South Korea and Taiwan as providing a foundation for spectacular subsequent economic growth (e.g., Galor et al., 2009; Haggard & Kaufman, 1995). In a similar vein, land tenancy reform is linked to higher rates of own cultivation among middle-caste Indian households (Besley et al., 2016). And land reform is linked to income gains in South Africa (Keswell & Carter, 2014). Few of these studies, however, employ local-level data on land transfers in order to empirically assess land reform’s long-term development consequences in a well-identified manner. 2
I gathered fine-grained data on land expropriation and land reform zonal delimitations in Italy to assess the impact of land reform on development at the country’s most disaggregated administrative level: the municipality. I also investigate mechanisms of persistence through which the land reform could have left lingering impacts until the present. While it would be ideal to map historical receipt of land to contemporary well-being at the individual level, systematic data on land reform recipients, their children, and their grandchildren are unavailable.
Land reform in Italy is a fruitful case to study because, as is typically the case with land reform, the central government designed and implemented land reform in a top-down fashion that targeted large landowners and compelled them to forfeit their property. Furthermore, land beneficiaries received individual property rights like in some of the most successful land reforms in countries like Japan, South Korea, Taiwan, and the interwar Baltic states. 3 Land reform occurred in a context of democracy and therefore holds important lessons for many contemporary democracies that are conducting land reform. Finally, the government kept meticulous records of the regions and properties that were targeted with land reform, enabling a detailed empirical analysis of its impacts on long-term development.
I focus on three related and underemphasized mechanisms that could actually cause land reform to stymie rather than supercharge development. These are mechanisms that are underexamined in current literature but that could apply to a wide range of cases. The first is a slower transition out of agriculture. Land reform in Italy, like in many other countries, spread peasants out on the land and gave them enough support to survive but not enough to thrive. Land also acted as a form of economic and social insurance against negative shocks. Farmers gained land and built skills and knowledge in agriculture; and for some peasants, it satisfied a dream of finally becoming the master of their own life in agriculture. The result was that a disproportionate share of land reform beneficiaries and those that inherited the land remained in agriculture. As the broader economy shifted away from agriculture and agricultural wages and opportunities grew more slowly than in other sectors, this stunted development—in comparative terms—in land reform areas.
A second mechanism, linked to the first, is lower labor mobility. Peasants in Italy initially received plots of land with 30-year government loans that had to be repaid before they could sell or lease the land— again a common stipulation among land reform programs (see, e.g., Lipton, 2009). Beneficiaries also had to join a cooperative. This provided incentives for land reform beneficiaries to remain on the land and in the locales where that land was located. Many also stayed out of a desire to retain tradition. Labor immobility replicated itself with time as families became socially and economically embedded in agriculture and gained skills and knowledge suited to agriculture. Local economies developed to reflect these realities. Individuals in land reform areas came, over time, to have more limited opportunities in narrow local labor markets rather than participating in broader regional labor markets that presented more opportunities for upward mobility.
A third mechanism is linked to age demographics. Land reform beneficiaries received relatively small plots. These plots could not easily support a family when subdivided. This meant that while some individuals of the next generation inherited land and were more likely to remain in agriculture and local labor markets, those that did not had comparatively less local opportunity. This latter set of individuals often migrated elsewhere to seek other opportunities. The youth exodus narrowed the age pyramid locally and inhibited local economic dynamism over time by removing young talent and innovation.
Land Reform in Italy
Like other southern European countries such as Spain and Portugal, parts of Italy remained heavily agricultural and poor well into the twentieth century. The 1936 population census indicated that 52% of the labor force was employed in agriculture. The agricultural population was disproportionately poor. Just after World War II, there were approximately 2.5 million landless rural workers and nearly 2 million more that lacked sufficient land to support their basic household needs (Medici, 1948). Land inequality varied widely but was extreme in some regions. In the coastal region between Rome and Pisa known as the Maremma, for instance, the largest 1% of landowners held 75% of land (King, 1971, 370).
Rural poverty was particularly pervasive in southern Italy. There large estates known as latifundia dominated the countryside. Myriad proposals to modernize the south by transforming the latifundia structure failed, blocked by large landowners (Lupo, 1990). This generated worker resentment and periodic unrest in the form of strikes and land occupations. It also drove emigration to parts of Latin America and the United States.
Rural unrest again broke out immediately after World War II. Communist leaders made deep inroads in rural areas and began organizing workers to occupy uncultivated large estates. Violent clashes between peasants and the police broke out in several cases, most notably Calabria, where police fired into a crowd of civilians (Ginsborg, 2003, 124–125).
The Italian government sought to address festering problems in the rural sector with a series of land reform laws. On May 1950, the parliament passed the Legge Sila, a land reform bill that affected upland regions of Calabria. Parliament then passed a much more sweeping bill in October 1950, the Legge Stralcio, which targeted six broader regions across Italy for reform. Finally, a third land reform bill that covered all of Sicily, the Legge Siciliana, was passed and enacted by the Sicilian regional parliament in December 1950. The land reform zones together spanned over 8 million hectares of land—almost 30% of Italy’s territory.
Existing accounts suggest several complementary motivations for the land reform. The most common explanation is that the ruling Christian Democrats feared instability—predominantly in southern Italy—and pursued land reform in order to mitigate the most severe social and political grievances (Belotti, 1960; Kapstein, 2017). Relatedly, several authors argue that the Christian Democrats saw land reform as an opportunity to undercut the appeal of communists by directly delivering land to rural workers and thereby capture greater vote share while averting a political alliance between rural and urban workers (Caprettini et al., 2021; Rossi-Doria, 1958). Furthermore, land reform could be used to stem a potential flood of migrants to urban areas in the industrializing north (King, 1973).
The land reform bills created a classification of land expropriation criteria according to the size and productivity of estates. Large and more inefficient estates were subject to having up to 95% of their land expropriated, whereas small, productive properties were exempt.
Land reform implementation began in late 1951 and proceeded quickly through regional land reform boards (Enti di Riforma) organized by the ruling Christian Democrats. All expropriations in mainland Italy had been completed within 5 years and redistribution followed expropriation in short order. In some regions, it was substantially quicker: in the Maremma, for instance, expropriation was largely complete within approximately 1 year of the land reform law’s passage. The Italian government compensated expropriated landowners for their land with 25-year government bonds. Landowners could also apply to retain up to one-third of their holdings (known as the “third residual”) if they used that land in accordance with Ente di Riforma specifications and contractual labor law. In practice, relatively little land was exempted from expropriation in this way.
Rural workers who wanted to receive land through the land reform had to apply to one of the regional land reform boards. If selected, an applicant could purchase land with a long-term 30-year government loan. These loans had 3.5% annual interest. Land recipients could not sell their land prior to paying off the debt and were legally required to join a cooperative. 4
Popular demand for land was substantial: applications typically outstripped available land (Prinzi, 1956). Most successful applicants came from the same local towns where land was expropriated (Rossi-Doria, 1958, cited in Caprettini et al., 2021). Land grants were assigned in two forms: as plots intended to be self-sufficient farms (podere), often around 5–6 hectares in size, and as smaller units intended to supplement income from other sources (quota). Over 75% of beneficiaries were landless farm workers or tenants (Marciani, 1966).
Italy’s land reform ultimately expropriated nearly 700,000 hectares and redistributed that land to nearly 115,000 families (King, 1971, 377). Most of the land targeted for reform (87.5%) was privately held, either by absentee landowners (91% of private land) or in-residence farmers supported by wage laborers (9% of private land) (Belotti, 1960, 121). The government granted almost 50,000 poderi to beneficiaries and another 65,000 quote (King, 1971, 372). Although some landowners attempted to subvert the law and select land reform boards imposed tight credit restrictions on land beneficiaries later in the 1950s, an overwhelming majority of large landowners failed to skirt the law and most peasants retained their land (Ginsborg 1990, 131–137). 5
The government generously funded the land reform. The Ministry of Agriculture calculated the cost of land reform over its operative period from 1950 to 1964 at 709 billion lire—a large sum that computed to over 5 million lire per land reform beneficiary family. 6 Its activities were complemented by the Cassa per il Mezzogiorno, a development fund established by the central government in 1950 in order to accelerate economic and rural development in the south. The United States also supported the land reform through post-WWII Marshall Plan funds (Kapstein, 2017, 119–122).
Italy’s Land Reform Zones
Italy’s land reform laws broadly identified eight different zones as subject to reform: the upland region of Calabria in southern Italy, parts of Campania in the center south, the Delta Podano region in northern Italy, Maremma in western central Italy, the Fucino Basin in the center of the country, a broad swath of Lucania, Molise, and Puglia in the southeast, the entirety of the island of Sardinia, and all of Sicily. The laws left actual land reform implementation, including the precise definition of each specific land reform zone, to the executive branch.
The Christian Democratic government precisely defined land reform regions in early 1951 and organized a bureaucratic apparatus to implement the land reform. Each region was assigned its own land reform board (Ente di Riforma) for implementation; the boards were in turn governed by the central Ministry of Agriculture. Figure 1 displays the geographical delimitations of these regions.
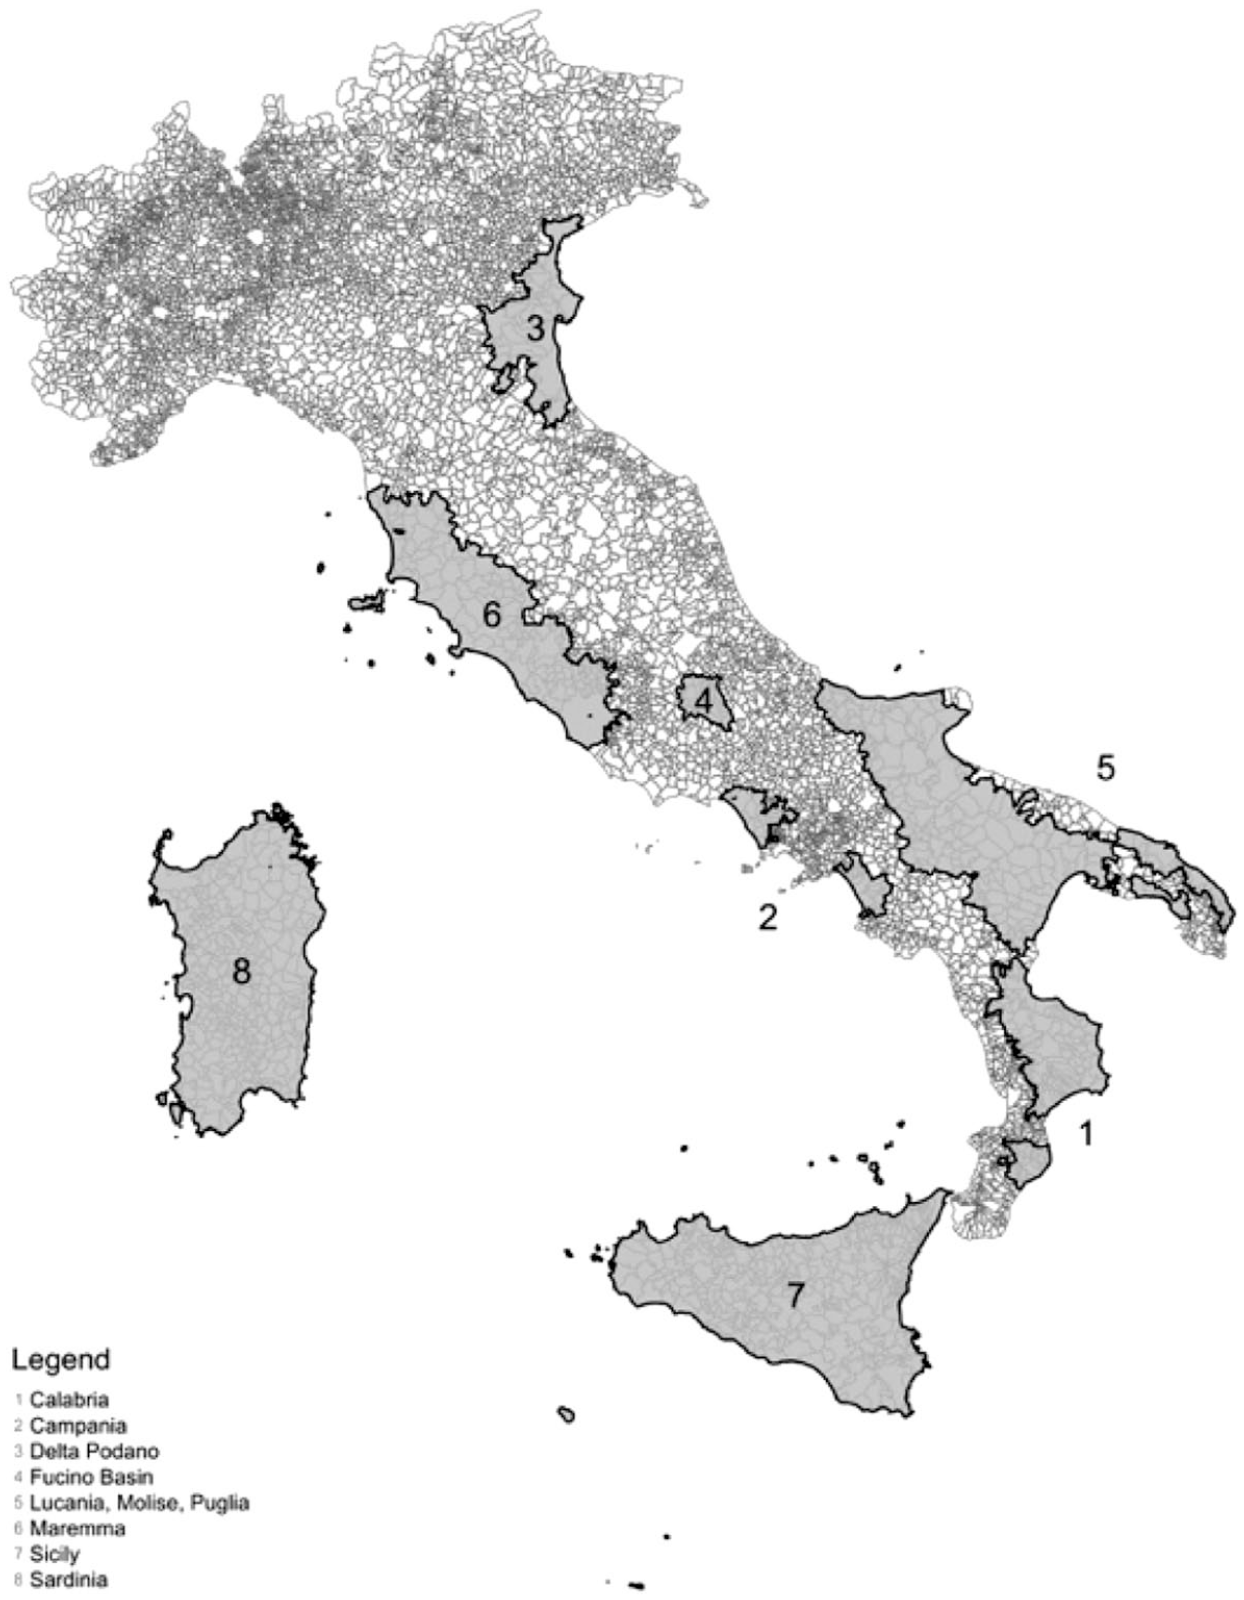
Land reform zones in Italy.
The land reform boards applied the legal criteria for land expropriation and distribution from the land reform laws within their zones. That entailed using data on the size and productivity of estates from the National Institute of Agrarian Economy’s 1945–1946 land survey and tax records to identify which properties to expropriate and redistribute. It also entailed splitting up these properties and assigning them in parcels to land applicants within the zone. Furthermore, the regional land reform boards took charge of land improvements, construction, road-building and irrigation works, and technical assistance and also contributed to social welfare and education. 7
One crucial consideration for the identification strategy this paper employs is how the land reform zones were delimited. To be sure, landholding patterns informed the land reform debate and parliament’s choice of which general regions to target for land reform. The regions identified for land reform had some of the highest landholding inequality in the country. But landholding inequality did not necessarily define specific zonal borders locally. 8 Furthermore, the government’s knowledge of specific towns along the land reform zonal boundaries was imperfect. For instance, knowledge on local soil types was spotty (King, 1971, 374). Critics argued that the government included some areas in land reform zones that did not need land reform and excluded others where land reform should have been conducted. 9 King (1971, 375), for instance, writes that “large areas of the central and southern Apennines, where the social structure was equally oppressive and hierarchical, were omitted and the landholding pattern - the basis of class distinction - left completely untouched.”
This is not to say that all of the land reform zonal boundaries were ultimately orthogonal to political, social, or economic factors. Caprettini et al. (2021) point out that the ruling Christian Democrats deliberated extensively on the delimitation of zonal boundaries in southern Italy in particular, ostensibly out of concern with communism in the region. These authors also note that some accounts document cases in which southern landowners lobbied the government to exclude their locales from the land reform zones.
But these dynamics did not play out in the same way in the north. The threat of Communism was less severe in the north and northern landowners were less economically powerful and less politically powerful within the Christian Democrats than southern landowners. This suggests training a focus on northern land reform areas over the south from a research design standpoint.
The Maremma Land Reform Zone
I focus on one particular land reform zone: the Maremma region. This is Zone 6 in Figure 1. I examine this zone for both substantive and empirical reasons. The Maremma region is a large region that experienced the most land reform in Italy along with the more sprawling and disparate zone of Lucania, Molise, and Puglia, making it a particularly important subject of analysis. The Maremma also contains a sufficiently sizable sample of municipalities that were affected by land reform, which facilitates isolating the impact of land reform separately from other factors that may be collinear with it in small reform zones like the Fucino Basin (Zone 4), Campania (Zone 2), and even Delta Podano (Zone 3).
There are also compelling reasons to focus on the Maremma region from an empirical standpoint. First, the Maremma land reform zone is geographically contiguous with areas that were not exposed to land reform. This makes it a good candidate for using a geographic regression discontinuity design for causal identification provided the discontinuity in land reform is not coterminous with other potentially important discontinuities. Not all land reform zones were geographically contiguous with unaffected areas, particularly the islands of Sicily (Zone 7) and Sardinia (Zone 8).
Furthermore, as mentioned above, there is no evidence that the boundaries of the Maremma zone were manipulated in a way that could also be linked to long-term development. Evidence instead suggests that the government had imperfect knowledge of the towns and conditions in this area, at least in part because of its fixation on the south. I confirm empirically below that municipalities located close to the land reform zone boundary within the Maremma zone are statistically indistinguishable from their counterparts on the other side of the border on a host of geographic, demographic, economic, agricultural, infrastructural, and political factors aside from land reform exposure. The same balance does not hold in the other large land reform zone of Lucania, Molise, and Puglia (Zone 5). 10
The Maremma zone also has the advantage of minimizing compound treatment effects that run along the borders that form the land reform zonal boundary. The Maremma land reform zonal boundary does not trace another single major administrative boundary. Italy is a unitary country comprised of municipalities that are nested within provinces, which are nested within regions. None of these subnational levels of government have historically had strong policymaking powers or administrative authorities, though among them regions are the most significant, having gained limited legislative and fiscal powers in recent decades.
The Maremma land reform zone boundary, which was entirely delimited by the central government, cut directly through regions and often cut directly through provinces. 11 Most of the Maremma zonal boundary simply ran along municipal boundaries. However, municipalities do not have significant policymaking or policy implementation authority pertinent to the outcomes examined here. These administrative units mainly issue ordinances, run public services such as transportation, and provide local services such as police and fire services.
Data and Research Design
To test the effects of land reform on long-term development, I analyze data on the distance of municipalities (comuni) to the nearest geographic boundary delineating the Maremma land reform zone as well as the distance of municipalities to one another, land expropriation in the early 1950s, and data on absolute and relative social and economic well-being. The unit of analysis is the municipality. These are very small administrative units. The median municipality in the Maremma zone had a population of 1,812 in the 1951 population census.
I generate an original dataset of all of Italy’s municipalities from the early 1950s on the basis of the 1951 atlas Atlante dei Comuni D’Italia. I minimize the extent to which changing political geography impacts the results principally by aggregating variable values to the municipality boundaries from the time land reform began. I also create several composite units of municipalities where they merged. 12
Land Reform Zones and Land Reform Treatment
A municipality’s exposure to land reform treatment in the Maremma land reform zone is determined by whether it is located inside or outside of the zone. To construct land reform zone boundaries and to determine whether municipalities were located within the Maremma land reform zone or another zone, I accessed a series of zonal maps of the land reform regions through archival work in Italy’s Central Archives of the State (Archivio centrale dello Stato). The land reform boards that operated within the zones created these maps and they were replicated in part or in whole in subsequent publications (e.g., Bandini, 1952; Prinzi, 1956). I scanned these maps and geo-referenced them to current maps. I then used ArcGIS software to map demarcation lines. This also generated information on the distance between a municipality’s centroid and the nearest land reform zonal boundary.
To quantify the effect of the discontinuity in land reform at the zonal boundaries, I constructed an original dataset that registers all land expropriations in Italy under the land reform program. This dataset documents nearly 700,000 hectares of expropriated land spanning over 600 municipalities. 13 I identified these expropriations in a comprehensive search through the Italian national archives with the assistance of an Italian research team. The land reform boards recorded and published details on each property that was expropriated for the purposes of land redistribution, including detailed information on the property owner, the municipal location of the land, the amount of land expropriated under different legislation, the amount of targeted land that was exempted from expropriation (typically under the “third residual” exemption), and expropriation timing. 14 Approximately 80,000 hectares of land in large landholdings were exempted from expropriation under the third residual exemption.
The land reform variable I construct captures the percentage of a municipality’s land that was expropriated and redistributed via the land reform legislation. The average percentage of land expropriated in municipalities within land reform zones was 5.5%; the figure was 11.6% for municipalities in Maremma. This figure is even more substantial considering that the median percentage of arable land in Maremma was 35%. That makes the extent of land reform in Maremma as a proportion of cultivable land comparable in intensity to land reform in Brazil over the last half century.
Figure 2 depicts the geographical distribution of the percentage of land expropriated by municipality across the entire country and just in the Maremma zone. The two regions of greatest land expropriation were Maremma and Lucania, Molise, and Puglia. Both had approximately 175,000 hectares of land expropriated. The region with the least land expropriation was Campania, where only 8,000 hectares of land were expropriated.

Land reform in Italy.
The figure clearly shows the discontinuity in land reform at the geographical boundary of the Maremma region. The Maremma zonal boundary only runs directly through one municipality: Rome. I drop Rome from the main analysis below because it is exceptional within the zone as a particularly large population center, a large municipality, and Italy’s capital. 15
To what extent did the land reform translate into the growth of small farms per se? The reform boards did not publish detailed individual data on reform beneficiaries and allotted plot sizes as they did for expropriations. Nonetheless, it is possible to approximate growth in the small farm sector by comparing pre-reform and post-reform land census data. Italy’s National Institute of Agrarian Economy conducted a monumental landholding census from 1945 to 1946 just prior to the land reform. It collected systematic data about land ownership by landowner, plot sizes, and land values from municipal cadastral registers. It published these data in 11 separate size and value categories of land in a series of regional data volumes (Medici, 1948). The first post-reform agricultural census with comparable landholding data is from 1970. The size categories of land differ somewhat from the pre-reform census, but both capture the number of farms from 2 to 10 hectares in size—a range capturing most distributed land.
I therefore constructed a variable for the change in the share of a municipality’s farms in the 2–10 hectare category based on data from the 1945–46 census digitized by Caprettini et al. (2021) and data I digitized from the 1970 agricultural census.
Development Outcomes
I use two main measures that capture wealth and overall well-being in order to evaluate the effect of land reform on development. The first measure captures economic deprivation through an index of social and material vulnerability. This is a comprehensive and widely used metric of poverty in Italy that is constructed by the National Statistics Institute on the basis of census data. It is calculated as the arithmetic mean of standardized municipal-level values of (i) the share of the population age 6 and older without a diploma; (ii) the incidence of families facing potential economic hardship; (iii) the incidence of families facing potential welfare difficulties; (iv) the share of homes characterized by severely over-crowded living conditions; (v) the share of families with 6 or more members; (vi) the incidence of young adult and single-parent families; and (vii) the share of young people who are neither employed nor students.
A second metric of overall well-being is a positional index of vulnerability. This measure is relative rather than absolute. It captures the numerical position that a municipality occupies in the national ranking of the social and material vulnerability index. This makes it possible to compare a municipality with other Italian municipalities with respect to the degree of social and material vulnerability. Larger numbers indicate greater relative vulnerability. Given Italy’s approximately 8,000 municipalities, a municipality that ranks high as “1” would be the least vulnerable municipality and one that ranks low closer to “8,000” would be among the most vulnerable. This variable is also taken from the National Statistics Institute.
Data on both of these variables are from the 2011 census. This is the most recently available census data.
Regression Discontinuity Estimation Framework
I use a geographic regression discontinuity framework to estimate how a discontinuous change in land reform exposure at the land reform zonal boundary impacted subsequent development outcomes. This entails comparing municipalities inside the land reform zone to municipalities outside the land reform zone.
It is critical in using this approach that the estimates are based on a comparison of similar municipalities. To that end, I follow the estimation approach of Keele and Titiunik (2015) that treats geographic boundaries as two-dimensional regression discontinuities in space. I use matching to pair each treated unit with a geographically proximate control unit. As is typical, units are matched on geographic distance to the border line, latitude, and longitude using nearest neighbor matching without replacement. 16
To estimate the effect of land reform, I measure differences in development across the boundary that divides the land reform zone from the non-land reform zone. The estimand is as follows

where ℬ is the land reform zonal boundary that separates the geographic treatment area from the control area. τ identifies the effect of land reform exposure on social and material vulnerability,
I present all of the findings using a range of bandwidths that encompass municipalities with centroids that span from 10 km to 50 km from the land reform boundary in increments of 1 km. The lines in each figure indicate the difference in estimates for a given bandwidth using 95% confidence intervals. 17
Presenting estimates across a spectrum of bandwidths can demonstrate the robustness of and limitations of the results. But it also calls for interpretation. Focusing only on municipalities within a very narrow bandwidth of the boundary faces the limitation that the precision of the estimates might be lower given a smaller sample size. 18 But as the bandwidth grows large, municipalities may start to be less comparable for unobserved reasons. Balance tests for some covariates also start to erode. Estimates are most credible and convincing in a middle-range bandwidth from the boundary, from about 15 to 35 km. There the sample of municipalities is sufficiently large to provide precise estimates but not so large that the identification assumptions erode. 19
Development Prior to Land Reform
Before examining the effect of land reform on poverty and well-being, it is important to first evaluate whether there were systematic pre-land reform differences in development across the land reform zonal boundaries. It could be the case, for example, that land reform areas were also worse off economically and socially prior to the land reform.
I draw on several pieces of data from the 1951 census to assess this since contemporary poverty metrics are not available from that time. These data capture circumstances that prevailed on the eve of land reform.
I gathered data from the newly digitized 1951 census to measure how rural municipalities were prior to the land reform. I use information on the percent of the economically active population that worked in agriculture. I next turned to data on the percent of the economically active population that worked in industry. Third, I examined data on educational attainment. Education is often closely linked to poverty, and even more so historically. Individuals who are less well-off could not as easily afford to send children to school and also relied on them to a greater degree for contributing income to the family through labor. I examine a measure of educational attainment that captures the share of the population age 6 or older that has a high school diploma or university degree. Finally, I examined data on home ownership rates. Home ownership is a common proxy for well-being given that poor families, and especially those that farm in rural areas, are much less likely to own their own homes and instead rent. Indeed, the census documentation itself indicates that this is a proxy for socioeconomic well-being. Home ownership is measured as the share of dwellings occupied by way of ownership relative to the total number of dwellings in a municipality.
Table 1 contains descriptive statistics on these and other variables. Further details on how all variables were constructed or collected are in Appendix Table A1. Distributions of key variables are in Appendix Figure A4.
Summary Statistics.

Figure 3 presents a series of balance tests to see whether the treatment and control groups differ in these measures prior to the land reform. Each subfigure presents the differences between the paired treatment and control units on either side of the land reform boundary within a range of bandwidths. Control municipalities outside of the land reform zone are the reference category. 20

Development characteristics prior to land reform.
The results in Figure 3 suggest that there was no distinguishable difference in how rural municipalities were, the share of employment in industry, or educational attainment across the land reform boundary prior to land reform. There is a slightly higher rate of home ownership in municipalities just inside the land reform zone compared to those just outside of it for bandwidths between approximately 15 km and 30 km from the zonal boundary. The effect is not large: approximately five percentage points, or one-third of a standard deviation. And it suggests that, if anything, areas inside the land reform zone were slightly better off than areas just outside of it.
Testing the Identification Assumption
Figure 3 establishes similar pre-reform levels of development across the land reform zonal boundary. The key identification assumption behind the RD estimation framework now is that all relevant factors aside from land reform treatment varied smoothly at the land reform zonal boundary at the time land reform occurred. This must be true for municipalities located just inside the land reform zone to be appropriate counterfactuals for municipalities just outside the zone.
I examine geographic, infrastructural, demographic, agricultural, and political factors at the outset of Italy’s land reform to assess the identification assumption. These factors could impact both land reform and later development outcomes.
To capture geography, I include a measure for whether a municipality is coastal, which can affect the character of economic activity and land use. I also utilize data on elevation, calculated using GIS software. I constructed the elevation variable using satellite data from the FAO-GAEZ. 21 Elevation proxies for more mountainous terrain that could make land reform implementation more difficult and complicate the provision of government goods and services that can support development.
I examine data on road density to tap infrastructural differences across municipalities. These infrastructural distinctions proxy for state capacity. Greater state infrastructural presence could be positively associated with land reform and also linked to development. I calculate road density as the number of meters of roads per square kilometer using GIS software. Data on roads are from a detailed 1954 map of road networks across the country produced by the Automobile Club d’Italia. The map includes national, provincial, and other secondary roads of varying quality. 22 I also include a measure of the distance of a municipality to Rome. This is an alternative way to capture proximity to state power.
I use population size, calculated from the 1951 population census, to capture demographic differences in municipalities. Larger populations can impact both land pressure and pressure on other economic resources and services.
I use data on the percentage of cultivated land in a municipality to capture land quality. These data were constructed using satellite data from the FAO-GAEZ and include information on soil quality, rainfall, and land use patterns. 23 Higher land quality could impact demand for land reform and directly support rural incomes. I also utilize data on the suitability of land to wheat production. 24 This was a key crop that was farmed by many rural laborers at the time and helped to define land tenure relations.
A final agricultural variable is landholding inequality. I use municipal-level data on land ownership and values from the 1945–1946 census digitized by Caprettini et al. (2021) and supplemented by Martinelli (2014) at the agrarian zone level. 25 I calculate land inequality as the ratio of land value held in the top four value categories (corresponding to above 20,000 lire) relative to the value held in the bottom four value categories (corresponding to 2 ,000 lire or less).
I use electoral data from the 1946 constituent assembly elections to measure political differences across municipalities. This was the closest election prior to the land reform where the Communists ran as an independent party. I examine vote share for the Communists and the Christian Democrats. The Christian Democrats garnered the most votes and formed the government that conducted land reform, whereas they viewed the Communists—advocates of radical land reform—as a threat to political stability and Italian post-war economic development. If the Christian Democrats explicitly sought to punish certain areas for their politics with the land reform (specifically Communists), then this could violate the identification assumption. 26 Data are from the Ministry of Interior’s historical election archive.
Figure 4 presents a statistical comparison of these factors across the land reform zonal boundary. The results indicate good balance between municipalities just within and just outside the land reform zone across the range of factors examined for a wide range of bandwidths. There is slight residual imbalance in land inequality between roughly 35 km and 50 km. But the differences are not especially large: land inequality ranges from 4 to 5 points higher in the treatment group until over 45 km from the boundary, or generally slightly less than one-third of a standard deviation of this variable. This suggests that municipalities just outside of the land reform zone are a good counterfactual for municipalities just inside the zone.
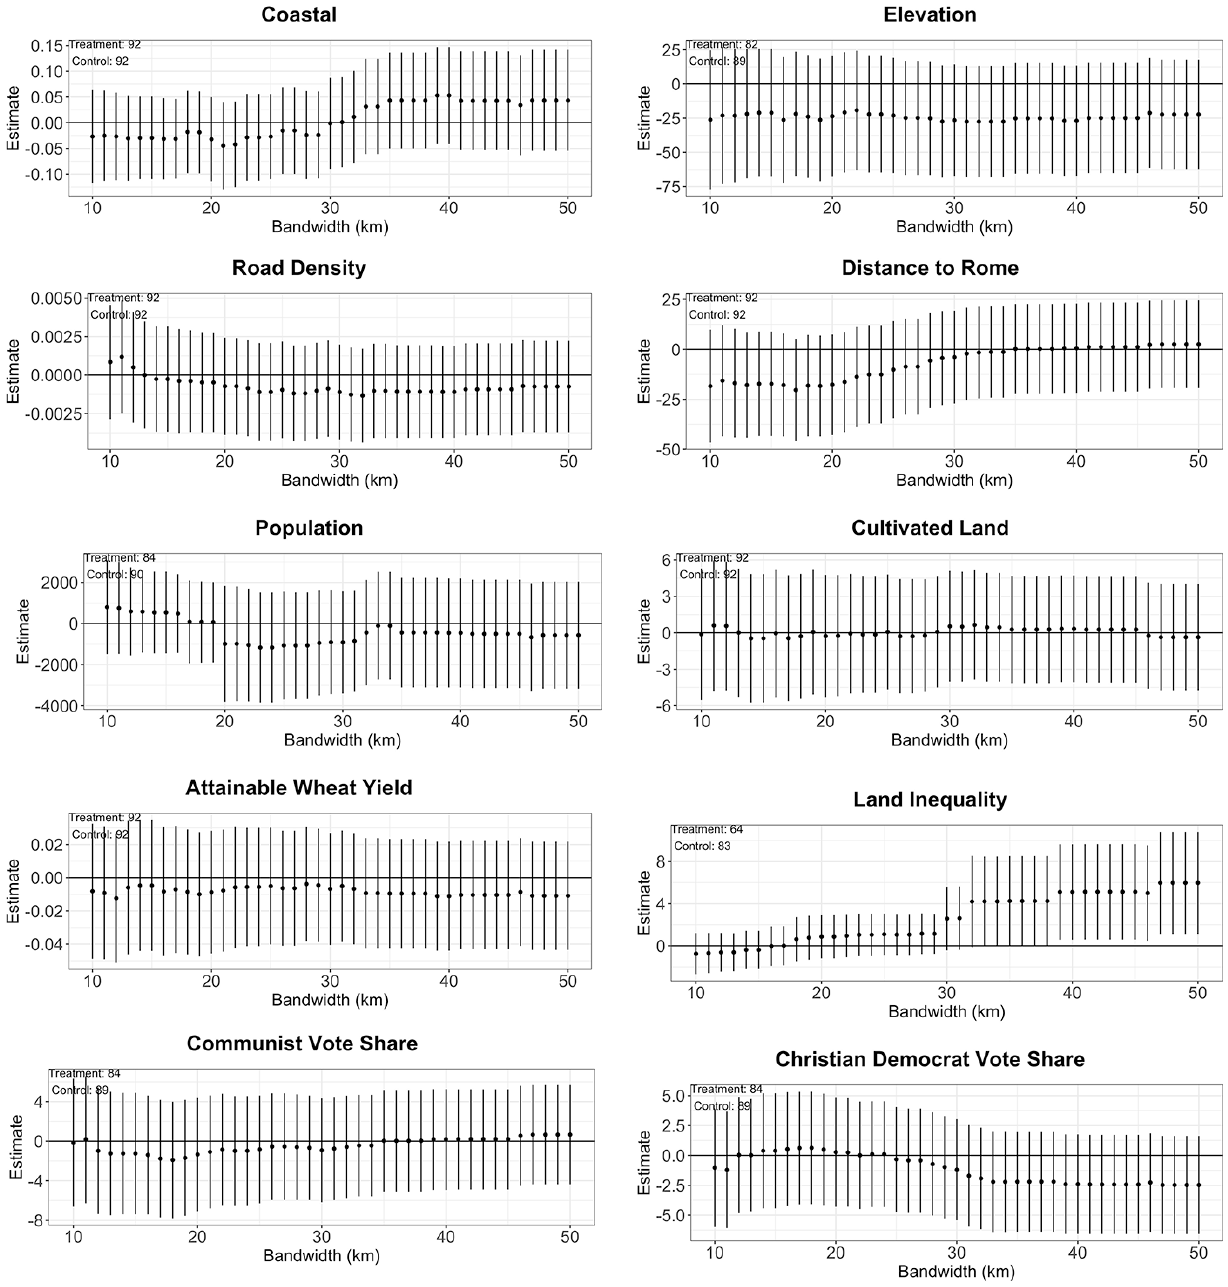
Covariate balance tests.
Results
Land Reform Treatment
To infer that subsequent development outcomes are driven by land reform, there must be systematic differences in land reform treatment across this boundary despite balance in preceding geographical, demographic, agricultural, and infrastructural factors. Furthermore, these differences should be substantial enough to be plausibly linked to the outcomes of interest.
The results, displayed in Figure 5, indicate a clear discontinuity in the percentage of municipal land area expropriated and redistributed at the zonal boundary. Being just inside the land reform zone translates into approximately 10% of a municipality’s land area affected by land reform. The difference across the boundary is equal to the estimated amount of land reform within the land reform zone at various distances from the boundary given that land reform did not occur outside of the zonal boundary. The amount of land reform increases slightly to roughly 12% with larger bandwidths approaching 50 km as municipalities that are more centrally located in the land reform zone are included. These effects are quite substantial, especially given that smaller properties were not affected by land reform and that significant portions of some municipalities were covered by non-agricultural land such as forest and swamps, and that public entities also owned land in some cases that was not subject to expropriation.
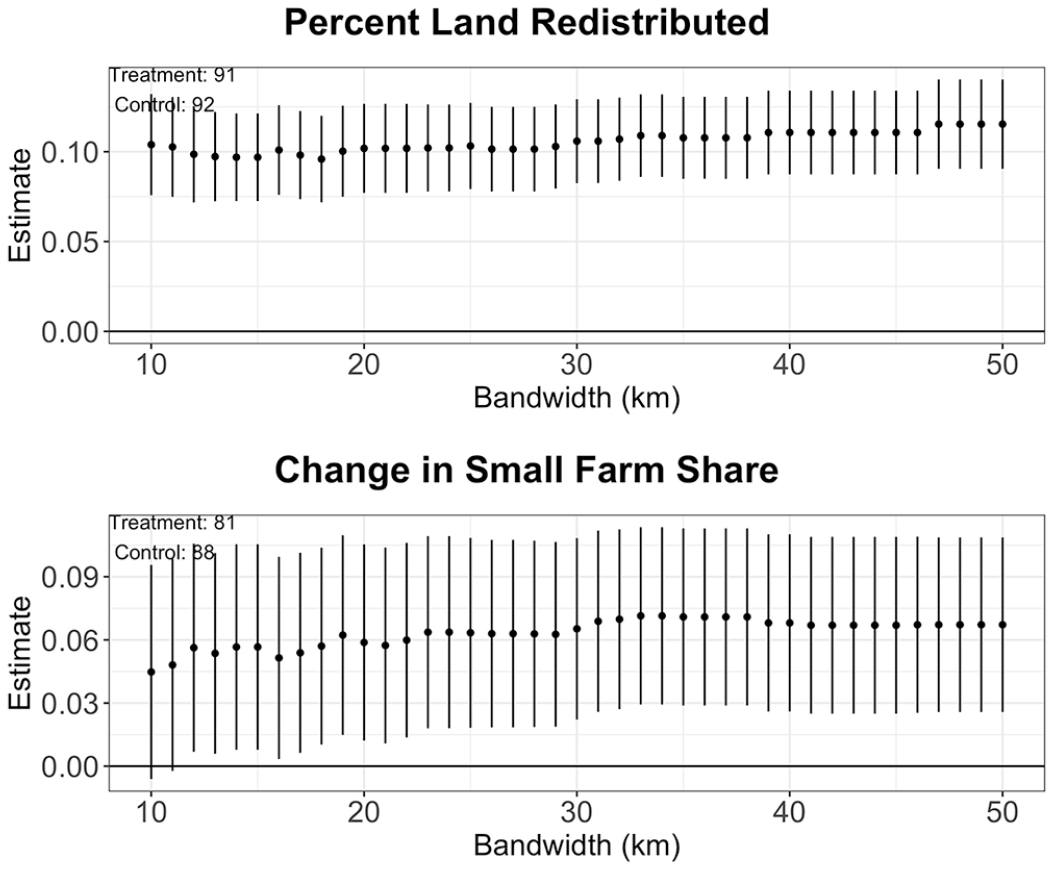
Land reform across the zonal boundary.
Figure 5 also indicates differential growth in the small farm sector. Comparing the post-reform versus pre-reform era, there were 5–7% more small farms of size 2–10 hectares as a share of total farms in municipalities within the land reform zone relative to those outside of the zone.
The Development Consequences of Land Reform
Figure 6 displays how development outcomes vary across the land reform boundary. The first row in Part A of the figure uses the full sample of municipalities within the indicated bandwidths. The first subfigure indicates a significantly higher rate of social and material vulnerability in municipalities within the land reform zone compared to those just outside of it. The index is about 0.3 points higher in zonal municipalities that are between 10 km and 20 km from the land reform boundary. The difference erodes to about 0.2 points for municipalities within 30 km from the boundary and then erodes even further beyond that. 27
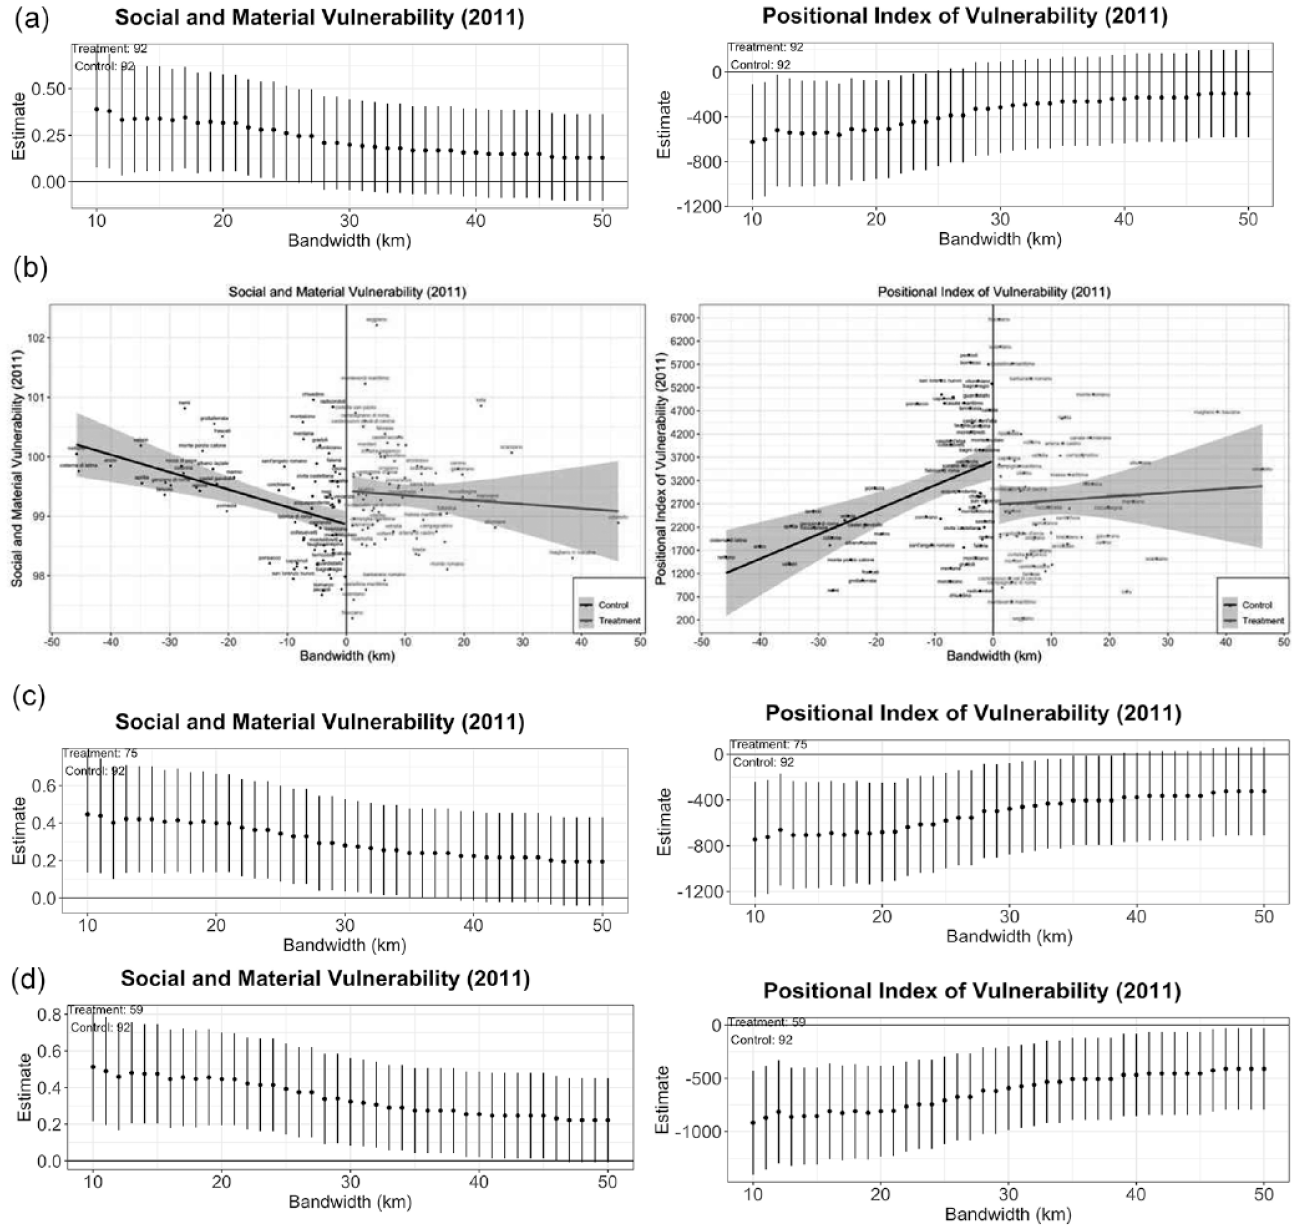
Contemporary social and material vulnerability: (a) full sample; (b) RD plots of zonal location on social and material vulnerability; (c) restricting treatment observations to municipalities with some land reform; and (d) restricting treatment observations to municipalities with more than 5% of land reformed.
The second subfigure in the first row shows that municipalities within the land reform zone are worse off in the municipal ranking of well-being. Municipalities between 10 km and 20 km from the land reform boundary rank about 500 spots lower in position. This difference diminishes to just less than 400 spots lower by 30 km and then creeps toward 200 spots lower and becomes statistically indistinguishable from zero beyond that.
Figure 6 Part B demonstrates the discontinuity in development outcomes at the boundary differently. It presents simple discontinuity graphs using linear regression fittings. Consistent with Part A, the Part B subfigure on the left demonstrates a substantial jump in social and material vulnerability when moving from just outside the land reform zone (left-hand side) to just inside the zone (right-hand side). The right-hand subfigure indicates a negative jump in the positional index of vulnerability, again consistent with Part A.
Parts C–D of Figure 6 take into account differences in reform intensity. If the argument regarding the developmental effects of land reform holds, then the estimated effects should be stronger when comparing municipalities that had more intense land reform within the land reform zone to control municipalities.
Part C repeats the same analysis as in Part A but restricts the treatment sample to municipalities where there was at least some land reform. Land reform did not occur in every municipality within the land reform zone. As anticipated, the results strengthen. The social and material vulnerability index is about 0.4 points higher in zonal municipalities from 10 km to 20 km from the boundary. This is half a standard deviation of this variable. The effect declines toward an estimated 0.3 points higher within 30 km from the boundary. And the effect is statistically significant at the 95% level to about 35 km. The positional index of vulnerability in part C of the figure is about 700 spots lower for municipalities in the land reform zone between 10 km and 20 km from the boundary. This is slightly more than half a standard deviation of this variable. The effect tapers toward 500 spots lower at 30 km from the boundary and the effect remains statistically significant until just past 35 km from the boundary.
Part D further restricts the sample of treatment municipalities to those with at least 5% of all land area redistributed (roughly the 40th percentile of this variable within the treatment zone). The results again strengthen. They are also similar using a 10% land reform threshold.
Placebo Tests
I ran placebo tests to examine if the results might be an artifact of the structure of the data. For instance, it could be that any border running north to south in this region would create the appearance of a discontinuity if municipalities become wealthier and more developed from west to east. I reran the analysis using fictitious “placebo” zonal boundaries at intervals of 1 km in either direction of the actual land reform zone border to investigate this possibility.
Appendix Figure A5 shows that artificial borders in other locations, especially those farther from the true border, yield statistically insignificant results. Results are statistically significant for the first several kilometers inside the land reform zonal boundary (where the bulk of “control” municipalities are still true controls) and then erode both substantively and in terms of statistical significance.
Mechanisms
Why did land reform in Italy hinder rather than support development in the long term? I examine three related and generalizable mechanisms: a slower transition out of agriculture, lower labor mobility, and an aging demographic.
Transition Out of Agriculture
Land reform hindered development in comparative terms by encouraging a disproportionately large share of the local population to work in agriculture. The local land reform boards in Italy spread out peasants across the land by assigning them to disparate and often isolated plots. This increased employment by granting land to abundant rural labor but also generated weak community formation and social ties (King, 1971, 374–379). Land access and farming put a floor under earnings for many land reform beneficiaries and provided newfound employment security, making agriculture a relatively attractive occupation. And for many peasants, receiving land was the embodiment of the long-awaited dream of becoming landowners and fueled aspirations for remaining on the land (e.g., Bonanno, 1988, 141).
But land reform beneficiaries typically only earned enough to survive rather than to thrive. This is partly because there were not strong economies of scale in the small-sized plots that beneficiaries received and infrastructure was often insufficient (Belotti, 1960; Fabiani, 1979). For instance, the average plot size granted per assignee in the Maremma was 8.9 hectares (see King, 1971, 377). This is one-half a standard deviation smaller than average farm size in the Maremma (12.8 hectares) according to the 1961 agricultural census. This made it hard for these farms to efficiently compete and to provide a generous income to beneficiaries, especially given that some farms supported large multigenerational families. Furthermore, many beneficiaries were not trained in important aspects of farming such as crop rotation, the use of fertilizers, and animal husbandry (King, 1971). The land reform boards provided limited help to overcome these barriers. Cooperatives filled this gap in part but were slow to start out and most weakened and eventually split up.
The result was that a disproportionate share of land reform beneficiaries and those that inherited the land remained in agriculture even though their small plots provided them with limited income. Meanwhile, Italy as a whole started in the mid-1950s to make a major shift away from agriculture toward industry and human capital-intensive jobs that underpinned more dynamic and high-paying labor markets. According to the 1951 census, 42% of the population was employed in agriculture and 32% was employed in industry. But several million farmers left the rural sector in the late 1950s–early 1960s alone to meet booming demand for industrial labor in the north. This exodus was particularly strong among family members of peasant proprietors and part-time rural laborers (Instituto Centrale di Statistica, 1967, 297); small landowners in the reform sector migrated at lower rates or did so seasonally to continue cultivating the land and maintain an economic backstop (McEntire, 1970, 38). 28
Rural emigration as a whole continued in subsequent decades. The share of the population employed in agriculture dropped to 5% by the 2000s and today over 70% of the population lives in urban areas. Agriculture wage growth lagged over this period. Workers in agriculture in Italy today earn the smallest annual income of any economic sector. Consequently, given how the country modernized, people who worked the land eventually started to fall behind, not in absolute terms but compared to others who invested in education and skills that would eventually compensate them better. Bonanno (1988, 142) concludes that the land reform contributed to this disparity: the small plots created “crystallized” a considerable labor force in agriculture, while their economic precarity enabled the industrial labor market to draw excess cheap labor from them as fluctuating demand required.
Part A of Figure 7 supports this mechanism. The left subfigure indicates a significantly higher share of the labor force working in agriculture in municipalities within the land reform zone compared to those just outside of it. Data on labor activity are from the 2011 census. The right subfigure indicates more land area in farms in the land reform zone. Farm area is measured in hectares with data from the 2010 agricultural census.
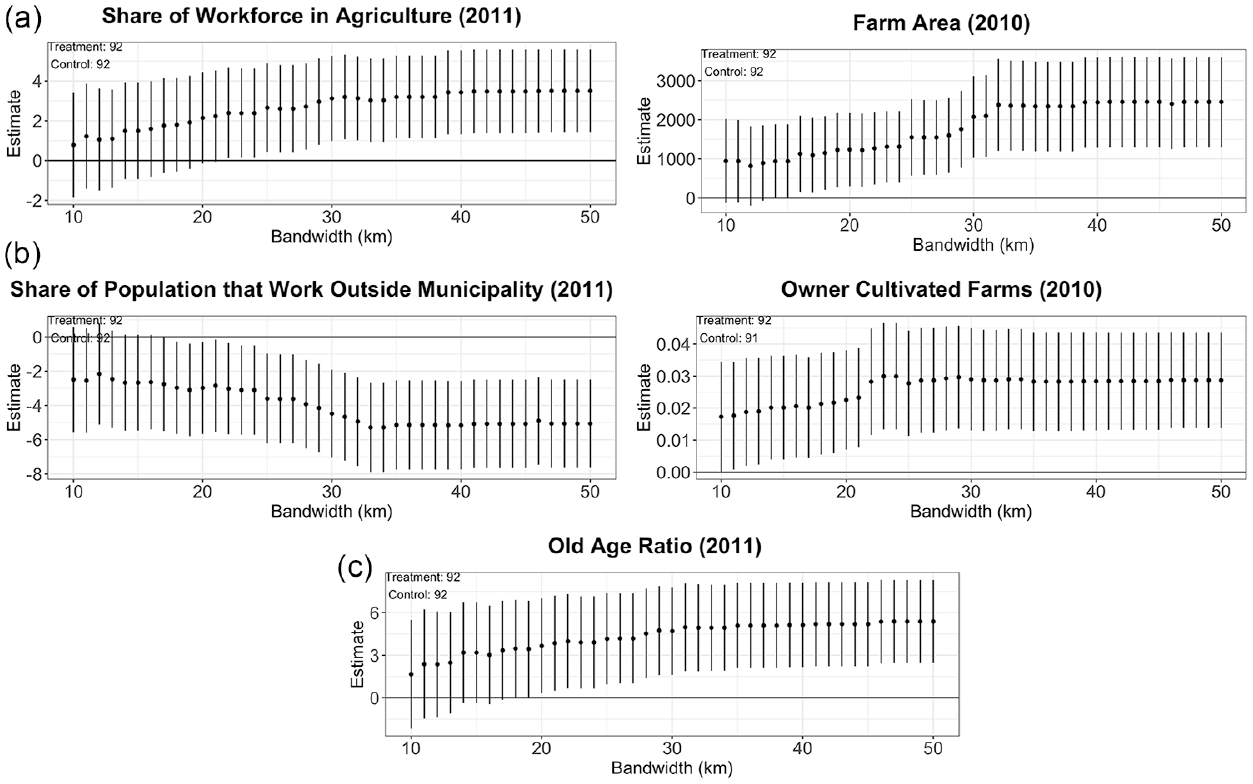
Mechanisms: (a) transition out of agriculture; (b) labor mobility; and (c) age demographics.
Labor Mobility
The second mechanism builds from the first and captures labor mobility. Land reform beneficiaries initially faced barriers to labor mobility. The first was linked to property rights. Land grants were tied to 30-year government loans that had to be repaid with interest before a beneficiary could alienate their land. Beneficiaries also had to join a cooperative. This encouraged land reform beneficiaries to retain their land and remain in the locales where that land was located. This was true even for land beneficiaries that received plots of land that were too small to produce enough to exclusively live on. Those that supplemented their income from small plots benefitted from retaining those plots and needed to live sufficiently close by to work on them since they could not initially sell them.
This labor immobility replicated itself over time to a degree for the generations that inherited the land. Families became more socially and economically embedded in agriculture over the decades and gained skills and knowledge suited to agriculture. This was not coercive. Receiving land shaped the dreams, aspirations, and work lives of beneficiaries as well as those of their children. For many, it promoted the desire to maintain tradition. 29 Local economies came to reflect these realities. Consequently, individuals decades later in land reform areas were relatively less likely to work outside their municipality of residence and more likely to remain working locally in agriculture. This limited their opportunities to narrower labor markets within their home municipality instead of broader regional labor markets that had more diverse employment and educational opportunities.
Part B of Figure 7 supports this discussion. The left subfigure indicates a lower share of the population working outside the municipality they reside in. Data on residence and working are from the 2011 census. The right subfigure indicates a higher share of farms cultivated by their owners as opposed to strictly workers or other entities such as companies with larger holdings. 30 Data are from the 2010 agricultural census.
Age Demographics
A third mechanism runs through age demographics. The first two mechanisms indicate that individuals in land reform zones were comparatively more likely to work locally and remain in agriculture over time. But recall that plots of land received through the land reform were relatively small. If the income received through farming these plots was meager for the first generation of beneficiaries, splitting the land up among heirs would further dilute its value. Consequently, there was a divergence in families over time. Some individuals inherited the land and chose to retain and work it. But without enough land to go around, others within these families often migrated to nearby towns, larger cities, or abroad to seek other opportunities. 31
The result was that the bulk of young people left land reform areas and the age pyramid narrowed locally. King (1971, 381–382) succinctly summarizes: “most of the potentially surplus young males have found employment in the expanding industrial centres . . . Now there is just one son ready to take over the podere. Many reform units, peopled only by old people, have become residential units . . .”
This generated less local economic dynamism over time by removing young talent and innovation locally. It also meant that young people were not around to support the elderly, making health and well-being in old age more precarious. The consequence was aging and more stagnant local populations.
Part C of Figure 7 supports this mechanism. It indicates a higher old age ratio in municipalities within the land reform zone compared to those just outside of it. Data on age demographics are from the 2011 census.
Evolution of Mechanisms Over Time
The mechanisms outlined above suggest generational effects that should have operated over decades in land reform areas rather than immediately or recently. The effects should have evolved fairly smoothly over time, stacking up to create the divergence in development outcomes. Figure A6 in the Appendix confirms this gradual but consistent evolution using decadal census data on the share of the workforce in agriculture, the share of the population that works outside its municipality of residence, and the old age ratio. 32
Alternative Explanations
There are several potential alternative explanations that, if confirmed, would undermine the main finding that land reform had a negative effect on long-term development. The first is that fiscal transfers from the central government that occurred coterminously with land reform had distortionary economic effects. The second is that residual large landholding through legal exemptions and surviving brokerage networks may have driven underdevelopment. The third is that land reform occurred to a greater extent at the outskirts of urban peripheries or where agriculture was not dominant and that changing dynamics in other economic sectors aside from agriculture drove long-term development. A fourth is that expropriated landowners invested more in industry just outside of the land reform zone if land reform reduced local labor availability and shifted local wages up.
Part II of the Appendix details the logic of each of these alternatives. Figure A8 provides empirical tests of each alternative. The results suggest that none of the alternative explanations drives the main findings. 33
Discussion: Italy’s Land Reform in Comparative Perspective
Using a unique design feature of Italy’s post-WWII land reform program that involved discontinuous program implementation across Italy’s territory, this paper finds that land reform delayed rather than advanced development over the course of decades in one of Italy’s largest land reform zones: the Maremma. It did so by slowing the transition out of agriculture, lowering labor mobility, and by triggering demographic changes that led to aging local populations and youth exodus. A number of observers anticipated some of these eventual consequences in other parts of Italy as well (Bonanno, 1988; Fabiani, 1979; King, 1971), and they are consistent with qualitative accounts from other regions on reform consequences such as the ones indicated previously.
It is worth underscoring, however, that the findings do not necessarily suggest that it would have been better for Italy as a whole to leave rural relations in the countryside entirely untouched. Given the setup of the empirical analysis, it cannot shed light on a counterfactual of what national-level development in Italy would have looked like in the absence of any land reform. Land reform may have contributed in certain ways to national development while leaving the locales where it was implemented most heavily behind. For instance, many expropriated landowners used their compensation to invest in industrial expansion (Bonanno, 1988), and the reform spurred demand for building materials and agricultural machinery (Belotti, 1960).
But the analysis does show that land reform that tackled large land ownership directly in some areas ended up generating social and economic stagnation vis-à-vis similar neighboring areas that did not undergo land reform. As Italy modernized, especially in the north, land reform modified the local effects of development and the reaction to the major northern economic pull. This backdrop of a modernizing and urbanizing national economy is a common backdrop to many countries that implement land reform.
The top-level findings echo to a certain degree some of the early concerns that economists and social reformers in the late 19th and early 20th century in Europe expressed about the adverse economic consequences of land reform, particularly as implemented through redistribution to smallholders. Many, in tune with selective aspects of Marxist thought, viewed agricultural smallholders as individualistic—economically self-concerned, socially attentive to their families rather than broader society, and unpracticed in modern production methods—and smallholding agriculture as unviable in the long run. 34 Others, like Polanyi (1944), believed that smallholding agriculture could not survive the onslaught of economic volatility associated with market capitalism.
The conclusion—though hotly debated—was that land reform should be done in a manner that preserved economies of scale in agriculture and protected against dispossession; many ideologues also believed reform should be used to forge social and economic bonds among the working class. Still others advocated using the agricultural sector mainly to support industrialization and modernization; to the extent that land reform to smallholders would delay urbanization, disrupt agricultural surplus, and undermine investment in technological advancement, it would hamper rather than advance long-run development.
While the findings here do not support a disdainful view of smallholders as perversely self-absorbed, they do suggest that the development consequences of land reforms can be limited or even negative. This is consistent with recent and emerging empirical scholarship that draws on fine-grained land transfer data. For instance, Albertus (2021) finds that districts in Peru that experienced greater land reform under military rule later suffered higher rates of poverty and lower human development. And Brooke and Koehler-Derrick (2020) find that land reform in Egypt under Nasser fueled long-term poverty among recipient families.
But to what extent are these outcomes elsewhere due to other policies coterminous with land reform, such as heavy state control and manipulation of land reform beneficiaries? After all, the governments that implement redistributive land reform frequently force land beneficiaries into cooperatives or collectives to facilitate rural control, maintain economies of scale in agriculture, and extract rural surplus (Albertus, 2021). This occurred in both Peru and Egypt. These same policies reached their authoritarian apex—and eventually suffocated the rural sector—in reformist socialist and communist countries in Eastern Europe, the Soviet Union, and China that had ideologically opposed smallholding.
Other cases suggest that this explanation is insufficient in itself. For example, Mendola and Simtowe (2015) find mixed effects of land transfers on the well-being of land beneficiaries in Malawi. Malawi’s land reform began contemporaneously with the introduction of democracy and with assistance from the World Bank—circumstances not dissimilar to Italy’s reform. And in the United States, land allocation to smallholders through the Homestead Act is estimated to have suppressed long-term economic development locally by slowing the transition out of agriculture (Mattheis & Raz, 2019).
The case of Italy’s Maremma region is interesting because land reform resulted in an economic drag in a context where land reform beneficiaries were granted individual property rights, albeit with some consequential encumbrances. So why did it not trace the trajectory of post-reform cases like Japan, South Korea, and Taiwan? Land reform beneficiaries in those cases became owners of highly productive small plots (often farming rice) and received exceptionally generous agricultural inputs and credits over years. Land quality and state support of beneficiaries in Italy was more akin to the land reforms in interwar Europe that granted individual property rights: Estonia, Latvia, Lithuania, and Czechoslovakia. Of course, however, World War II and its aftermath dramatically interrupted the rural development trajectories of each of these countries.
The findings hold important implications for countries that today are conducting land reform and—consistent with current development thinking—are granting property rights to individual smallholder beneficiaries in order to advance rural social and economic opportunities and redress historical injustices linked to land appropriation. Examples include Brazil, Colombia, the Philippines, and South Africa. These countries may eventually struggle with similar long-term rural development problems in their reform sectors that Italy has faced unless they provide beneficiaries with sufficiently large grants of productive land and considerable support at least until beneficiaries begin to thrive. They should also be attentive to specific encumbrances to property rights in order to balance the goals of supporting the autonomy of beneficiaries while also encouraging a stable and viable rural sector in which land beneficiaries do not immediately exit out of choice or necessity.
Supplemental Material
sj-pdf-1-cps-10.1177_00104140221089653 – Supplemental material for The Persistence of Rural Underdevelopment: Evidence from Land Reform in Italy
Supplemental material, sj-pdf-1-cps-10.1177_00104140221089653 for The Persistence of Rural Underdevelopment: Evidence from Land Reform in Italy by Michael Albertus in Comparative Political Studies
Footnotes
Acknowledgements
I thank Maria Carreri, Alexandra Cirone, John Duggan, Anderson Frey, Bethany Lacina, Alex Lee, Isabela Mares, Shivaji Mukherjee, Ana de la O, Jack Paine, David Samuels, Henry Thomson, Martha Wilfhart, and Elisabeth Wood for helpful comments. Glauco Grestini, Aldo Paparo, and Giorgia Ramazzotti provided valuable assistance with gathering data on land reform and zonal boundaries at the Archivio Centrale dello Stato in Rome in June 2018. I also benefitted from conversations with officials at the Lazio archives in Rome and at the Bank of Italy. Dean Arnold and Nick Tallant provided excellent research assistance, especially with reconstructing historical administrative divisions and building maps. Maura Cremin and Emily Salamanca provided assistance with locating archives and conducting historical research. I thank Bruno Caprettini, Lorenzo Casaburi, Pablo Martinelli, and Miriam Venturini for generously sharing data.
Declaration of Conflicting Interests
The author(s) declared no potential conflicts of interest with respect to the research, authorship, and/or publication of this article.
Funding
The author(s) disclosed receipt of the following financial support for the research, authorship, and/or publication of this article: This article was supported by University of Chicago Center for International Social Science Research.

Supplemental Material
Supplemental material for this article is available online.
Notes
Author Biography
References
Supplementary Material
Please find the following supplemental material available below.
For Open Access articles published under a Creative Commons License, all supplemental material carries the same license as the article it is associated with.
For non-Open Access articles published, all supplemental material carries a non-exclusive license, and permission requests for re-use of supplemental material or any part of supplemental material shall be sent directly to the copyright owner as specified in the copyright notice associated with the article.
