
Abstract
The present study describes the development and initial validation of the Multidimensional Sense of Emptiness Scale, a measure based on a theoretically and empirically grounded conceptualization of emptiness. In the first sample (n = 541), an exploratory factor analysis yielded three factors, Sense of Inner Emptiness, Sense of Absence of Relatedness, and Sense of Meaninglessness, explaining 82.8% of the variance with 13 items. In an additional sample (n = 212), a confirmatory factor analysis supported this three-factorial solution's stability. Furthermore, all subscales were significantly related to a single, second-order factor. In the total sample (N = 753), subscale and full-scale items offered evidence of satisfactory internal consistency and convergent validity. We discuss study limitations and implications for counseling practice, advocacy, education, training, and research.
This research explores the state of emptiness to understand the feelings and core markers associated with this experience and develop a self-report instrument to measure this construct. In this study, we define emptiness as a sense of disconnection from the emotional, existential, and relational spheres of experience. This article introduces a new survey-based measure of emptiness entitled the Multidimensional Sense of Emptiness Scale, including three components: Sense of Inner Emptiness, Sense of Meaninglessness, and Sense of Absence of Relatedness.Significance of the Scholarship to the Public
In recent years, the construct of emptiness has received renewed attention and legitimacy, perhaps due to its relationship with a wide range of mental health concerns (Elsner et al., 2018; Miller et al., 2020; Peteet, 2011). The Diagnostic and Statistical Manual of Mental Disorders Fifth Edition (American Psychiatric Association [APA], 2013) and the Tenth Revision of the Mental and Behavioral Disorders chapter of the International Statistical Classification of Diseases and Related Health Problems (World Health Organization [WHO], 2016) include emptiness as a diagnostic criterion for several mental health problems, including major depressive disorder (e.g., feeling empty, feelings of emptiness) and borderline personality disorder (chronic feelings of emptiness; APA, 2013). Researchers have also demonstrated the detrimental impact of emptiness, connecting it to various mental health conditions, including bulimia nervosa (Meehan, 2007), persistent complex bereavement disorder (Parkes, 2001), alcohol, drug, and sex addictions (Roos et al., 2015), dissociation, nonsuicidal self-injury (Rallis et al., 2012), and adverse childhood experiences (Buggs, 1996). However, emptiness is mostly related to suicide (Segal-Engelchin et al., 2015) and considered one of the most substantial factors in suicidal ideation and behaviors (Blascallo-Fontecilla et al., 2013; Chia et al., 2008; Klonsky, 2008).
Despite the relationship of emptiness with various mental health concerns, counseling practitioners still need a clear and consistent understanding and assessment of this phenomenon (Klonsky, 2008; Peteet, 2011). Conceptualization of this concept warrants additional delineation because the nature of the term emptiness is blurred (Elsner et al., 2018) and resembles similar emotional states, such as boredom, numbness, loneliness, and hopelessness. However, emptiness does not overlap with these constructs (Hazell, 2003; Klonsky, 2008) due to “a profound lack of emotional depth or sense of not being in the experience” (Miller et al., 2020, p. 2). Blasco-Fontecilla et al. (2013) indicated the absence of an up-to-date, standardized, and comprehensive measure and a theoretically grounded definition of emptiness on which such a measure could be based. Therefore, they called attention to developing a psychometrically sound method to assess the levels of emptiness efficaciously. Although there are two existing instruments designed to measure emptiness, they have deficiencies based on their theoretical foundations, the clarity and readability of their items, the samples in which they were developed, and evidence supporting their validity. Consequently, a valid and reliable instrument for assessing emptiness is lacking (Blasco-Fontecilla et al., 2013; Elsner et al., 2018).
Current Assessment Tools and Their Limitations
The nature of emptiness may be elusive and difficult to express in technical language. Therefore, researchers have attempted to capture the aspects and identify discrete factors of this concept. Hazell (1984) made the initial attempt by developing the Experienced Level of Emptiness Scale with a sample of 270 college students. The 17 scale items, which explained 60.3% of the variance, were generated based on unspecified existing theories of emptiness and interviews with nonclinical adults. Hazell reported a high Cronbach’s alpha (α = .91) and a strong relationship with depression in a subsample of 24 participants (r = .69).
Buggs (1996) made another attempt by developing the Emptiness Scale in a clinical sample of 201 participants, with 89.5% self-identified as White. This scale contains 28 items accounting for 60.2% of the variance. Buggs proposed a two-dimensional conceptualization of emptiness: (a) an inner sense of emotional hunger and yearning and (b) a generalized sense of emotional numbness. However, one major factor emerged from the principal component analysis (PCA), composed of 13 numbness items and nine emotional hunger and yearning items. The PCA failed to indicate two discrete and stable factors as initially proposed but instead supported a single major factor that accounted for 49% of the variance. Unexpectedly, explaining 11.2% of the variance, a smaller second factor with five items emerged from the analysis, which mentioned the connection to people, suggesting an aspect of emptiness involving the ability to relate to others.
Hazell (1984) and Buggs (1996) established an empirical foundation with their pioneering research exploring emptiness. However, the scales they developed are not without criticism. First, the conceptual clarity of emptiness in their studies is limited, since the researchers failed to present an explicit theoretical foundation and precise definition of this construct. Besides, the instruments included items related to depersonalization, numbness, boredom, and loneliness, suggesting that they are somewhat broad and lacking clear distinction from associated constructs. Although Hazell and Buggs identified different aspects of emptiness, such as an inner sense of hollowness, part of self-being missing, numbness, and hunger and yearning, they did not investigate other possible components, such as the lack of meaning and purpose or absence of relatedness to others (Miller et al., 2020; Peteet, 2011). Second, the clarity and readability of the instrument items constitute another limitation. For example, in the data collection process, Buggs asked participants to provide verbal and written comments after completing the questionnaire. The feedback suggested that the items were not easily understood. Third, the samples appear to be a source of limitation in these instrument development studies. They recruited less than 300 respondents; therefore, the sample size might be questionable for exploratory factor analysis (EFA;Tabachnick & Fidell, 2019). Additionally, the samples are limited due to the lack of diversity. In Buggs’s study, White participants constituted 90% of the sample, raising concerns regarding the generalizability of the results. In Hazell’s study, the participants’ race was not reported.
Lastly, Hazell (1984) and Buggs (1996) failed to provide sufficient validity evidence regarding the scales’ internal structure, since they conducted EFA to explore the scale factorial solution yet did not perform a confirmatory factor analysis (CFA) to verify the number of underlying latent variables and the pattern of observed variable-factor relationship (Brown, 2015). Moreover, to provide further validity evidence, Hazell examined the correlation of the Experienced Levels of Emptiness Scale (Hazell, 1984) with the Costello-Comrey Depression Scale (Costello & Comrey, 1967) in a small subsample of the study (n = 24), and Buggs investigated the relationship of emptiness with childhood abuse via a self-generated questionnaire rather than using a validated instrument, thereby limiting the validity evidence regarding relations to other variables. In sum, prevailing emptiness measures are limited in their comprehensive assessment of this experience, item clarity, samples, and construct validity evidence.
Conceptual Framework
Considering the existing literature, presenting a fundamental definition representing emptiness in a universal sense seems challenging because scholars use this phenomenon to describe a subjective experience unique to individuals based on underlying psychodynamics. In addition to a comprehensive review of theories, conceptual studies, and empirical research on emptiness, we investigated the overlapping aspects of this construct that supported an inclusive multidimensional theoretical model. In this framework, emptiness is conceptualized as a sense of detachment from the intrapersonal, existential, interpersonal, and spiritual domains of experience as inferred from the extant literature (Blasco-Fontecilla et al., 2013; Buggs, 1996; Peteet, 2011), including four distinct perspectives: (a) a sense of inner emptiness, (b) a sense of meaninglessness, (c) a sense of absence of relatedness, and (d) a sense of spiritual emptiness.
Frankl (1984) posited that emptiness consists of two states: a sense of inner emptiness and meaninglessness. In this study, the term sense of inner emptiness represents the emotional aspect of emptiness and refers to a sense of internal hollowness, difficulty identifying inner feelings, being out of touch with the inner self, inner void, a part being missing, and emotional hunger and yearning for something to fill the void. The term sense of meaninglessness, the existential perspective of emptiness, refers to a sense of lacking meaning, purpose, and a clear direction in life and perceiving life as meaningless.
Cushman (1990) defined emptiness as lacking community, a tradition, and shared meaning from the social perspective. Frankl (1969) also supported the interpersonal aspect of emptiness by describing this state as a sense of longing to be connected to others. Considering these approaches to emptiness, the authors have coined the term sense of absence of relatedness. The sense of absence of relatedness represents a lack of shared meaning in community and capacity for emotional closeness in social relationships. Lastly, the sense of spiritual emptiness refers to the detachment from nature, the universe, and a higher power. There is also a sense of abandonment by the higher power and the inability to find a deep inner sense of harmony and strength in spirituality (Arndt et al., 2013).
In a phenomenological study, Dunn (1994) explored the psychological emptiness in religious women’s lives and revealed three themes along with subthemes. These themes include (a) breakdown of the traditional structure of spiritual life, representing the loss of meaning and uncertainty about new forms of spiritual life, referring to both existential and spiritual aspects of emptiness; (b) a struggle with intimacy, referring to an inability to develop intimate relationships and a sense of disconnection from others; and (c) a core-self psychological emptiness, referring to the fragmentation of the self and a sense of having no feelings inside. This qualitative inquiry supports the four-dimensional structure of emptiness, which constituted the conceptual framework for the present scale development study.
Links of Emptiness to Suicide Risk, Hope, and Presence of Life Meaning
Emptiness, conceptualized as a sense of detachment from the lived experience, has been associated with various psychological constructs, yet mostly with suicide risk (Blasko-Fontecilla et al., 2013; Klonsky, 2008; Segal-Engelchin et al., 2015). Suicide remains among the most tragic consequences of psychological pain, accounting for 1.6% of all deaths worldwide and making it the second among persons aged 15 to 24 years old, an age group typically inclusive of high school through college students (Drapeau & McIntosh, 2020). Researchers have traditionally focused on identifying potential risk factors for suicide. In multiple qualitative studies, emptiness appeared to be an essential element of individuals who attempt or die by suicide (Chia et al., 2008; Segal-Engelchin et al., 2015). For example, a study analyzing 398 Singaporean suicide letters’ content illustrated emptiness as the second most frequent emotional factor expressed for suicide (25%), following despondency/agony (60%; Chi et al., 2008). These results together indicate emptiness as a factor contributing to the risk of suicide.
Furthermore, the empirical inquiry regarding the relationship of emptiness with positive psychology constructs, including hope and meaning in life, has received less interest in the field, even though researchers have addressed their association conceptually. Cheng et al. (2013) characterized emptiness as a loss of hope, meaning, and purpose in life, suggesting the presence of hope and meaning in life as buffers against this experience. Frankl (1984) has received credit for the emergence of meaning as an essential psychological construct (Steger et al., 2006). Frankl delineated a search for meaning as the primary motivation and stated that the failure in finding a significant meaning in life could result in meaninglessness and inner emptiness.
The Present Study
The purpose of this research was to address a significant gap in the existing instruments assessing emptiness by creating a reliable and valid multidimensional measure encompassing aspects of emptiness, including a sense of inner emptiness, meaninglessness, absence of relatedness, and spiritual emptiness. To accomplish this goal, using a more practitioner-friendly vocabulary, we engaged in the initial development and validation of a measure, named Multidimensional Sense of Emptiness Scale (MSES) in the general population, which would allow the use of this instrument for research, assessment, and screening purposes. The present study also examined the relationship of the MSES with the Suicide Probability Scale (SPS; Cull & Gill, 2002), the Adult Hope Scale (AHS; Snyder et al., 1991), and the Meaning in Life Questionnaire–Presence Subscale (MLQ-PS; Steger et al., 2006) to establish convergent validity evidence by determining the direction and degree of the relationships among these instruments. As such, in this study, we were guided by the following hypotheses:
Hypothesis 1: We anticipate that the MSES will have a multidimensional structure with items that describe the following four components: a sense of inner emptiness, meaninglessness, absence of relatedness, and spiritual emptiness.
Hypothesis 2: The MSES and its subscales’ scores will demonstrate internal consistency reliability.
Hypothesis 3: As evidence of convergent validity, the scores on the MSES and its subscales will exhibit a positive correlation with the SPS (Cull & Gill, 2002) and negatively correlate with the AHS (Snyder et al., 1991) and the MLQ-PS (Steger et al., 2006).
Method
Participants
In the first study pool, participants were 541 college students (321 women, 59.3%; 220 men, 40.7%) at a medium-sized four-year university in the Central Southern region of the United States. Participants ranged in age from 18 to 59 years old with a mean age of 22.82 years (SD = 6.63). In terms of race, participants identified as Latinx (n = 241; 44.5%), White (n = 196; 36.2%), Asian American (n = 28; 5.2%), African American (n = 26; 4.8%), Native American (n = 6; 1.1%), Pacific Islander (n = 3; 0.6%), along with biracial (n = 34; 6.3%) and other (n = 7; 1.3%). In addition to the demographic information, participants’ suicide attempt history was gathered to further describe the study sample. Of 541 participants, 83 (15.3%) reported a history of suicide attempts ranging from one attempt to eight attempts.
In the second study pool, participants were 212 college students (124 women, 58.5%; 88 men, 41.5%) with an age range from 18 to 49 years old with a mean age of 21.52 years (SD = 5.64). In terms of race, participants identified as White (n = 85; 40.1%), Latinx (n = 73; 34.4%), Asian American (n = 17; 8.1%), African American (n = 14; 6.6%), Native American (n = 2; 0.9 %), Pacific Islander (n = 2; 0.9%) along with biracial (n = 13; 6.1%) and other (n = 6; 2.8%). In addition, 38 of 212 participants (17.9%) reported a history of suicide attempts ranging from one to three attempts.
Measures
Suicide Probability Scale
The SPS (Cull & Gill, 2002) is a 36-item self-report measure designed to assess suicide risk in adolescents and adults. Individuals are asked to rate the frequency of their subjective experience and past behaviors using a 4-point Likert-type scale ranging from 1 (none or little of the time) to 4 (most or all of the time). Responses are summed to evaluate both general and specific suicide risk along with four key dimensions, including suicidal ideation, hopelessness, negative self-evaluation, and hostility. Cull and Gill (2002) provided support for the concurrent validity of the SPS with the Minnesota Multiphasic Personality Inventory (MMPI) and evidence for the criterion-related validity demonstrated by the scale's ability to discriminate between criterion groups of nonclinical participants, psychiatric inpatients, and individuals with a history of a suicide attempt. Cull and Gill also reported a high test–retest reliability (α = .92 over a 3-week period and α = .94 over a 10-day period) and internal consistency reliability for the full scale (α = .93). Similarly, our sample’s SPS ratings yielded an alpha coefficient in the excellent range (α = .91). The internal consistency coefficients for the subscales were .62 for Negative Self-Evaluation, .78 for Hostility, .80 for Hopelessness, and .89 for Suicide Ideation (Cull & Gill, 2002).
Adult Hope Scale
Researchers developed the AHS (Snyder et al., 1991) to assess individuals’ level of hope based on goal-oriented thinking, including two dimensions: (a) Pathways and (b) Agency. Each subscale consists of four items with four remaining fillers. This 12-item instrument utilizes an 8-point Likert-type scale, having responses ranging from 1 (definitely false) to 8 (definitely true). This measure yields a minimum score of 8 and a maximum score of 64, with higher scores representing a greater level of hope. As evidence for the convergent validity, the AHS has been correlated positively with the Life Orientation Test (r = .60), the Self Esteem Scale (r = .45), and Positive Affect Schedule (r = .53) and correlated negatively with several scales measures concepts that are antithetical to hope, including hopelessness, depression, and suicidal ideation (Edwards et al., 2007). In college samples, the test–retest reliability of the AHS was .85 over a 3-week period. The overall AHS has demonstrated sound internal reliability, with Cronbach alphas ranging from .74 to .88 (Snyder et al., 1991). Both subscales have shown adequate internal reliability. Cronbach alphas have ranged from .70 to .84 for the Agency subscale and from .63 to .86 for the Pathways subscale (Snyder et al., 1991). In this study, the Cronbach’s alpha coefficients were .81 for the Pathways subscale, .79 for the Agency subscale, and .83 for the overall scale.
Meaning in Life Questionnaire–Presence Subscale
The MLQ-PS (Steger et al., 2006) is a 5-item, self-report inventory developed to measure the extent to which individuals feel that their lives are significant, are purposeful, and subjectively make sense to them (Steger et al., 2006). Sample items from the MLQ-PS include “My life has a clear sense of purpose” and “I have a good sense of what makes my life meaningful.” Participants use a 7-point Likert-type scale ranging from 1 (absolutely true) to 7 (absolutely untrue). Users calculate a total score of the MLQ-PS by summing all items in the inventory with higher scores indicating a high level of meaning in life. The MLQ-PS was positively correlated with the measures assessing life satisfaction, positive emotions, intrinsic religiosity, extraversion and negatively correlated with depression, negative emotions, and neuroticism (Steger et al., 2006). The MLQ-PS has good internal consistency (α = .82 to .86) and test–retest reliability over a 1-month interval (α = .70). In the current study, the Cronbach alpha was .95 for the MLQ-PS.
Procedure
Initial Item-Pool Development
Following best practices for item generation in scale development (Worthington & Whittaker, 2006), we used a four-step sequential mixed-method approach (Ermis-Demirtas, 2018) to generate an initial item pool and to establish content-related evidence for the instrument. These four phases included (a) creation of an initial draft of the MSES, (b) selection of a panel of experts to evaluate the MSES, (c) a qualitative review of the MSES, and (d) a quantitative review of the MSES (Ermis-Demirtas, 2018). We conducted a thorough review of the professional literature on emptiness to identify components of this construct and develop the initial item pool during the first step. This in-depth and comprehensive review and analysis of the extant literature included theoretical, empirical, and clinical issues on emptiness, such as conceptual articles, qualitative and quantitative studies, clinical notes, and preexisting measures of emptiness. Using Frankl's (1984) perspective as the theoretical base, we defined emptiness as a multidimensional construct, encompassing emotional, existential, relational, and spiritual domains, and identified core features representing these domains. Using the guidelines for optimal item construction (Kline, 2005), we translated the essential markers of emptiness into questionnaire statements (e.g., “There is a great void in my life which I cannot stand.”) and generated an initial pool of 57 items that spread across the emptiness spheres, including (a) the sense of inner emptiness, (b) the sense of meaninglessness, (c) the sense of absence of relatedness, and (d) the sense of spiritual emptiness. As suggested by Józsa and Morgan (2017), we also included a few reversed items considering the advantages, such as encouraging participants to read all the items carefully and improving the instrument validity.
After constructing the initial item pool, we set out to create the format for the instrument. We selected a 5-point Likert-type scale response set with values ranging from 1 (none or little of the time true of me) to 5 (most or all of the time true of me) as a combination of reflection and frequency response anchors to allow individuals to express how much they agree or disagree with a particular statement (Wu & Leung, 2017). We also avoided using the midpoint categories such as “I do not know” or “undecided” to obtain higher data accuracy and forgo participant indecisiveness (DeVellis, 2016). Directions for the instrument instructed participants to determine how often each statement describing their feeling, perception, or behavior was true for them over the past year based on their subjective experiences.
Our second step was to identify and contact content experts and request them to review the instrument’s initial draft. We contacted a total of 15 experts, eight of them volunteered to serve as a reviewer. Out of eight content experts, we recruited six from counseling, one from clinical psychology, and one from psychiatry. Each panel member had an established reputation as a scholar in their field, worked as a full-time professor, and had clinical experience ranging from approximately 15 to 30 years. Further, six out of eight reviewers had experience with instrument development germane to mental health. Regarding the specialization of the content reviewers in emptiness, two experts were identified to have either doctoral dissertations or peer-reviewed articles in international journals related to the topic.
For the third phase, we dispatched a qualitative assessment packet, including the instrument and the instructions. We requested experts to provide feedback on the instrument’s content, organization, existing questions, and administration process. The review of the experts’ feedback resulted in revising 23 items, adding four items, and dropping nine items from the instrument draft (52 items in total). During the last phase, we shared a quantitative assessment packet with the reviewers and requested them to rate each item’s appropriateness for the instrument based on a 3-point response set with 1 indicating essential, 2 useful but not essential, and 3 not necessary. We employed Lawshe's (1975) technique as a relatively straightforward quantitative approach to content validity (Ermis-Demirtas, 2018). After receiving the experts’ ratings, we calculated the content validity ratio (CVR) value for each item using the CVR formula (Ne − N/2)/(N/2), in which the Ne is the number of reviewers indicating essential, and N is the total number of reviewers. Using the Lawshe’s table (1975), we determined the CVRcritical value to be .75 since the judging panel constituted eight content reviewers. The items with the CVR values exceeding the CVRcritical value of .75 remained in the final instrument. The last step in establishing content-related evidence was to compute the CVI value within the retained 39 items. Researchers found that the 39-item instrument’s CVI value was .89, considered adequate based on recommendations (CVI > .80; Ermis-Demirtas, 2018).
Participant Recruitment
Participants for this study were recruited from undergraduate courses offered in a range of majors at a Hispanic-serving institution in the Central Southern United States. Upon obtaining permission from the department chairs, program coordinators, and course instructors, the primary researcher in this study attended classes and presented the study to the potential participants. Volunteer students willing to participate in this research were disseminated a survey packet, including the MSES, a demographic questionnaire, three other instruments, and provided time to complete the surveys in class.
Data Analysis
Statistical Power Analysis
We conducted a statistical power analysis to identify the required sample size for running factor analysis based on a ratio of 10 participants-to-item, n/p ≥ 10 (Mvududu & Sink, 2013). Further, scholars suggested a sample size greater than 300 for performing EFA and 200 for CFA as appropriate (Brown, 2015; Tabachnick & Fidell (2019). Following these guidelines, the sample sizes are considered adequate to conduct EFA (n = 541, p = 39 > 13) and CFA (n = 212, p = 13 > 16).
Preliminary Analysis
We followed two steps to clean the data. First, we screened the data for missing cases and determined that the data were missing at random and ignorable (e.g., less than 5%; Brown, 2015). Because of the minimal amount of missing data, we determined listwise deletion at the first step, following the best practices to conduct EFA and CFA. This process resulted in removing 27 cases (3.59%) from the initial data (n = 780) due to the extensive participant noncompletion (more than 20% of the items were unanswered; Parent, 2013). The remaining missing cases constituted 0.13% of the overall data and 0.2% of the MSES (n = 753; less than 5%; Eekhout et al., 2014). The MCAR test was nonsignificant (p = .807). Thus, the next step was to impute this small percentage of missing values using the series mean function in SPSS.
Next, we assessed intercorrelations among 39 items to determine whether any items in the scale were highly correlated with one another to eliminate redundancy (Watson, 2017). We made the decision to delete the items using two well-recognized criteria. First, we used the correlation matrix among items to check the pattern of relationships. The intercorrelation matrix for most items was greater than .2, indicating reasonable factorability (Watson, 2017). Second, we checked the correlation coefficients between items and the correlation matrix’s determinant to test multicollinearity. Most of the correlation coefficients were lower than .9, and the determinant value was .002, suggesting that multicollinearity was not an issue (Tabachnick & Fidell, 2019). Furthermore, we tested data for univariate and multivariate normality using the critical cut-off value of 2.0 for skewness and 7.0 for kurtosis (Brown, 2015). All items had values less than 2.0 for skewness and kurtosis, indicating that the data were normally distributed.
Results
Evidence Regarding Internal Structure
Exploratory Factor Analysis
Following the methodological literature, we first analyzed data from 541 college students using the Kaiser-Meyer-Olkin (KMO) measure of sampling adequacy and Bartlett’s test of sphericity to determine the suitability of the sample for factor analysis. Results suggested a meritorious level of homogeneity (KMO = .96) and were significant for Bartlett’s test of sphericity, χ2(n = 541, 190) = 18075.255, p < .001, indicating the data appropriate for factor analysis procedures. Once data were deemed appropriate for analysis, the PAF procedure with a Promax rotation was applied to extract factors from the data (Mvududu & Sink, 2013; Tabachnick & Fidell, 2019). To determine the exact number of factors to extract, we used the following criteria: (a) factors with eigenvalues greater than 1.0, (b) visual analysis of the scree plot, (c) parallel analysis, and (d) the conceptual meaningfulness of the factors (Watson, 2017). Using the extraction criteria, we initially retained four factors that accounted for 75.4% of the variance for the entire set of variables. The scree plot test also confirmed the four-factor solution. In addition to PAF and scree plot, we also conducted a parallel analysis in which the eigenvalues for the actual data were compared to eigenvalues generated from a random data set of like size (Watson, 2017). We utilized the rawpar.script to run parallel analysis in SPSS using PAF for normally distributed random data generation with a 95% confidence level. Four factors were significant because the eigenvalues generated from the actual data were greater than the eigenvalues from the random data. Noticing consistent results across the methods, we decided to retain four factors initially.
Pattern Matrix for the Three-Factor Solution
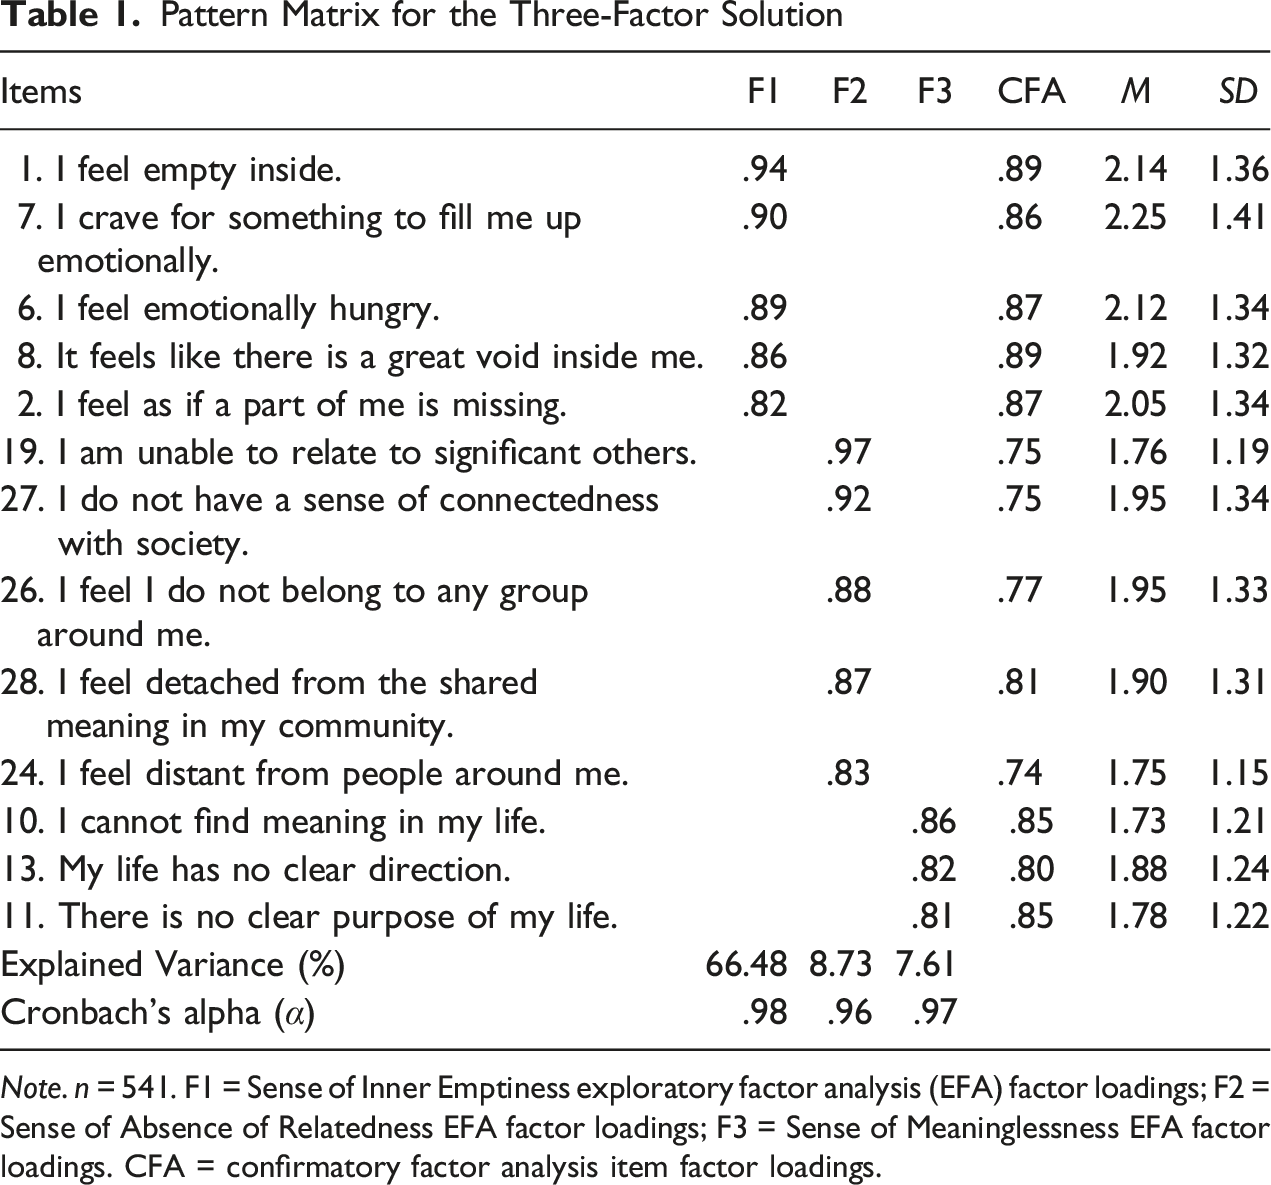
Note. n = 541. F1 = Sense of Inner Emptiness exploratory factor analysis (EFA) factor loadings; F2 = Sense of Absence of Relatedness EFA factor loadings; F3 = Sense of Meaninglessness EFA factor loadings. CFA = confirmatory factor analysis item factor loadings.
Confirmatory Factor Analysis
After EFA, we conducted a series of CFA in the second sample (n = 212) to verify the number of underlying latent variables and the pattern of observed variable-factor relationship (Brown, 2015). Due to the intercorrelations among three factors extracted from EFA (r > .33; Brown, 2015), we evaluated three primary models to examine the underlying structure of emptiness and compare the model fit. These structures included (a) a three-factor first-order correlated model corresponding to the SIE, SAR, and SM (Figure 1, Model A), (b) a higher-order three-factor model corresponding to the SIE, SAR, and SM as the first-order factors and the Sense of Emptiness as the second-order factor (Figure 1, Model B), and (c) a bifactor model. Compared Confirmatory Factor Analysis Models of the MSES.
To measure the degree of fit, we used fit indices including the chi-square statistics, standardized root mean residual (SRMR), goodness of fit index (GFI), comparative fit index (CFI), Tucker-Lewis index (TLI), and the root mean square error of approximation (RMSEA) metrics of model fit. To evaluate and compare model fit, we used the following cut-off criteria for a strong model fit, including χ2/df < 2, SRMR < .05, GFI > .95, CFI > .95, TLI > .95, and RMSEA < .06 and the benchmarks for an adequate model fit, including χ2/df < 5, SRMR < .08, GFI > .90, CFI > .90, TLI > .90, and RMSEA < .08 (Brown, 2015).
Fit Indexes from the Confirmatory Factor Analyses with the MSES Data
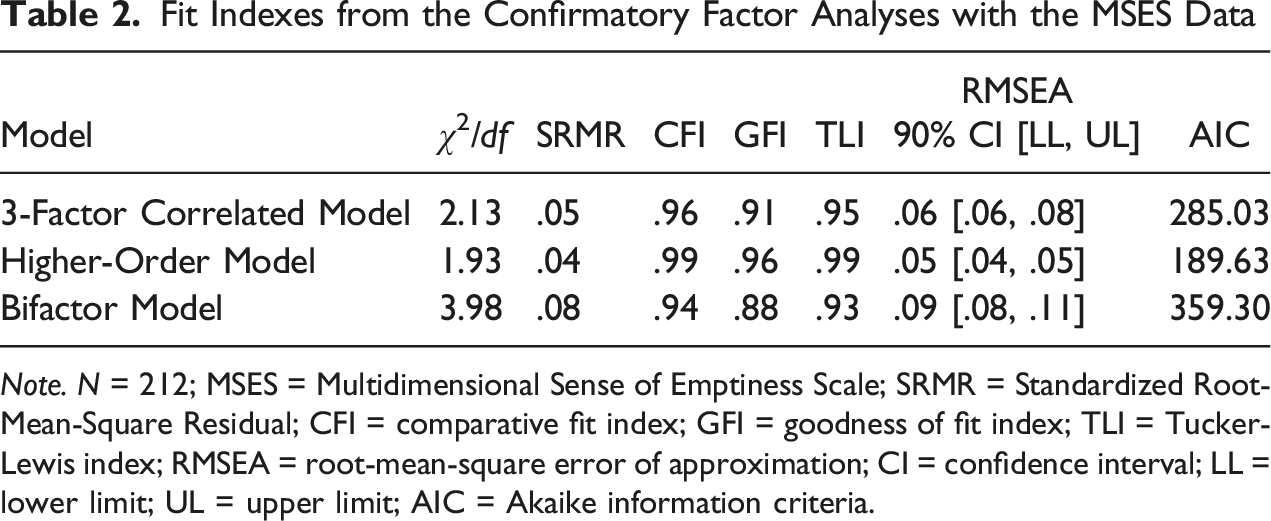
Note. N = 212; MSES = Multidimensional Sense of Emptiness Scale; SRMR = Standardized Root-Mean-Square Residual; CFI = comparative fit index; GFI = goodness of fit index; TLI = Tucker-Lewis index; RMSEA = root-mean-square error of approximation; CI = confidence interval; LL = lower limit; UL = upper limit; AIC = Akaike information criteria.
Evidence Regarding Internal Consistency Reliability
We calculated internal consistency reliability coefficients for the total scale and three subscales using Cronbach’s alpha with an α of .70 or higher as a standard (DeVellis, 2016). The reliability estimate for the 13-item total scale was .97 (n = 753), indicating strong reliability. The reliability estimates for the subscales were .98 for the five-item SIE, .96 for the five-item SAR, and .97 for the three-item SM. These values also indicated high internal consistency reliability evidence for scores obtained from these three subscales (α > .70).
Evidence Regarding Relations to Other Variables
Descriptive Statistics and Bivariate Correlations for Scores on the MSES and its Components
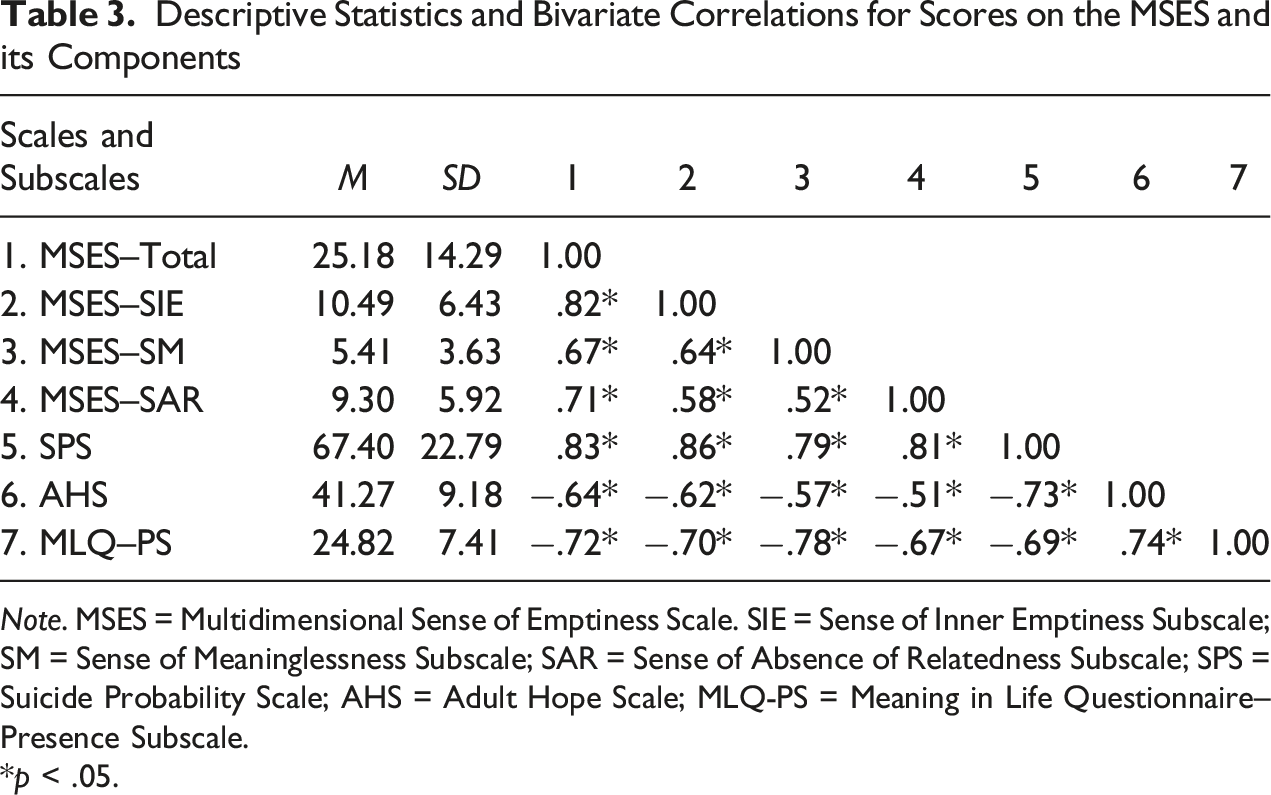
Note. MSES = Multidimensional Sense of Emptiness Scale. SIE = Sense of Inner Emptiness Subscale; SM = Sense of Meaninglessness Subscale; SAR = Sense of Absence of Relatedness Subscale; SPS = Suicide Probability Scale; AHS = Adult Hope Scale; MLQ-PS = Meaning in Life Questionnaire–Presence Subscale.
*p < .05.
Discussion
Although historically, emptiness has received little consideration in the counseling literature relative to other types of negative experience, there is growing interest in studying emptiness, especially concerning suicide risk. Perhaps more crucially, there is an increasing need to understand this prevalent and often detrimental experience. Moreover, the evaluation of the appropriate factor structure of emptiness has critical assessment and conceptual implications. In light of growing need and interest in studying emptiness, applying Frankl’s conceptualization as a theoretical base, we aimed to develop and validate a new instrument, the MSES. Using a more practitioner-friendly vocabulary, we designed the MSES to measure emptiness in the general population for counseling research and practice purposes. To achieve this goal, we first explored the factorial structure of the emerging instrument within a sample of 541 undergraduate students. The EFA resulted in the emergence of three distinct but significantly correlated factors with 13 items: (a) SIE, (b) SAR, and (c) SM. These conceptually meaningful factors accounted for 82.8% of the variance. Although we anticipated a four-factor structure with four corresponding subscales, including the Sense of Spiritual Emptiness as an additional separate dimension, the EFA solution did not support this conceptual structure. Frankl’s conceptualization of emptiness focused on the intrapersonal and existential aspects of this concept yet involved the interpersonal domain of emptiness. As an additional sphere, spiritual emptiness was included in the theoretical framework considering Dunn’s (1994) qualitative study findings. However, Dunn explored psychological emptiness among religious women, which may have limited the representation of this experience in the general population and resulted in the exclusion of spiritual emptiness from the final solution.
We then conducted CFA in an additional sample (n = 212) to test the emerged three-factorial solution. More specifically, because the three factors represent specific yet correlated aspects of emptiness, we evaluated three primary structures, including (a) a three-factor correlated model, (b) a higher-order three-factor model, and (c) a bifactor model. The study findings showed that the MSES data are best represented by a higher-order model with three components corresponding to the SIE, SAR, and SM as the first-order factors and the sense of emptiness as the single, second-order factor. These results also indicate that the total MSES score is meaningful. Because the second-order factor provides a statistically parsimonious explanation for the correlations among the first-order factors, these factors can be considered as specific components of a single, general construct of emptiness rather than separate constructs that are correlated with one another. The higher-order model was also theoretically preferred and chosen as the final structural model for the MSES.
Taken together, the SIE factor consists of five items. The statements related to this factor collectively describe the intrapersonal aspect of emptiness, such as feelings of emotional hunger, a part of self being missing, unbearable inner void, and emotional yearning to fill that void. The SAR factor also includes five items. This factor describes the interpersonal manifestations of emptiness that refer to feeling detached from the people, society, and shared meaning in the community. The SM factor contains three items. This factor depicts the existential aspect, encompassing the lack of meaning, purpose, and life direction. For the 13-item MSES, the total score ranges from 13 to 65, with higher scores indicating greater levels of emptiness. The scores for the subscales range from 5 to 25 for the SIE and the SAR and 3 to 15 for the SM.
Our next step was to examine the internal consistency reliability coefficients of the MSES and the emergent factors. Reliability estimates of .97, .98, .96, and .97 for the MSES as well as for the SIE, SAR, and SM, respectively, exceeded standard conventions where values above .70 are viewed acceptable (DeVellis, 2016) and suitable for assessment applications (Bardhoshi & Erford, 2017). These reliability estimates on the MSES and its factors offer a degree of consistency and precision, which might support its use for reliable assessment of emptiness in both counseling research and practice.
For our final step in the validation process, we examined convergent validity by correlating scores on the MSES and its subscales with the existing instruments designed to assess similar constructs. Participant scores on the MSES and its subscales correlated with the Suicide Probability Scale (Cull & Gill, 2002). This outcome seems consistent with the previous findings, indicating emptiness as a significant marker of suicidal outcomes (Blascallo-Fontecilla et al., 2013; Segal-Engelchin et al., 2015). To provide further convergent validity evidence, we tested the relationship of the MSES and its subscales with the existing measures of hope and presence of meaning in life. As predicted, the MSES total score and its subscale scores were significantly correlated with the AHS (Snyder et al., 1991) and the MLQ-PS (Steger et al., 2006), which seems consistent with the literature (Cheng et al., 2013; Frankl, 1984). These results altogether provide support for the convergent validity of the MSES.
Limitations
There are a few limitations of the MSES that readers should note. First, we conducted this scale development and validation study to measure emptiness with a young, fairly educated adult sample, which limits the representation of the general population. Thus, researchers should be cautious when using the MSES in populations with different characteristics. Moreover, most participants were self-identified as Latinx and White, limiting the study’s generalizability across various ethnicities and cultural backgrounds. Future research could examine the MSES’s validity in different samples, including ethnically diverse and clinical populations. Further, this study was an initial investigation of the MSES’s psychometric properties; therefore, the findings merit further inquiry. In assessing various psychological emptiness domains, initial items were developed based on a four-dimensional conceptualization of this construct, which might constitute another limitation. Besides, the MSES items excluded from the final instrument may also represent emptiness areas that cannot be measured by items retained within the assessment. Lastly, many empirical studies that rely on self-report measures are prone to the social desirability bias, and this study was no exception.
Future researchers may conduct follow-up studies addressing the limitations noted for this investigation, while also expanding on this study’s findings. Future research is needed to conduct a CFA analysis to test the higher-order structure of the MSES using various samples, including a clinical sample. The study could also be replicated to include a wider variety of individuals to address sampling limitations, as the factorial structure of this instrument was analyzed based on data obtained from a single sample of young, fairly educated adults. Future researchers may include an increased representation of diversity, including different ethnic identities and cultural backgrounds. Further research could expand the study by assessing the between-group factor structure of the MSES via measurement invariance testing to determine whether the MSES performs consistently across different samples (e.g., gender or mental disorder groups). Researchers might further explore the psychometric properties of the MSES to provide additional reliability and validity evidence for this measure. Test–retest reliability measures would be useful for further investigations of convergent validity with existing measures of emptiness and associated mental disorders, including depression and borderline personality disorder.
Implications for Practice, Advocacy, Education, Training, and Research
Despite the limitations of the MSES, the results derived from our psychometric evaluation can have implications for counseling practice, research, advocacy, and training. As a comprehensive measure of emptiness with promising validity and reliability evidence developed in a relatively larger sample with a reasonable diversity, counseling practitioners might use the 13-item three-factor MSES for assessment and screening purposes. Clinicians and trainees may consider using the subscales or the total score, given theoretical reasoning and empirical evidence, suggesting the higher-order model fits well with the MSES data. The use of the MSES might allow clinicians to conduct a comprehensive assessment and gain additional information about their clients (Peteet, 2011). Such information would be useful for counseling professionals to target the problem areas based on the subscales with the highest scores. Furthermore, the use of the MSES might help counselors to gain insight into the client’s perception of emptiness. The counselor–client interpretation of the scores can lead to rich dialogue in which both may gain insight into the client’s experiences. The results of this study were preliminary, pertinent to the psychometric evidence of the MSES, and this scale was developed within the general population. Therefore, we suggest using the MSES with caution in a clinical population as further evidence is needed to replicate this study on a sample of clients.
For the use of MSES in counseling research, the 13-item psychometrically sound, user-friendly, and theory-driven instrument might provide researchers with a promising assessment tool to measure emptiness and investigate the relationship with other psychological constructs. For example, the strong positive relationship identified between the MSES and the SPS might provide a basis to examine further the relationship between emptiness and suicidal ideation and behavior. Concerning the MSES scoring, researchers are advised to compute both the subscale scores and the total score for the interpretation purposes. The three-factor higher-order model’s validity tests suggest that the MSES subscales should not be avoided because they may provide additional information beyond the total score.
Lastly, as advocates for best practices in counseling, counselor educators and supervisors may help integrate the concept of emptiness into the counseling training programs to prepare better emerging professionals to work with clients experiencing emptiness. This could reduce the ambiguity in this area and enhance students’ confidence to work with such clients. Such integration may be achieved via case studies in which hypothetical clients with emptiness and a score on the MSES could be given to students to work on case conceptualization. Counseling students could also be educated on the MSES to use it for counseling screening and assessment purposes.
Taken together and given the growing body of literature linking emptiness with a range of mental health issues, the potential applications of an assessment tool measuring emptiness is evident. Thus, a well-grounded and psychometrically sound measure of emptiness will better allow for empirical investigations into the possible risk factors and outcomes associated with emptiness. This study involved the psychometric evaluation of the MSES as a theoretically and empirically grounded and comprehensive measure of emptiness, including such processes as writing and reviewing items, analyzing the factorial structure, evaluating the reliability of the MSES, and establishing convergent validity evidence. Although the validity and reliability evidence are preliminary, the conceptualization of emptiness, the development of MSES, and the conceptual clarity achieved through this study represent a valuable contribution to the counseling field. As a multidimensional and well-validated measure of emptiness, we hope that the MSES will serve as the basis for self-report assessment of emptiness and give rise to many useful applications in counseling research and practice, moving beyond the existing measures’ current limitations in content coverage and scale validation procedures.
Footnotes
Author Note
This study was funded by the Texas Counseling Association. We have no conflicts of interest to disclose.