
Abstract
This article examines the coverage of the National Incident-Based Reporting System (NIBRS) as of 2013. We use NIBRS, Uniform Crime Reports (UCR), and Supplementary Homicide Reports to assess the population coverage and index crime coverage of NIBRS. We also examine the correspondence of crime rates between the UCR and agencies that do and do not participate in NIBRS. We found that NIBRS covers 29.3% of the U.S. population and 28% of UCR index crimes. We also found that the crime rates in NIBRS jurisdictions are appreciably lower than jurisdictions that do not participate in NIBRS. As of 2013, therefore, NIBRS data are not representative of the U.S. population, crime counts, or crime rates.
Introduction
One of the most important functions of government is to compile and disseminate vital statistics concerning significant issues in the public interest. These data serve a variety of disciplines and multiple functions, from population counts to economic indicators to mortality measures to education statistics to crime measurement, just to name a few. Certainly, the need for precise and accurate indicators of the amount of criminal behavior across time and place is highly necessary. Without such crime measures, it would be difficult, if not impossible, to determine with required certainty the level of criminal activity in society and the effectiveness of crime prevention activities. In this regard, scholars and practitioners alike generally agree that adequate measures of crime are required not only for testing hypothesized relationships but also for the rational allocation of criminal justice resources. The audience for high-quality crime measurement includes all sectors of society: scholars, legislators, criminal justice agencies, the media, and the public. In contrast to today’s complex economic indicators such as employment rates, cost of living indexes, inflation rates, gross domestic productivity, and so on, the measurement of crime seems rudimentary and is surely deficient.
Uniform Crime Reports (UCR)
In the United States, there are two national-level, crime measurement systems: (a) Summary Reporting System (SRS) of the Uniform Crime Reports (UCR) and (b) National Crime Victimization Survey (Planty, Langton, & Barnett-Ryan, 2014; see also Federal Bureau of Investigation [FBI], UCR, n.d.). Here we are concerned only with the UCR. The UCR summary reporting system classifies criminal events in terms of two categories: Part I and Part II. The eight Part I offenses comprise what used to be called the “crime index” and consist of murder and nonnegligent manslaughter, rape, robbery, aggravated assault, burglary, larceny, vehicle theft, and arson. The UCR provides crime counts and crime rates across two categories: violent index and property index (total index crime rate was discontinued in 2004 in favor of separate rates for violent and property crimes). All other criminal offenses are contained in the Part II category. With few modifications, this reporting system has been the basis of the UCR since its inception in 1930. UCR data are reported annually in Crime in the United States (CIUS).
The Part I index offenses are tabulated as a crime index separately from the remaining “nonindex” offenses because these seven offense types (arson was not originally included) were generally thought to be more serious and therefore more likely to be reported to the police than were the less important nonindex crimes. Compared with other types of official criminal justice statistics, such as judicial and correctional data, police-recorded events are generally viewed as a better representation of the total amount of crime. Very soon after the UCR program was adopted, Sellin (1931) noted that “the value of a crime for index purposes decreases as the distance from the crime itself in terms of procedure increases” (p. 346). Despite their procedural propinquity to the event, official police data cannot reflect the amount of crime which is not reported to the police, or indicate the amount of bias which may be present due to administrative and/or discretionary practices of individual police officers or departments. Before national victimization surveys were developed, criminologists could only speculate about the amount of concordance between numbers of reported, unreported, or unrecorded crime. With continuing surveys of victims, the relationship between the amount of harm committed against a victim and the probability that a victim will report the incident can be roughly estimated and the adequacy of police data can be examined.
Although the UCR system seems reasonably capable of producing an index of crime, an index which details both the volume and seriousness of criminal behavior, the method used to classify and count offenses renders the system misleading if not erroneous in several respects. The literature contains excellent discussions from noted criminologists regarding the basis of the UCR classification system and the usefulness of the crime index produced (Cressey, 1957; Hindelang, 1974; Sellin & Wolfgang, 1964; Wilkins, 1965; Wolfgang, 1963). Thus, the following discussion is necessarily brief and highlights the more important shortcomings of the UCR system.
The UCR index system does not account for multiple offenses (i.e., a complex criminal event which comprises several distinct crimes). According to the hierarchy rule (except for incidents involving arson), only the crime that has the highest rank order in the list of ordered categories is counted. For example, an incident composed of a rape, an aggravated assault, and a robbery would be recorded for UCR purposes as only one crime—the rape—because rape has the highest rank order of the three crimes committed.
The classification of offenses according to the broad legal label ignores the fact that each legal label covers a variety of offenses that should not be equated. In any category, different degrees of harm occur with respect to the amount of theft or injury experienced by a victim. The UCR neither differentiates these various degrees of harm nor accounts for the seriousness of offenses within and across the legal categories. A robbery may be the armed holdup of one or more persons, infliction of serious harm, and theft of large sums of money. However, a robbery may also be a purse snatch with no physical harm, and owing to the absence of harm, it is classified as a larceny/theft even though the victim likely perceives of this crime as a robbery. The other index offenses are similarly affected by the broad continuum of behavior that is subsumed under each legal category.
The UCR generally does not differentiate between criminal events that are successful and those that are merely attempted. The UCR does capture attempts for rape and burglary but, for publication purposes, there is no differentiation. Equating attempted crimes with completed crimes misrepresents the amount of physical injury or property loss/damage incurred by the community.
Last, there is no weighting system in the compilation of the two index crime rates. For example, the UCR index gives equal weight to a robbery resulting in the victim’s hospitalization and to a robbery with little or no injury to the victim. Across offense categories, substantial differences in the extent of harm exist even though equal weight is given to all offenses. Clearly, a homicide results in far more harm to the victim than does an aggravated assault, but each receives the same weight in contributing to the overall UCR violent crime rate. Similarly, a burglary with substantial property damage and property stolen contributes the same to the property index rate as does a shoplifting offense.
Thus, the UCR methods of classifying and counting criminal offenses for the index purposes just described have two overriding deficiencies. First, by counting only one offense, when at least two are conjoined, and by using an arbitrary set of ordered categories, the UCR reporting system provides only a partial enumeration of the specific offenses actually known to the police, and thus, misleading data about the actual volume of criminal behavior. Second, by equating all offenses which carry the same generic legal label and by confounding completed and attempted acts, considerable differences in the degree of seriousness of various offenses are concealed. In other words, the UCR method provides no solution for the problem of how to deal statistically with a complex criminal event or with crimes that vary appreciably in seriousness but which carry the same legal title.
National Incident-Based Reporting System (NIBRS)
In the early 1980s, the FBI recognized this long-standing crime measurement system misrepresents and even masks the actual volume and seriousness of crime and realized that a UCR redesign effort was warranted which would capture both the quantitative and qualitative dimensions of criminal behavior. Therefore, the FBI, together with the Bureau of Justice Statistics (BJS), contracted with Abt Associates, Inc. to perform a multiphase evaluation of the UCR and propose a fundamental redesign. The first phase of the study examined the original UCR program as implemented in 1930, and the UCR program as currently administered. The second phase of the study examined potential enhancements to the UCR system and concluded with a set of recommended modifications presented in the final report, Blueprint for the Future of the Uniform Crime Reporting Program (Poggio, Kennedy, Chaiken, & Carlson, 1985). Essentially, the study recommended that the UCR be converted to a unit record system to replace the summary system of the UCR. The FBI and BJS used the recommendations to develop a new, revised system of crime data collection. This was initiated in 1988 (SEARCH, 1997). The ultimate result was the NIBRS.
NIBRS is an incident-based reporting system and can be thought of as an extension to the UCR. However, the data provided by NIBRS are far more detailed than the summary reporting system of the UCR. The UCR contains only summary data which only allow analysis of aggregate data. NIBRS allows for the detailed examination of incident-level crime data. Specifically, NIBRS data provide information on administrative, incident, property, victim, offender, and arrestee characteristics (FBI, NIBRS Overview). NIBRS contains data on each criminal incident within 23 offense categories that include 49 specific offenses. These crimes comprise Group A offenses, while Group B offenses comprise 10 additional offenses that only provide arrest data. These groups are somewhat similar to the UCR’s Part I and Part II crimes (FBI, NIBRS Quick Facts, n.d.-b; FBI, NIBRS Guide, n.d.-a). However, over time, NIBRS has expanded to include far more offense types in its reporting. In addition to data on incidents, offenses, victims, offenders, and arrestees, NIBRS contains expanded data concerning age, sex, and race of victims, offenders, arrestees, and data on circumstances and context for crimes like location, time of day, and whether the incident was cleared (FBI, NIBRS Guide, n.d.-a).
After a few years of development, the FBI conducted a pilot program for 7 months in South Carolina. After receiving feedback and further developing the instrument, the FBI began to collect crime data using NIBRS guidelines in 1989. However, it was not until 1991 that states began to meet certification standards to submit data to NIBRS. South Carolina was the first state. The initial year saw the participation of 663 law enforcement agencies, concentrated in just three states: Alabama, South Carolina, and North Dakota (Reaves, 1993). This first-year data represented only 3.3% coverage of the United States’s population, vastly inferior to the population coverage of the UCR.
Assessment of NIBRS
The present assessment of the extent to which NIBRS represents accurate coverage of crime in the United States is stimulated by three factors.
First, the Methods Overview of Easy Access to NIBRS Victims (EZANIBRS) indicates, In 2013, there were at least some law enforcement agencies in each of the 34 states and the District of Columbia that did not report their crime and arrest data to the NIBRS effort. While it is difficult to quantify the actual level of reporting, it is fair to say that in some States the level of reporting was over 75% while in other states it was far less. (Puzzanchera, Smith, & Kang, 2015, para. 1)
We thought it was important, therefore, to determine just how difficult it is to investigate NIBRS participation across all 50 states and the District of Columbia as well as determine coverage within the jurisdictions that do participate in NIBRS.
Second, the EZANIBRS public webpage raised several limitations concerning any interpretation of NIBRS analysis in light of the coverage situation:
Any state-specific analysis must not be considered an analysis of all incidents reported to law enforcement in the State, given that an unknown number of agencies did not report their data to NIBRS;
It cannot be assumed that crime data from agencies that reported to NIBRS have the same characteristics as those that did not report—implying that the patterns found in the reported data are not necessarily representative of the entire state; and
Given that the data from each State do not reflect all crimes reported to law enforcement and that those that are reported to NIBRS might not have the same attributes as the universe of crimes reported to law enforcement in the State, state-to-state comparisons are not recommended. (Puzzanchera et al., 2015)
We believe that these concerns can be addressed by a comprehensive assessment of NIBRS coverage across jurisdictions and the representativeness of the overall crime counts as well as the substantive utility of the expanded data provided through NIBRS.
Third, the FBI has indicated that increasing NIBRS participation is a high priority. The agency is partnering with the BJS on the National Crime Statistics Exchange, and working with advocacy groups to emphasize the importance of NIBRS data for the public and the law enforcement community. Most important, the FBI is planning to transition the UCR program to a NIBRS-only data collection by 2021 (FBI, NIBRS Overview, n.d.-c). The FBI’s vision for the NIBRS is that it should become the law enforcement community’s standard for quantifying crime, further supporting the mission of the FBI UCR Program to generate reliable information for use in law enforcement administration, operation, and management (FBI, NIBRS Overview).
These are worthwhile aspirations which would greatly benefit not only the law enforcement community but also the broader audience and consumers of national crime data. The FBI’s efforts would benefit from a comprehensive account of present NIBRS participation to show how far NIBRS has come and how much further must it expand.
Data
The present review of NIBRS uses data for 2013. We chose 2013 because we wanted the most recent NIBRS data available online (through EZANIBRS; Puzzanchera et al., 2015) so that other researchers can verify our findings or even perform state-specific analyses of their own to extend our results without having to download and analyze multiple data files. Thus, we used (a) EZANIBRS, 2013; (b) FBI, NIBRS (2013); (c) FBI, CIUS (2013); and (d) Easy Access to the FBI’s Supplementary Homicide Reports (SHR): 2013. All these data are readily available online and require minimal processing effort.
NIBRS Participation
The NIBRS system has been ongoing since 1991. As of 2013, 22 years later, what is the level of participation? Table 1 provides the answer to the question. There are 36 states that participate in NIBRS to some extent. The population of these 36 states according to the UCR data for 2013 is 184,335,402 people. The population covered by NIBRS amounts to 92,714,938 people, or a total coverage of 50.3%. The degree of population coverage across the states varies greatly. There are 16 states, generally with lower population, with greater than 90% coverage. Alternatively, there are nine states with coverage of 25% or lower and they are generally the more populous states. Table 2 shows that there are 14 states that do not participate in NIBRS. These states have a population of 131,793,437 people. In overall context, therefore, NIBRS covers 50.3% of the population of participating states but only 29.3% of the 316,128,839 people in the United States.
NIBRS Participation: 2013.
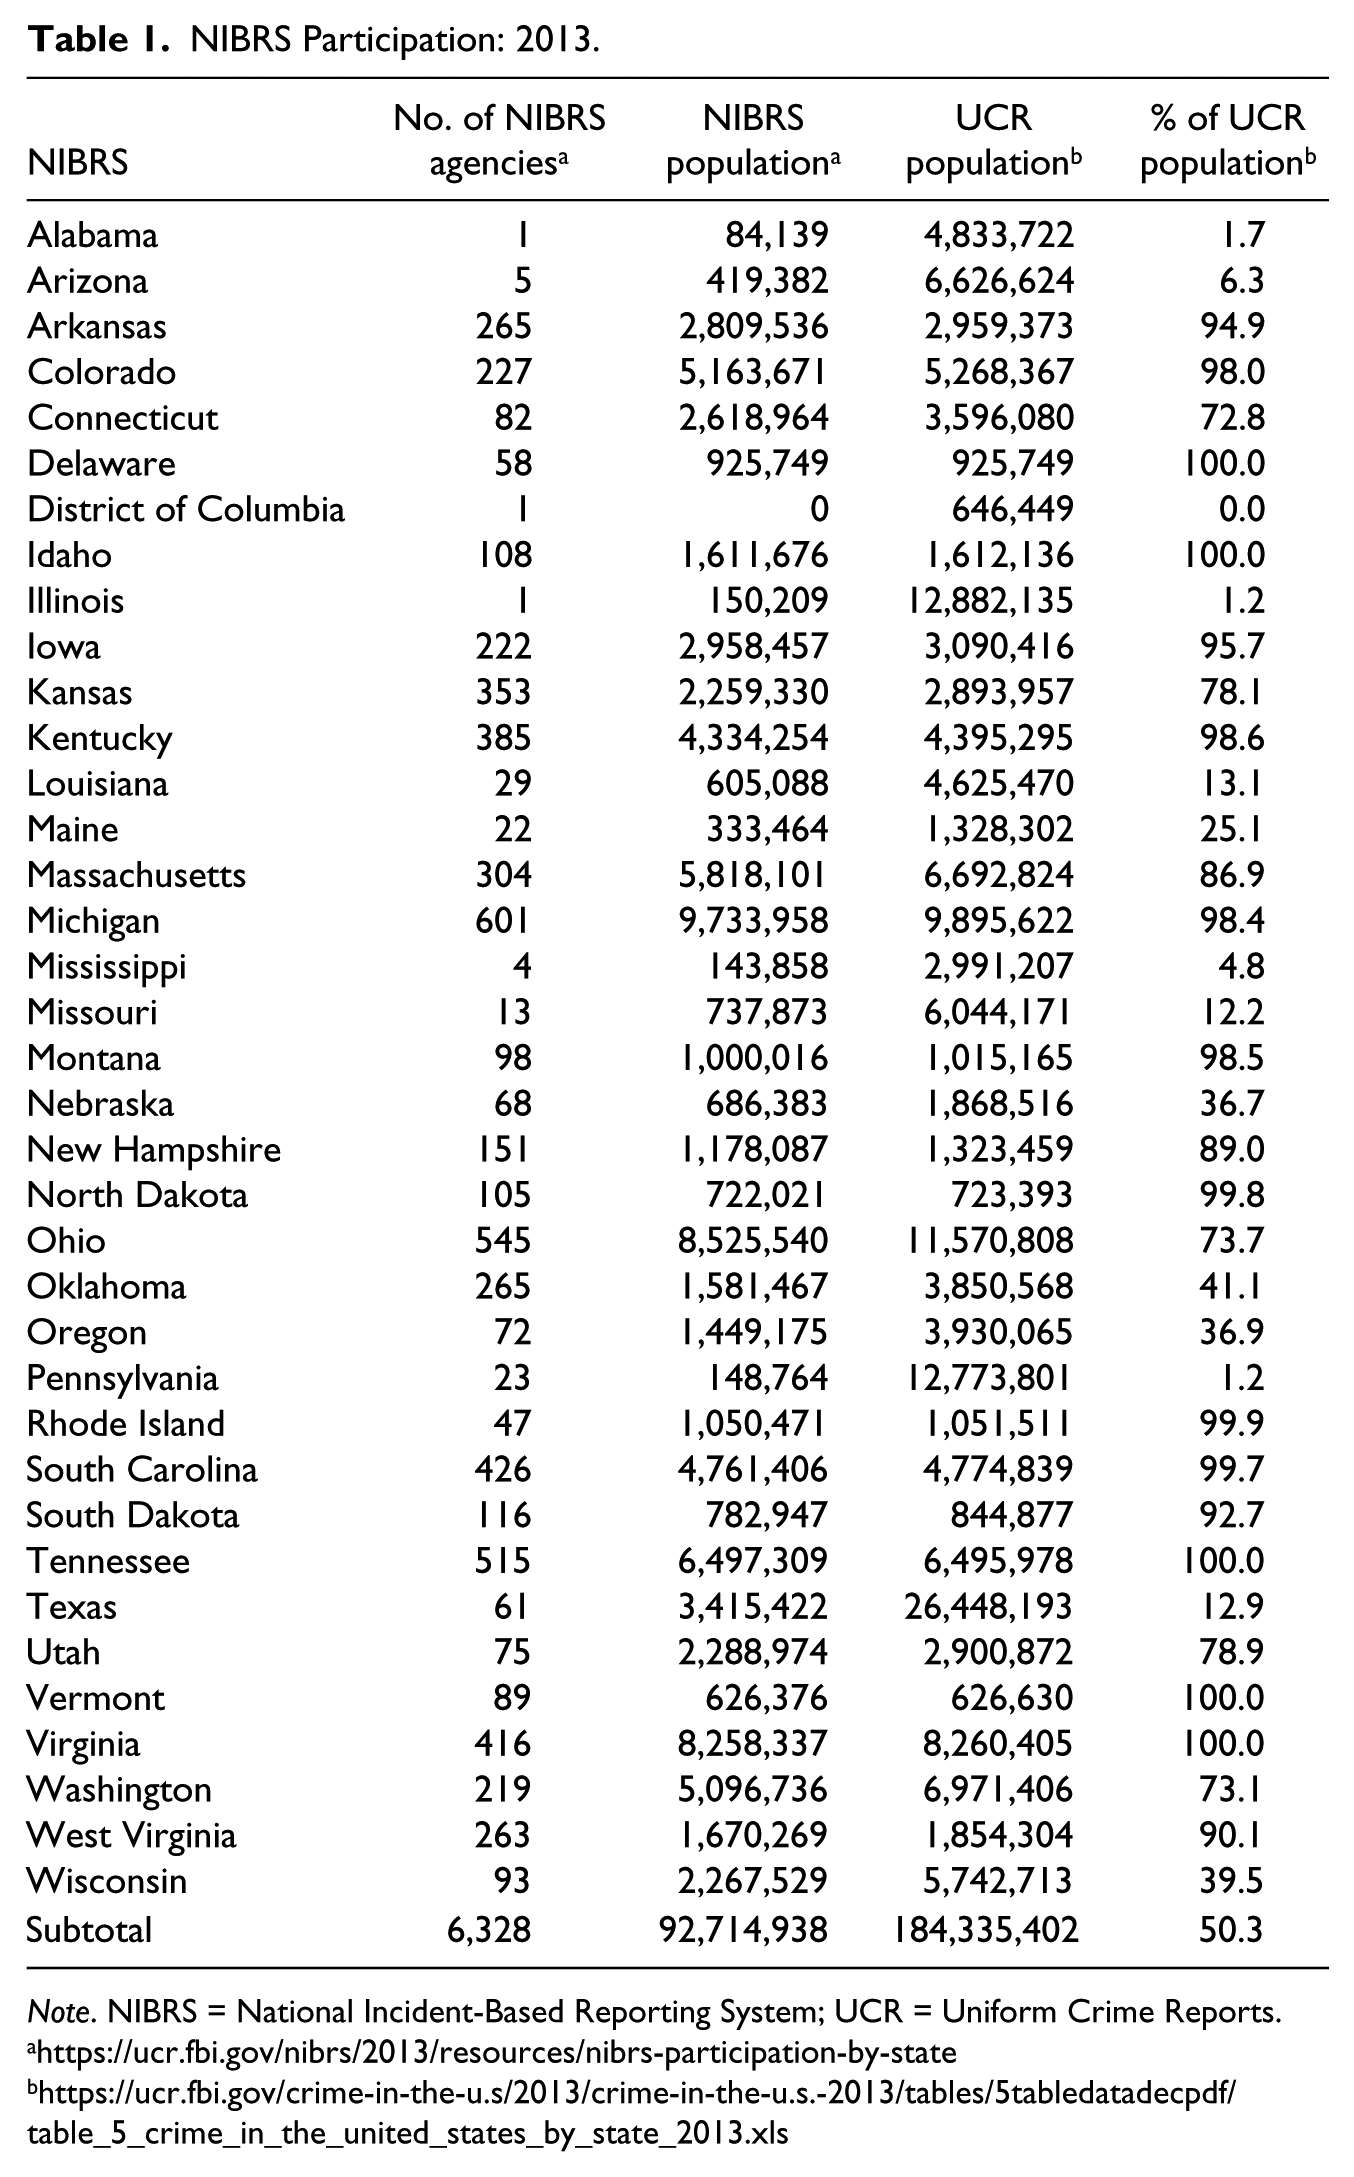
Note. NIBRS = National Incident-Based Reporting System; UCR = Uniform Crime Reports.
Population Data of Non-NIBRS Jurisdictions.

Note. NIBRS = National Incident-Based Reporting System.
Beyond population coverage, the more pertinent issue concerns the extent of NIBRS crime coverage in the participating states. Tables 3 and 4 provide these data. Table 3 indicates that the NIBRS jurisdictions comprise less than 50% of the violent index crimes (312,095 / 669,263 = 46.6%) and property index crimes (2,436,383 / 5,127,860 = 47.5%) committed in the 36 participating states and the District of Columbia. Moreover, compared with the eight states that comprised 25% of the population or lower, the data for index crimes show that the number has increased to 10 for violent crimes and 11 for property crimes for jurisdictions scoring at or below 25% coverage. Table 4 provides crime data for the 14 states that do not participate in NIBRS. There were 522,275 violent crimes and 3,505,002 property crimes.
NIBRS Jurisdictions: Index Crime Coverage.
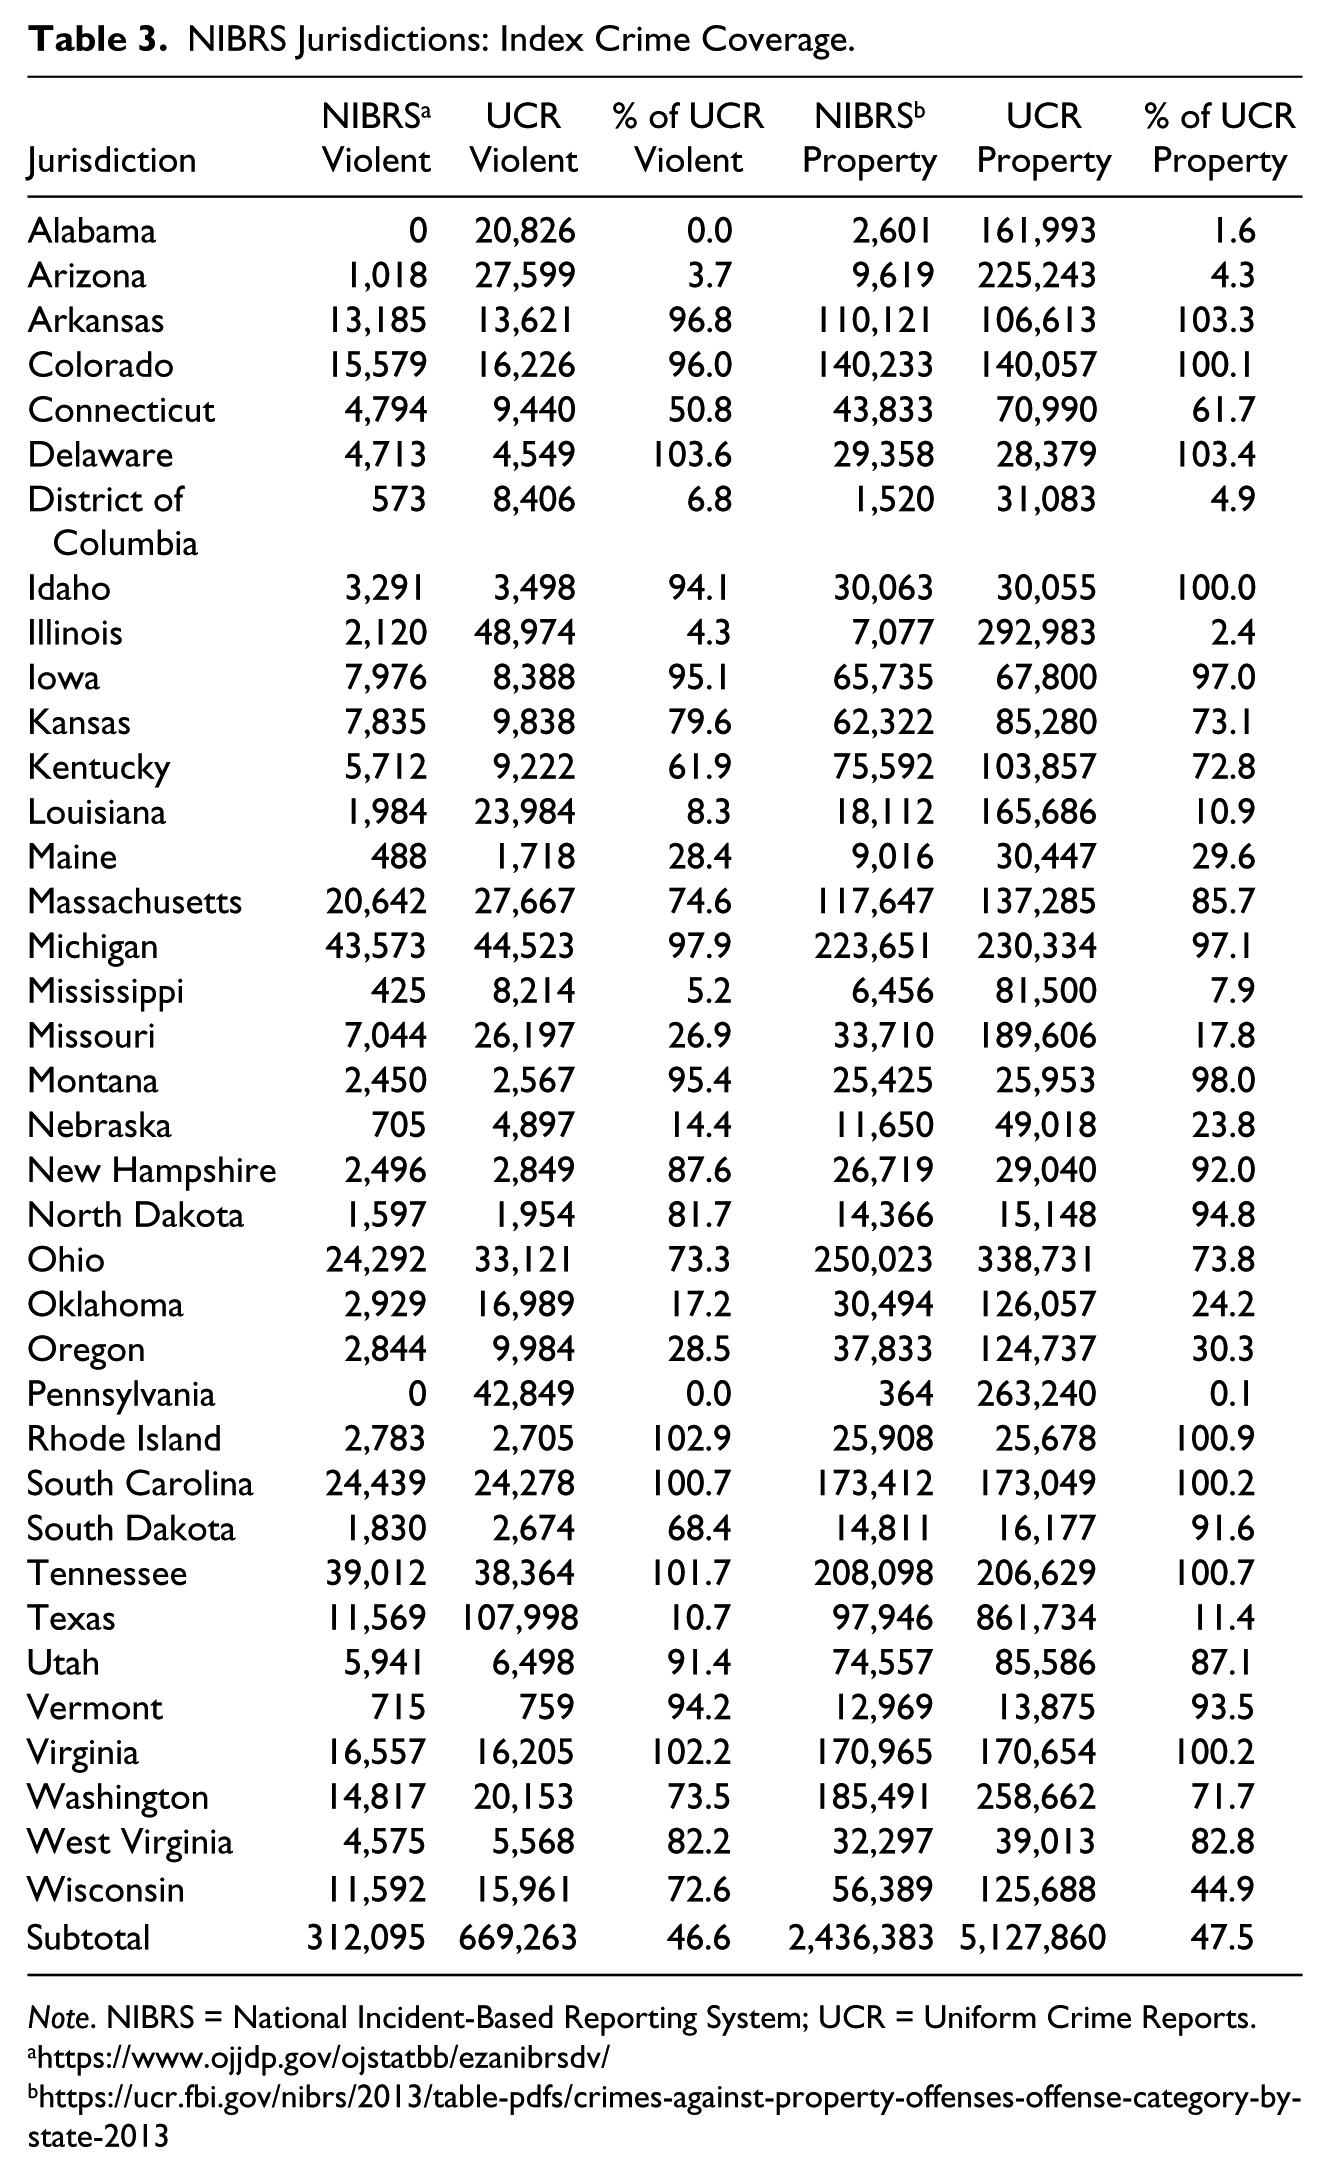
Note. NIBRS = National Incident-Based Reporting System; UCR = Uniform Crime Reports.
Index Crime Data: Non-NIBRS Jurisdictions.
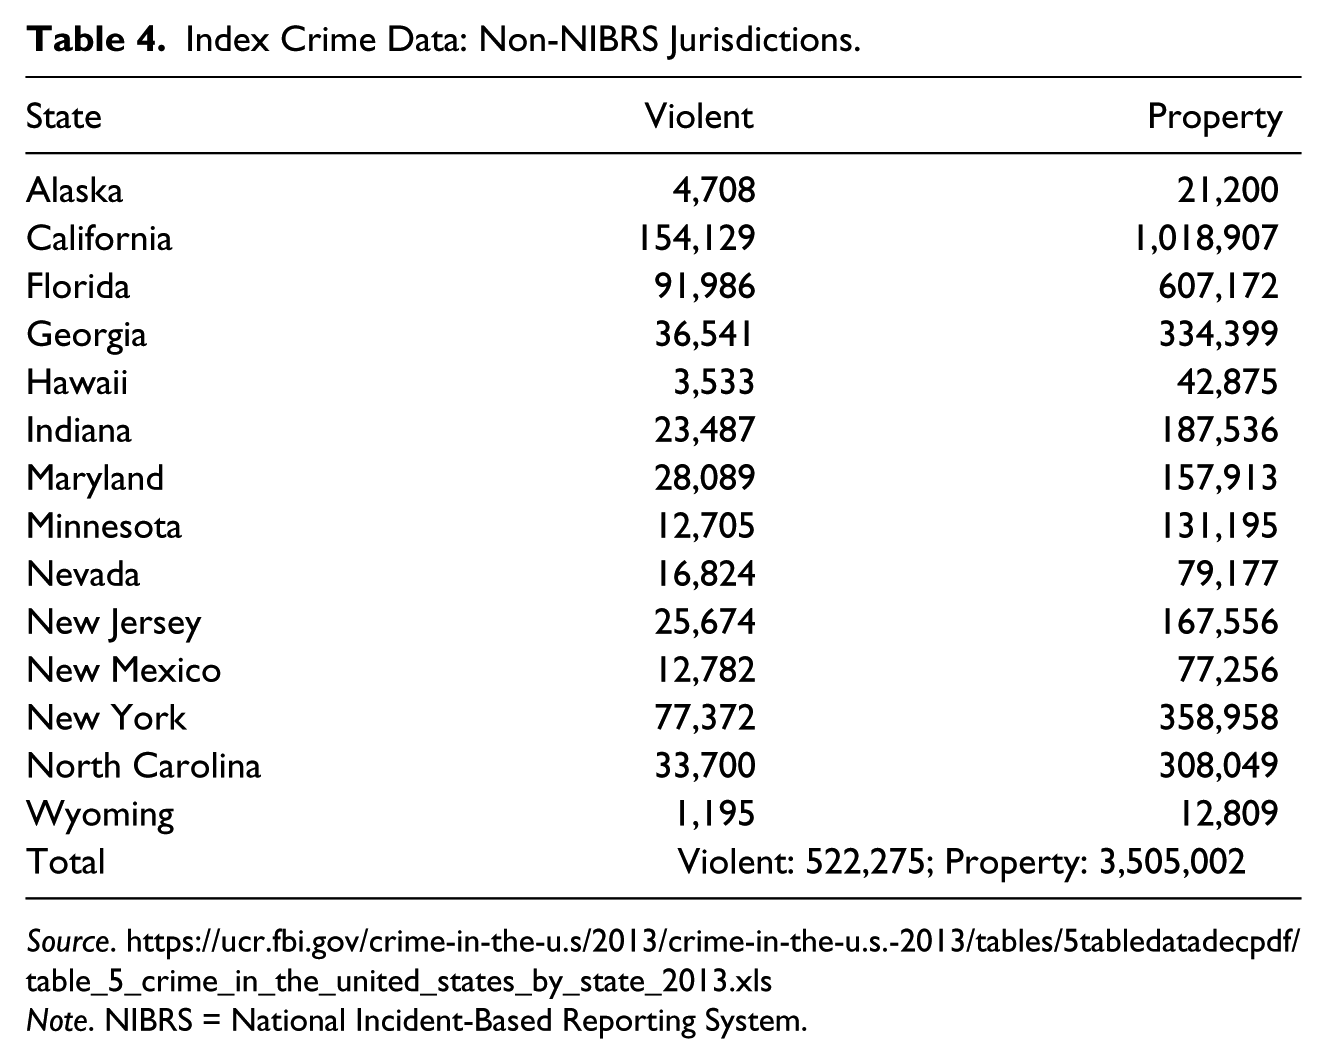
Note. NIBRS = National Incident-Based Reporting System.
When we combine the totals from the 36 NIBRS states, the District of Columbia, and the 14 states with no NIBRS participation, we find the following data (Table 5). In 2013, there were 312,095 violent index offenses in the NIBRS jurisdictions as compared with 1,191,988 violent index offenses across all of the United States. Thus, the NIBRS jurisdictions cover only 26.2% of these offenses. The situation for property index crimes shows a similar lack of coverage. There were 2,436,383 property index offenses in the NIBRS jurisdictions as compared with 8,632,862 property index offenses across all of the United States which represents a coverage of just 28.2% of these offenses. In terms of all UCR index offenses, NIBRS covers only 28% of UCR index crimes.
NIBRS Share of Index Crimes.
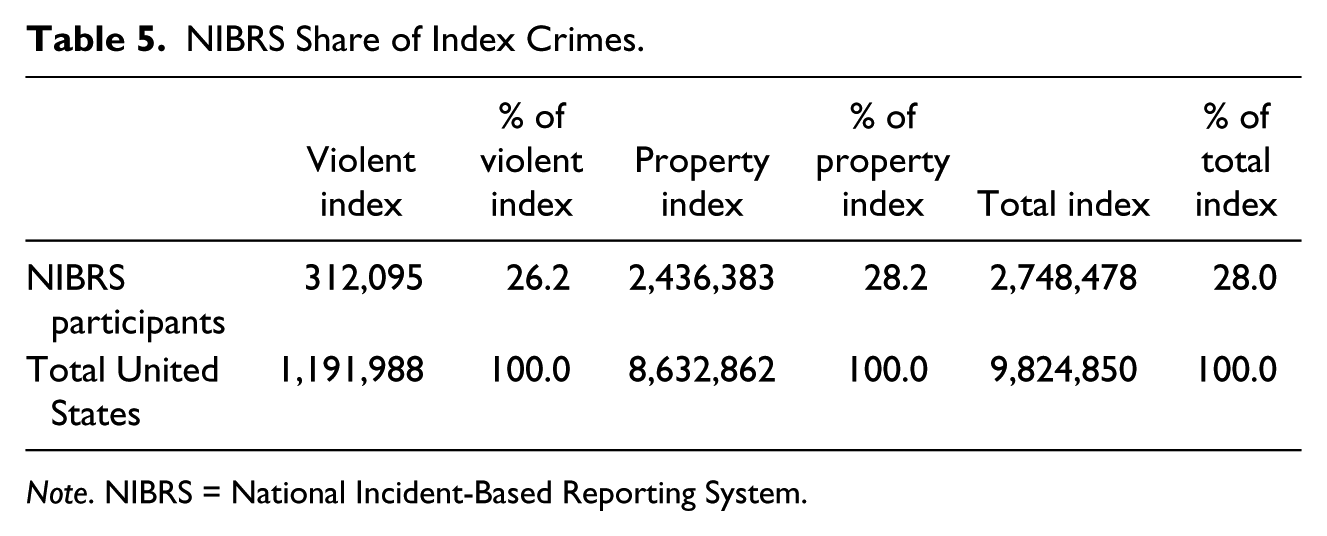
Note. NIBRS = National Incident-Based Reporting System.
Tables 6 and 7 provide data based on population rankings which provide additional support concerning the poor coverage of NIBRS. Table 6 provides a ranking of the top 20 states in population. There is no NIBRS coverage in nine of these highly populous states and there is low coverage (25% or less) in four others. NIBRS coverage of state population amounts to 70% or higher in seven states. Similarly, Table 7 provides information on the top 25 most populous cities. NIBRS has not been implemented in 17 of these jurisdictions and NIBRS coverage starts at Columbus, Ohio, which is only ranked 15th among the top 25 cities.
NIBRS Coverage of Top 20 States in Population.

Note. NIBRS = National Incident-Based Reporting System.
NIBRS Coverage of Top 25 Cities in Population.
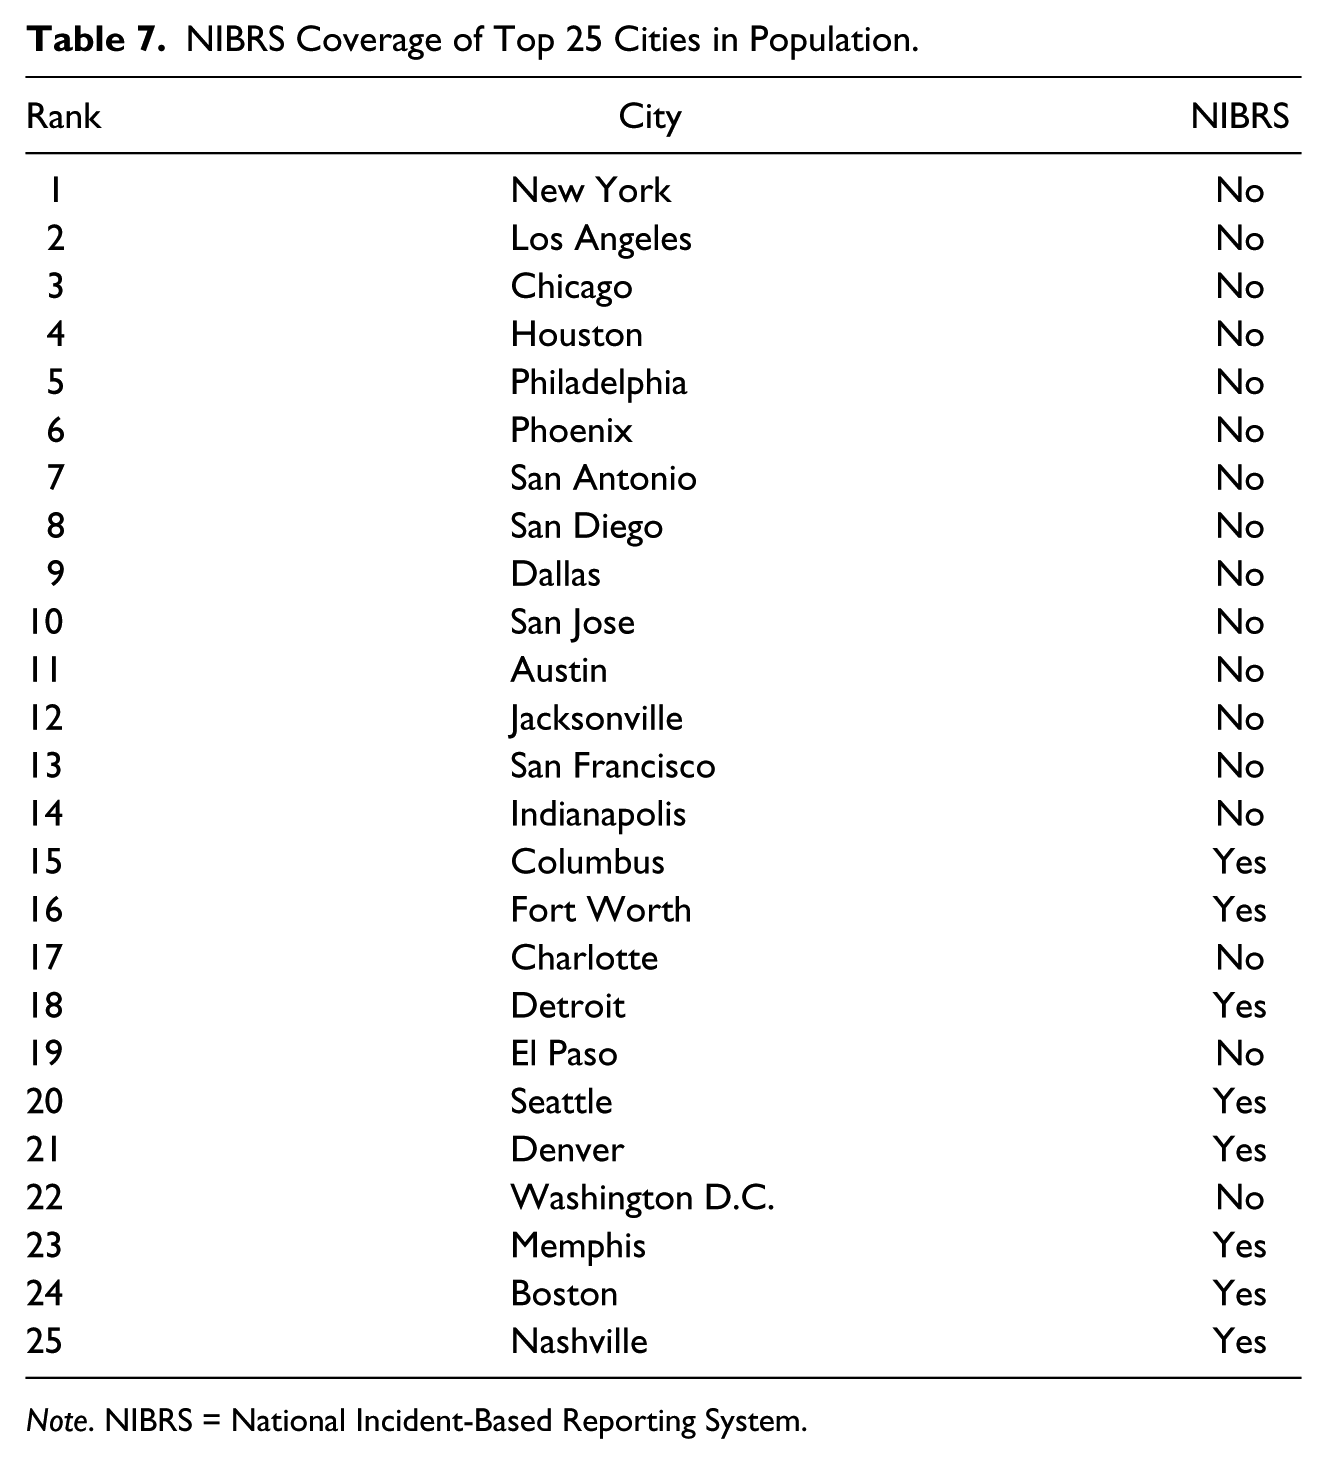
Note. NIBRS = National Incident-Based Reporting System.
Thus far we have examined NIBRS coverage of population and the volume of violent and property index crimes. In Table 8, we provide important data concerning the extent to which the crime rates in NIBRS jurisdictions are concordant with their non-NIBRS counterparts. For all crime rate comparisons, NIBRS jurisdictions are discordant and represent jurisdictions with lower crime rates.
NIBRS Coverage: Index Crimes, Population, and Crime Rates.

Note. NIBRS = National Incident-Based Reporting System.
The violent crime rate for NIBRS agencies (336.62) is 14% lower than the rate (389.83) for the other law enforcement agencies in the same state that participate in the UCR. The property crime rate is 11% lower in NIBRS agencies (2,627.82) as compared with non-NIBRS agencies (2,937.64). The violent crime disparity increases to 15% for NIBRS agencies (336.62) versus non-NIBRS states (396.62). However, the property crime rate disparity is reduced to just 1%. As compared with the whole United States, NIBRS agencies have a violent crime rate that is 11% lower and a property crime rate that is 4% lower.
NIBRS Expanded Data
It was noted above that by design, NIBRS is potentially much more valuable for research than UCR data because NIBRS contains expanded data concerning the age, sex, and race of victims, offenders, arrestees, and also includes data on the victim–offender relationship. To assess the utility of these data in NIBRS, given its present coverage in 37 states plus the District of Columbia, we compare NIBRS to the FBI’s SHR. SHR data provide additional details about each homicide incident, including the jurisdiction, month, year, victim and offender demographic characteristics, weapon, the circumstances surrounding the incident, and the relationship between the victim and offender, if known (BJS, 2014).
It must be noted that SHR data themselves are not without problems. The SHR are voluntary and a number of law enforcement agencies do not consistently submit SHR forms or do not submit any data at all (BJS, 2014). Historical data indicate that from 85% to 90% of all homicides reported in the UCR summary data also have a corresponding SHR form (BJS, 2014). Beyond the percentage coverage issue, the SHR data also suffer from missing information about various characteristics of the homicide because the data were not available at the time of submission or were not reported by the agency. The BJS estimates that about 1% of SHR cases are missing victim information, including the victim’s age, gender, and race, and approximately 30% of SHR cases have an unknown offender (2014). Furthermore, BJS has reported that the proportion of SHR cases that are missing information on the relationship between the victim and the offender has increased from 25% in 1976 to more than 40% since 2000.
We are comparing NIBRS data and SHR data, not as a rigid validation exercise, but rather, to reveal whether the expanded data available in NIBRS provide similar results to the only aspect of UCR data that also provide expanded data (i.e., SHR). The following comparisons are based on the NIBRS data for 2013 which contain 3,541 murders and nonnegligent manslaughters, and the SHR which contain 14,319 offenses (for a NIBRS coverage of 24.7%). These comparisons are shown in Tables 9 to 13.
Race of Homicide Offender.
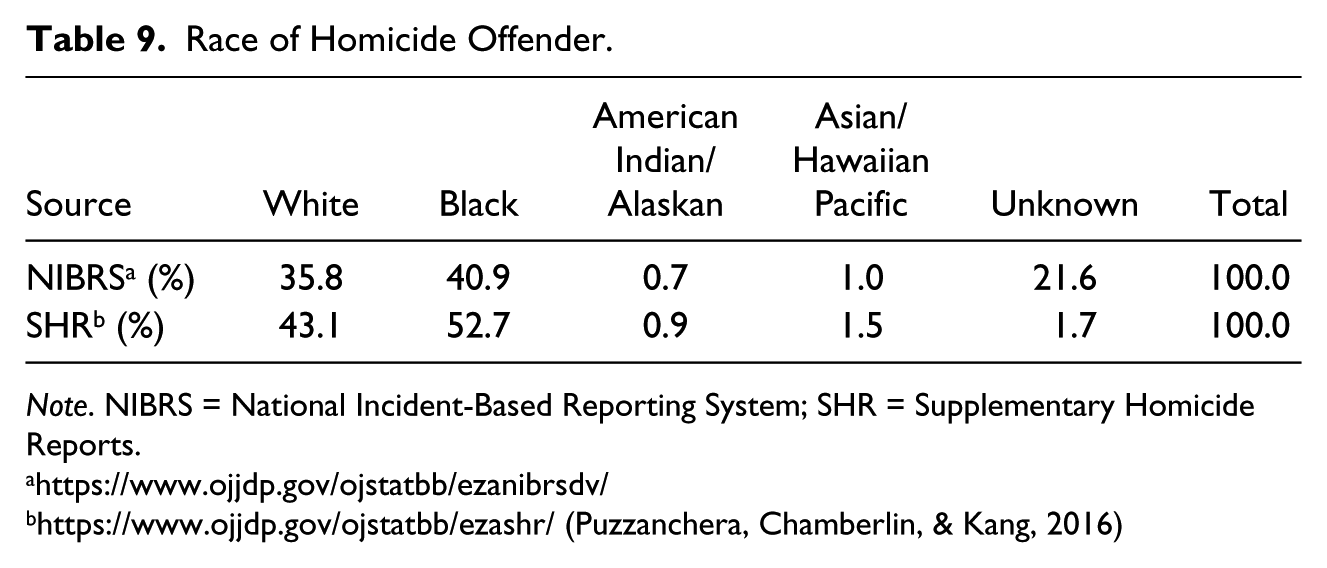
Note. NIBRS = National Incident-Based Reporting System; SHR = Supplementary Homicide Reports.
Table 9 reports the race/ethnicity of homicide offenders in the two data series. Compared with SHR data (White 43.1%; Black 52.7%), NIBRS data (White 35.8%; Black 43.9) undercount Whites by about 7% and Blacks by about 11%. The reason is very straightforward—NIBRS data contain a much higher percentage of cases for which race/ethnicity is unknown compared with SHR (20.6% vs. 1.7%).
Table 10 indicates a similar situation with respect to victims. The SHR indicates that 49.7% of murder victims were White and 46.6% were Black. By comparison, NIBRS shows 45.8% White victims and 50.7% Black victims. NIBRS underrepresents White victims and overrepresents Black victims by about 4% each. Unlike the race of offender, the missing data for victim race owing to unknowns is negligible at 1.6% for NIBRS and 1% for SHR. Thus, NIBRS victims are actually different than SHR victims by race/ethnicity and NIBRS data are not representative of national data.
Race of Homicide Victim.

Note. NIBRS = National Incident-Based Reporting System; SHR = Supplementary Homicide Reports.
The findings concerning the sex of homicide offenders in Table 11 and the age of homicide offenders in Table 12 reflect the same situation as Table 9. That is, because of substantial missing data in NIBRS, the sex and age correlates of homicide offenders are distorted. Compared with the SHR, NIBRS data undercount males by 17.5% (88.9% vs. 71.4%) and females by 2.5% in addition to having a substantial portion unknown (20.8%). The lack of representativeness is even more pronounced across age categories. SHR data indicate that the two age groups with the highest percentages of homicide offenders are 18 to 24 (33.6%) and 25 to 49 (43.4%). Yet, NIBRS undercounts these two prominent age categories by 10.8% for the 18 to 24 (22.8%) category and by 5.2% for the 25 to 49 age group (38.2%).
Sex of Homicide Offender.

Note. NIBRS = National Incident-Based Reporting System; SHR = Supplementary Homicide Reports.
Age of Homicide Offender.
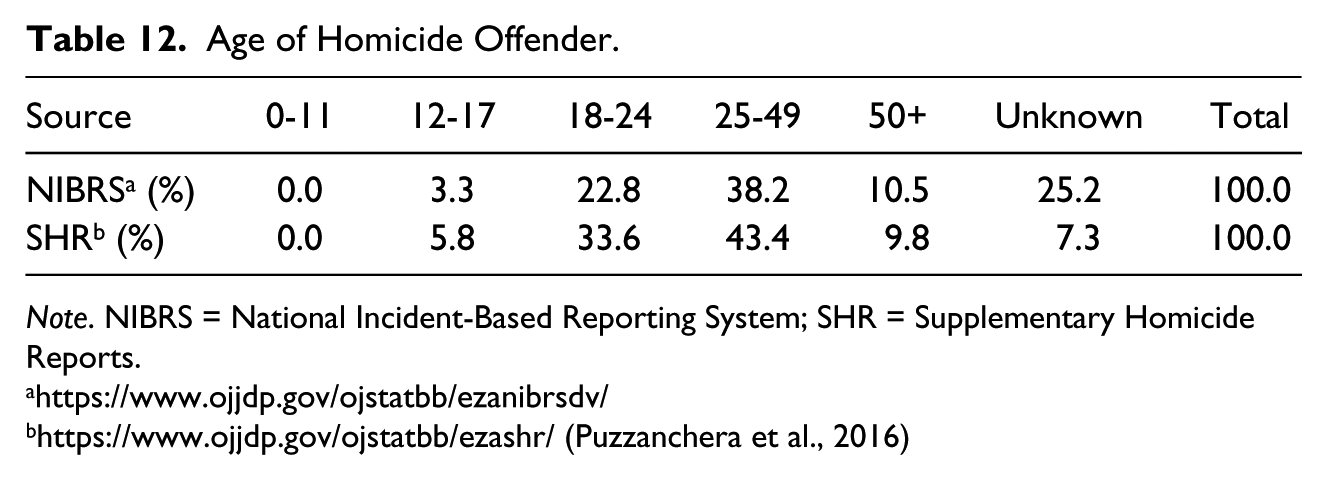
Note. NIBRS = National Incident-Based Reporting System; SHR = Supplementary Homicide Reports.
One of the most important, and arguably the most important, aspects of homicide for researchers is the victim–offender relationship. Again, because of missing data, NIBRS distorts the distribution of this relationship. In Table 13, we find that NIBRS undercounts acquaintance homicides by 9% (34.0% vs. 43.7%) and stranger homicide by 9% (8.6% vs. 17.6%). Thus, the actual victim–offender relationship as reflected in SHR data suggests that use of NIBRS can lead to serious misrepresentations.
Homicide: Victim/Offender Relationship.
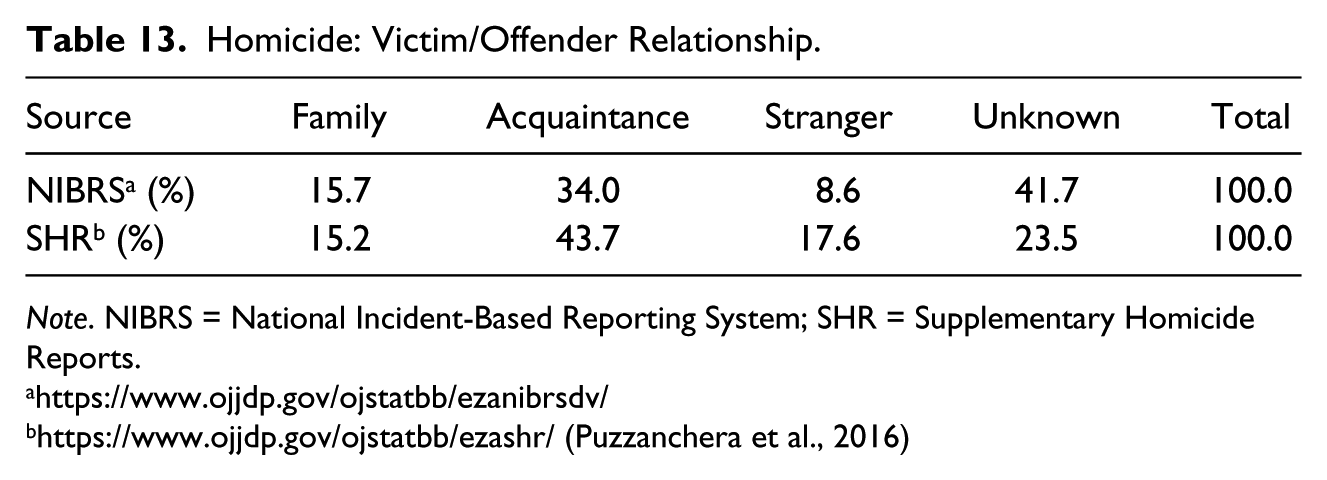
Note. NIBRS = National Incident-Based Reporting System; SHR = Supplementary Homicide Reports.
Summary
Population Coverage
This article has assessed the coverage of NIBRS as of 2013. We have examined population coverage and index crime coverage, and the correspondence of crime rates between the UCR and NIBRS. We found that NIBRS has partial population coverage (50.3%) across the 36 states that participate in NIBRS. However, the degree of participation across these states varies greatly. We found that there are 16 states (generally with lower population) with greater than 90% participation. But, there are nine states with NIBRS coverage of 25% or lower (generally the more populous states.). There are 14 states that do not participate in NIBRS. Overall, the NIBRS participating states only cover 29.3% of the 316,128,839 people in the United States.
These results indicate that, as of 2013, the population coverage of NIBRS has not progressed sufficiently. There are a few other assessments available, and it is instructive at this point to compare the present results with the findings from these assessments. According to the Justice Research and Statistics Association’s IBR Resource Center, approximately 22% of the nation’s population was covered by law enforcement agencies that reported NIBRS-compliant data in 2008 (James & Council, 2008) and covered 29% in 2012 (Justice Research and Statistics Association, n.d.). Thus, between the inaugural year of 1991, NIBRS coverage has expanded from 3.3% to less than one third of the population.
We also found that NIBRS jurisdictions underrepresent the more populous states in favor of smaller jurisdictions. In terms of the 20 most populous states, there is no NIBRS coverage in nine of these jurisdictions and there is low coverage (25% or less) in four others. Similarly, with respect to data on the top 25 most populous cities, NIBRS has not been implemented in 17 of these large jurisdictions. In fact, NIBRS coverage starts at Columbus, Ohio, which is only ranked 15th among the top 25 cities.
Our results resonate with other studies. A. Roberts (2009) has a widely cited summary of the utility and, perhaps more importantly, the limitations of NIBRS since its inception. She has indicated that, as a result of how young and expansive NIBRS is compared with the UCR, there are many generalizability issues. The data we gather and analyze from NIBRS may be best used at this time to describe smaller agencies. There are issues of regional representation as well. NIBRS overrepresents southern agencies and underrepresents larger jurisdictions (Chilton & Regoeczi, 2007). Addington (2008) has shown that, not only is the coverage relatively low, but also, the agencies that participate are overwhelmingly smaller agencies.
Crime Coverage
We also examined UCR index crime coverage available through NIBRS as of 2013. There were 312,095 violent index offenses in the NIBRS jurisdictions as compared with 1,191,988 violent index offenses across all of the United States. Thus, the NIBRS jurisdictions covered only 26.2% of these offenses. The situation for property index crimes showed a similar lack of coverage. There were 2,436,383 property index offenses in the NIBRS jurisdictions as compared with 8,632,862 offenses across all of the United States which represents a coverage of just 28.2% of these offenses. In terms of all UCR index offenses, NIBRS covered only 28% of UCR index crimes.
Just like the situation with population, our results indicate that NIBRS crime coverage has not progressed appreciably. As of 2008, the Justice Research and Statistics Association found that approximately 17% of reported crime is reported through the NIBRS program (James & Council, 2008), as compared with 2013 for which the coverage had expanded to only 27% of the nation’s reported crime.
Crime Rates
We compared the UCR crime rates across NIBRS jurisdictions and non-NIBRS jurisdictions. We found appreciable differences that attest to the lack of representativeness of NIBRS jurisdictions in three respects.
First, the violent crime rate for NIBRS agencies (336.62) was 14% lower than the rate (389.83) for the other law enforcement agencies in the same state. The property crime rate was 11% lower in NIBRS agencies (2,627.82) as compared with non-NIBRS agencies (2,937.64). Second, the violent crime disparity increased to 15% for NIBRS agencies (336.62) versus non-NIBRS states (396.62). However, the property crime rate disparity was reduced to just 1%. Last, as compared with the whole United States, NIBRS agencies have a violent crime rate that is 11% lower and a property crime rate that is 4% lower. Our findings concerning crime rates are in stark contrast to a widely cited BJS study (Rantala, 2000, also cited as Rantala & Edwards, 2000). The BJS study compared NIBRS-computed crime rates to UCR crime rates for agencies in nine NIBRS-certified states for 1991-1996. Rantala found that, overall, the difference between the crime rates calculated using NIBRS and UCR data was small. Specifically, on average, the NIBRS index crime rate was 2% higher than the UCR crime rate. On average, the NIBRS violent crime rate was higher than the UCR violent crime rate by less than 1%, and the NIBRS property crime rate was higher than the UCR property crime rate by slightly more than 2%. We stand by our rates which were calculated for a more recent year (2013) and we used UCR data and NIBRS data for all jurisdictions—not just a sample.
Barriers to Implementation
Clearly, implementation has been quite slow. Since the inaugural year of 1991, NIBRS has only progressed from covering 3.3% of the population to 29.3% in 2013 and some of the original agencies are no longer participating (Faggiani & Hirschel, 2005). In 1997, the SEARCH group collected data from the 64 largest law enforcement agencies in the United States to determine what impediments they face in making the transition to the NIBRS. These law enforcement agencies identified seven general impediments to NIBRS implementation:
Since 17 of the nation’s largest cities do not participate in NIBRS, and such participation did not occur until the 15th largest city, it would seem that the concerns raised in 1997 by the SEARCH study are still true today. If this is the case, then NIBRS expansion has not progressed sufficiently. This lack of progress has occurred despite the best efforts of the FBI. These efforts begin at the top of the agency. For example, Director Comey has made crime data modernization a top priority and NIBRS is an integral part of this crime data modernization initiative. The Criminal Justice Information Services (CJIS) Advisory Policy Board (APB) recommended, and Director Comey concurred, to retire the UCR SRS and transition to a NIBRS-only data collection by January 1, 2021. The FBI is also conducting a NIBRS modernization study to determine if NIBRS meets the needs of the policing community. Similarly, the FBI continues to provide a variety of resources to address stakeholder questions regarding NIBRS including information, training, and assistance to help agencies report and publish quality data for their constituencies. All of these concerted efforts by the FBI should help alleviate the concerns and perceptions of the 64 largest law enforcement agencies so that NIBRS can expand to large jurisdictions.
One area that seems to require more concerted effort concerns funding. BJS awarded over US$13 million in grants in 2001 to states for the purpose of implementing NIBRS-compatible systems. However, grant funds for this purpose have only recently become available for NIBRS development. In FY2015, BJS awarded monies to 14 states to plan for or implement the NIBRS. In 2016, a total of US$18.7 million was awarded by the FBI and administered by BJS to support the transition of 17 of the largest local law enforcement agencies to their states’ incident-based crime reporting systems and 10 states were also funded (Office of Justice Programs [OJP], 2016). These funds came from the 2016 National Crime Statistics Exchange initiative between the FBI and BJS. This is a very important joint initiative and must be continued, especially because it was the springboard for the broader FBI NIBRS transition. NIBRS is now a priority item for the Edward Byrne Memorial Justice Assistance Grants (JAG). States can use their JAG funding to implement the NIBRS. The FBI has also funded a NIBRS Modernization Study to understand the impact of the 2021 NIBRS transition on state, local, and tribal agencies and to gauge the technical readiness of the NIBRS in an effort to meet the needs of the law enforcement community and the public.
NIBRS is clearly an important initiative to the FBI and BJS. If funding availability has been one of the barriers to full-scale implementation, then increased funding must be made available. The U.S. Department of Justice is the parent agency of the FBI and also the OJP. In turn, OJP administers the following agencies: Bureau of Justice Assistance, National Institute of Justice, Office of Juvenile Justice and Delinquency Prevention, Office for Victims of Crime, and Office of Sex Offender Sentencing, Monitoring, Apprehending, Registering, and Tracking (SMART). It would be hard to imagine that all these agencies would not benefit from the widest possible implementation of NIBRS. Clearly, the Department of Justice must be given a congressional mandate, and the authorization of sufficient funds, to ensure that NIBRS is implemented nationally.
The current status of NIBRS is thus problematic. The coverage limitations raised here owing to poor participation levels are highly significant. NIBRS is not representative of major segments of the population and crime volume. The data are clearly not generalizable to the entire country and especially not to large cities. This situation is problematic for research in three major respects. First, owing to the absence of coverage in many of the largest U.S. cities, the use of NIBRS to test major theories like social disorganization (Bursik, 1988) and concentrated disadvantage (Sampson & Groves, 1989) is severely minimized. Second, as law enforcement agencies in the largest jurisdictions are not covered by NIBRS, the investigation of the clearance data is constrained because large law enforcement agencies may be very different than the smaller agencies. Last, because of the lack of coverage of larger states and the largest cities, the data on arrestee characteristics are also likely unrepresentative.
The limited coverage of NIBRS is most unfortunate because NIBRS has great potential. It collects a considerable amount of data concerning a criminal incident. For Group A offenses, there can be up to 10 different offenses, 99 offenders, 999 victims, and six types of property loss recorded (for property crimes) for each incident (OJDDP, 2013). For Group B offenses, however, there can be only one arrestee recorded for each incident. With this much information available on crime incidents, what NIBRS can tell us about crime far exceeds what the UCR can. However, this great potential can only be realized if NIBRS is implemented on a much wider scale than it is at present.
Footnotes
Acknowledgements
The authors are grateful to the staff of the National Incident-Based Reporting System (NIBRS) section of the Federal Bureau of Investigation for their comments on a draft of this article.
Declaration of Conflicting Interests
The author(s) declared no potential conflicts of interest with respect to the research, authorship, and/or publication of this article.
Funding
The author(s) received no financial support for the research, authorship, and/or publication of this article.