
Abstract
This study investigates how convenience stores and fast food restaurants influence crime patterns over time. Using sales volume data from fast food restaurants and convenience stores, we examine streetblock crime levels over a seven year period in Seattle using multilevel models. Results demonstrate that high sales volume links to high crime, even after controlling for local socio-economic status, the effects of retail businesses, and local crime trends. In addition, street segment crime trajectories were spatially clustered in a significant way. The dynamics that explain why specific types of commercial facilities link to street crime need further theoretical clarification. This is the first study demonstrating significant spatio-temporal patterning of streetblock crime trends.
Introduction
Crime events occur nonrandomly in space. Prior research has examined connections between mixed land use and crime, and between certain types of commercial facilities—including bars, pawn shops, and check cashing operations—and crime. This article uses revenue data from two types of facilities, fast food restaurants and convenience stores, to develop our understanding of how these businesses link to crime patterns. It is the first study to examine this link using a unique measure that accounts for the fact that some stores generate more revenue compared with others; therefore, stores may influence crime in different ways. We consider if sales volume can explain the link between these businesses and crime.
Research has established a general link between nonresidential land use—more specifically, commercial land use or commercial facilities—and crime. Prior studies have attempted to examine the mechanism through which these businesses foster crime. It is unclear if the responsible dynamic is best captured on a categorical or continuous scale. In this article, we propose this mechanism is best measured using a continuous scale to account for the possibility that within this category of commercial land use, stores may link to crime in different ways. The current study will test this dynamic at the streetblock level using store revenue data.
Finally, previous research has found that crime trends at the streetblock level are spatially patterned (Weisburd, Groff, & Yang, 2012). This study will build on these findings by allowing each streetblock in Seattle to have its own unique crime trajectory over time, not group trajectories as was done by Weisburd and colleagues (2012).
Commercial Facilities and Crime
A large body of research has identified a connection between types of land use and types of crime at a number of spatial scales. These spatial scales include census tracts (Wilcox, Quisenberry, Cabrera, & Jones, 2004), land parcels (Kinney, Brantingham, Wuschke, Kirk, & Brantingham, 2008), 1,000-foot grid cells (Stucky & Ottensmann, 2009), or units as small as streetblocks (Smith, Frazee, & Davidson, 2000; Weisburd et al., 2012).
Using land parcels to examine six different types of land use, Kinney and colleagues (2008) found that assaults and motor vehicle thefts concentrated in land parcels classified as commercial land use. More recently, Stucky and Ottensmann identified a significant positive relationship between the amount of commercial land use and violent crime using a slightly larger spatial unit, 1,000-foot grid cells (Stucky & Ottensmann, 2009). At the census tract level, Wilcox et al. (2004) found that business places, represented by a factor score including fast food restaurants and stores/gas stations, were significant predictors of violent crime and burglary rates, even after controlling for variables such as concentrated disadvantage, population instability, and disorder.
In each of the studies cited above, a variety of commercial facilities were aggregated into one variable representing commercial land use. In doing so, there is an implicit assumption that the crime potentials of different types of businesses are equivalent. Based on the results of Kinney and colleagues (2008), this assumption may be unwarranted. In their study, the commercial land use category was further broken down into 55 subcategories. These subcategories included automobile dealerships, parking lots, shopping centers, nursing homes, hotels and fast food restaurants, among others. Their results indicate that most subcategories of commercial land use experienced little to no crime. Among those that experienced the most crime were regional shopping centers, community shopping centers, and neighborhood pubs.
Other studies have investigated subsets of the commercial land use category by examining specific types of commercial facilities. Using data measured at the city block level in Cleveland, Ohio, Roncek and Maier (2004) found that when the number of taverns and cocktail lounges on a streetblock increased, the amount of crime on those streetblocks also increased. A relationship between drinking places and crime was also identified using data from Seattle, Washington (Groff, 2011); specifically, Groff found that the influence of drinking facilities extends two to three city blocks.
Other types of nonresidential facilities that are found to have a relationship with crime are schools (Perkins, Florin, Rich, Wandersman, & Chavis, 1990), parks (Groff & McCord, 2012), and subway stops (McCord & Ratcliffe, 2009). These findings clearly demonstrate that there is a crime connection for specific facilities. Furthermore, they also demonstrate the importance of studying these relationships at small spatial units. Each of these studies were conducted at the streetblock level (Perkins et al., 1990; Roncek & Maier, 1991) or used short-distance buffers around facilities (Groff & McCord, 2012; McCord & Ratcliffe, 2009). The current study not only examines the relationship between two specific types of commercial facilities (fast food restaurants and convenience stores) and crime over time, but it also does so at a theoretically relevant spatial unit—the streetblock (Taylor, 1997). But what do we already know about how fast food restaurants and convenience stores link to crime? The current state of the literature is described next.
Fast Food Restaurants and Convenience Stores
Fast food restaurants and convenience stores are multibillion dollar industries that have experienced annual growth over the last 5 years (IBISWorld, 2015a, 2015b). A number of studies have examined how these businesses link to crime. We classify these studies as those that examine how these facilities link to crime inside these facilities, or how these facilities link to crime around these facilities.
With regard to the former, many studies have found that convenience stores attract armed robbers who are looking to rob a cashier for the money in the register (D’Alessio & StolzenBerg, 1990; Duffala, 1976; Exum, Kuhns, Koch, & Johnson, 2010). These studies have identified which types of stores pose the highest risk of victimization based on store accessibility and contextual factors so that crime prevention measures can be implemented.
Other studies have found that fast food restaurants and convenience stores link to crime around these facilities (Bernasco & Block, 2011; Brantingham & Brantingham, 1981; Schweitzer, Kim, & Mackin, 1999; Smith et al., 2000; Wilcox et al., 2004). Two of these studies (Bernasco & Block, 2011; Smith et al., 2000) use fast food restaurants and convenience stores to model places where people are likely to have cash on them. Both studies find that these facilities link in a positive and significant way to local robbery patterns.
Other researchers have aggregated the effect of convenience stores and fast food restaurants with other types of facilities to include grocery stores, bars, restaurants, shopping centers, office buildings, or hotels (Miethe & McDowall, 1993; Wilcox et al., 2004). Miethe and McDowall (1993) include fast food restaurants and convenience stores in an index with other types of facilities to measure “busy places” (Miethe and McDowall, 1993, p. 748). They found that these “busy places” increase individuals’ risk of violent crime but not burglary. Wilcox and colleagues also include these facilities with other business types, but they use this index to measure “the general presence of commercial land use within the community” (Wilcox et al., 2004, p. 196). They found that these places link to both violent and property crime. Schweitzer and colleagues (1999) found that the presence of convenience stores and grocery stores (measured as a binary variable) positively link to both fear of crime and actual crime; actual crime included a combination of violent crime and property crime.
Rather than including fast food restaurants and convenience stores in a broader index measuring commercial land use, this study will isolate the effect of these facilities from other types of commercial facilities as only one other study has done (Bernasco & Block, 2011). Our study, however, does so in a way that acknowledges the possibility that facilities may link to crime in different ways at the streetblock level. Rather than modeling the number of facilities on each street as Bernasco and Block chose to do, the current study will measure the varying impacts of these facilities using sales volume from each store. Some stores generate more revenue compared with others; therefore, stores may influence crime in different ways. This choice of measurement is in line with prior research that has found that “for any group of similar facilities (for example, taverns, parking lots, or bus shelters), a small proportion of the group accounts for the majority of crime experienced by the entire group” (Eck, Clarke, & Guerette, 2007, p. 226). We suspect that the link between fast food restaurants and crime is best modeled as a linear relationship based on store revenue; stores with high revenue with have higher crime compared with stores with low revenue. We use the revenue data to reflect human activity that is directly related to these types of businesses; a high sales volume reflects high human activity driven by these types of businesses.
Measuring human activity was found to be important in prior research. Brantingham and Brantingham (1981) used a combination of fast food restaurants and traffic flows (measured as major; moderate or minor) to explain commercial burglary patterns in New Westminster, British Columbia, at small spatial scales. They concluded that “it seems clear that combinations of commercial landmarks and some levels of traffic flow could be used as reasonable predictors of commercial burglary target choice” (Brantingham & Brantingham, 1981, p. 96).
Control Variables
The existing theoretical and empirical literature suggests that other types of commercial business presence and residential socio-economic status (SES) may also influence crime counts at the streetblock level. In the current study, the effect of fast food restaurants and conveniences stores will be assessed after controlling for these variables.
Commercial land use
Environmental sociologists have argued that land use influences human behavior, either in a positive way or a negative way. Some argue that neighborhoods with a mix of both residential and nonresidential land use bring outsiders into an area; this has a negative effect on the community because it makes it difficult to differentiate people who belong in the area from those who do not (Kurtz, Koons, & Taylor, 1998). Others argue the opposite, mixed land uses are beneficial to communities and help to reduce crime because they create a constant flow of human activity keeping “eyes on the street” at all times (Jacobs, 1961).
Previous studies looking specifically at the influence of commercial land use on crime have generally supported the notion that concentrations of businesses have a deleterious effect on communities. Stucky and Ottensmann (2009) identified a significant positive relationship between the percentage of commercial land use and violent crime. Similarly, Wilcox et al. (2004) found that business presence—represented by a factor score including fast food and stores/gas stations—linked to higher violent crime and burglary rates. Using streetblocks as the unit of analysis, Smith et al. (2000) found the number of restaurants and bars linked positively with the number of street robberies on a streetblock. A mixed method study using census, ethnographic observation, behavioral observation, and crime data found evidence that an auto repair facility on a narrow and short streetblock generated natural guardians, who in keeping an eye on customers’ cars, also seemed to constrain the locations of both rowdy youth and drug-dealing activities (Roberts, Taylor, Garcia, & Perenzin, 2014). Alternatively, Weisburd et al. (2012) found that sales for retail businesses—used to model suitable targets of crime according to the routine activity theory—do not link to multiyear crime trajectories at the streetblock level in a statistically significant way.
Based on these studies, we control for the effect of other types of commercial facilities—specifically, retail businesses—in examining the link between crime and fast food restaurants and convenience stores. We cautiously expect to find activity from retail businesses will (a) link in a positive way to crime counts at the streetblock level and (b) will also elevate the slope of crime trends over time. As retail sales volume on a streetblock increases, this makes it more difficult for residents to recognize others on the street and decode interactions (Kurtz et al., 1998). Consequently, this may make it easier for offenders to victimize store customers.
Residential SES
Another body of literature has found that residential SES links to crime. The negative relationship between SES and crime or delinquency at the neighborhood and streetblock levels has been demonstrated repeatedly over the last 90 years (Taylor, 2015). A meta-analysis comparing the results of over 200 empirical studies revealed that poverty is among the strongest and most stable macro-level predictor of crime (Pratt & Cullen, 2005). Similarly, Weisburd et al. (2012) identified a significant connection between SES and crime at the streetblock level.
The extent to which fast food restaurants and convenience stores drive crime patterns will be assessed after controlling for the influence of local SES. In addition, the large body of research finding both theoretical and empirical relationships between SES and crime provide a foundation that suggests its inclusion as a variable (a) will elevate streetblock crime counts and (b) will elevate the slope of crime trends over time.
Temporal Crime Trends
Previous research has found that prior crime is a statistically significant predictor of future crime for a variety of crime types at the census block group level (Taylor, Ratcliffe, & Perenzin, 2015). Weisburd and colleagues (2012) found evidence that group-level crime trajectories exist at the streetblock level that suggests the link between previous crime and future crime exists at the streetblock level as well. In the current study, instead of using group-level crime trajectories, each streetblock will be allowed to have its own unique crime trajectory through time. The effect of sales volume from convenience stores and fast food restaurants on crime counts will be assessed after controlling for crime counts on those streetblocks from previous years.
The spatial patterning of multiyear crime trends has been the topic of previous research (Weisburd et al., 2012). The spatial patterning of crime trends can been explained through the process of exposure or a process of diffusion (Morenoff, Sampson, & Raudenbush, 2001). The process of exposure suggests that contextual factors that foster crime—such as concentrated poverty, low levels of collective efficacy, or even features of the physical environment—may be spatially and temporally patterned. Crime trends, therefore, would be patterned in a way that aligns with the risk factors of crime. Alternatively, the process of diffusion would suggest crime patterns are generated through social interactions. If this process is at work, crime in one location could be the cause of future crime in a nearby location, that is, if social interactions are spatially clustered. This diffusion process has been used to explain the spatial distribution of drug crime (Rengert, 1996) as well as homicides (Loftin, 1986). Both of these processes—the exposure and the diffusion process—suggest something measured above the streetblock level is driving crime. If individual crime trajectories prove to be spatially patterned, this spatio-temporal interaction may be driven by either of these processes.
Gaps in Previous Works Addressed Here
The current work addresses six specific gaps in the empirical work to date on criminogenic commercial facilities and crime at the meso-level. First, it identifies the specific effects of one class of particularly criminogenic commercial facilities—fast food restaurants and convenience stores. Although previous works have included these two facility types in broader indicators of commercial land use (Smith et al., 2000; Weisburd et al., 2012; Wilcox et al., 2004), such indices conflate the impacts of these two types with other types of commercial facilities (e.g., bars, restaurants, and banks, or shopping centers). Consequently, we do not yet know if the presence of fast food restaurants and convenience stores, as one specific class of commercial facility, links to higher streetblock crime levels. Second, much of the work in this area, although Weisburd et al. (2012) is an exception, has used spatial units that do not theoretically align with the described criminogenic process and thus may mask important links. Wilcox et al.’s (2004) census tracts or Stucky and Ottensmann’s (2009) 1,000-grid cells are examples. It is crucial that spatial scale match anticipated theoretical dynamics (Hipp, 2007; Taylor, 2015). Third, although there are exceptions (e.g., Weisburd et al., 2012), prior work in this area is cross-sectional (Stucky & Ottensmann, 2009) rather than longitudinal. By using data from a multiyear period, as is done here, the durability of the link between these facilities and crime can be gauged. Multiyear data also allow us to control for the influence of local crime trajectories over time. Fourth, although again there are exceptions (e.g., Weisburd et al., 2012), prior work in this area fails to take local context into account (e.g., Wilcox et al., 2004). Consequently, previous research may have mis-specified the facilities/crime connection. Fifth, none of the works to date have considered how unique crime trends of streetblocks may be spatially patterned. A fundamental principle of micro-ecology is that streetblocks are interconnected and are conditioned by nearby streetblocks (Taylor, 1997); a focus on diffusion processes suggests similarly. Finally, the current study acknowledges the possibility that the dynamic linking facilities to crime may best be measured using a continuous scale that accounts for the fact that some facilities create more human activity compared with others. Rather than counting the number of stores on each streetblock as was done by Bernasco and Block (2011), we use sales volume to measure this dynamic.
The current work addresses these gaps and examines the connection between commercial facilities and crime for these particular classes of commercial facilities that are criminogenic; it will do so in a more comprehensive and theoretically aligned manner than many of the works in this area.
This study examines two primary research questions: (a) Over a multiyear period, controlling for local crime patterns (spatial lag), streetblock crime trends over time (temporal trend), SES, and other commercial business presence (retail sales), do we observe a positive connection between fast food restaurant and convenience stores and street crime levels? (b) Are the unique crime trajectories spatially patterned?
Method
Data were collected by Weisburd et al. (2012) and were retrieved from the Inter-university Consortium for Political and Social Research (ICPSR 28161). Data came from Seattle, Washington (population = 563,374 in 2000). In the original study and here, streetblocks are the unit of analysis as they “are important conceptual and operational units in planning and useful organizing and prevention units in community psychology” (Taylor, 2015, p. 134).
The data are multilevel with years nested within streetblocks. Previous studies (Groff, Weisburd, & Yang, 2010; Weisburd et al., 2012) using these data have applied group-based trajectory modeling (Nagin, 2010). Significant empirical and conceptual questions surround the use of trajectory models (Skardhamar, 2010). Therefore, multilevel models are used to allow each streetblock to have its own unique trajectory through time (Raudenbush, 2005). Modeling the data in this manner opens up two interesting possibilities: (a) some streetblocks may experience stronger or weaker crime shifts over time and (b) changes in crime levels over time may be spatially patterned.
Time Varying Variables
Dependent variable: Crime count
In the dataset used in this study, Weisburd and colleagues used crime incident reports to model crime. The dataset assembled by Weisburd and colleagues excludes crime incidents that occurred at street intersections as 45.3% of those reports were traffic-related incidents. Other excluded incidents include incidents with an address of a police precinct or police headquarters, incidents that were reported to the Seattle Police Department but were outside the city limits of Seattle, and incidents reported to the University of Washington campus police department. In addition to the removal of the aforementioned incident types, crimes on certain types of streetblocks were removed from the dataset. Major highways and limited access highways were both excluded from the dataset because they are not conducive to human interaction. Once these incidents and streetblocks were eliminated, 1,697,212 incidents on 24,023 streetblocks remained in the dataset from 1991 to 2004. Sales data from commercial businesses were only available from 1998 to 2004, so those years became the study period, leaving 679,777 1 crime incidents in the dataset.
Data transformation
The dependent variable, crime counts per streetblock per year, was winsorized (Tukey & McLaughlin, 1963). This method has been used by other criminal justice researchers for count-based dependent variables with extreme outliers (French, McCollister, Alexandre, Chitwood, & McCoy, 2004; Mitchell, Wilson, & MacKenzie, 2007; Wyant & Taylor, 2007). Streetblocks with 50 or more incident reports were recoded as 50. This condensed 1% (n = 1,507) of the streetblock crime counts. 2 The final data file contained 24,023 streetblocks for each of 7 years. Univariate statistics appear in Table 1.
Univariate Statistics.
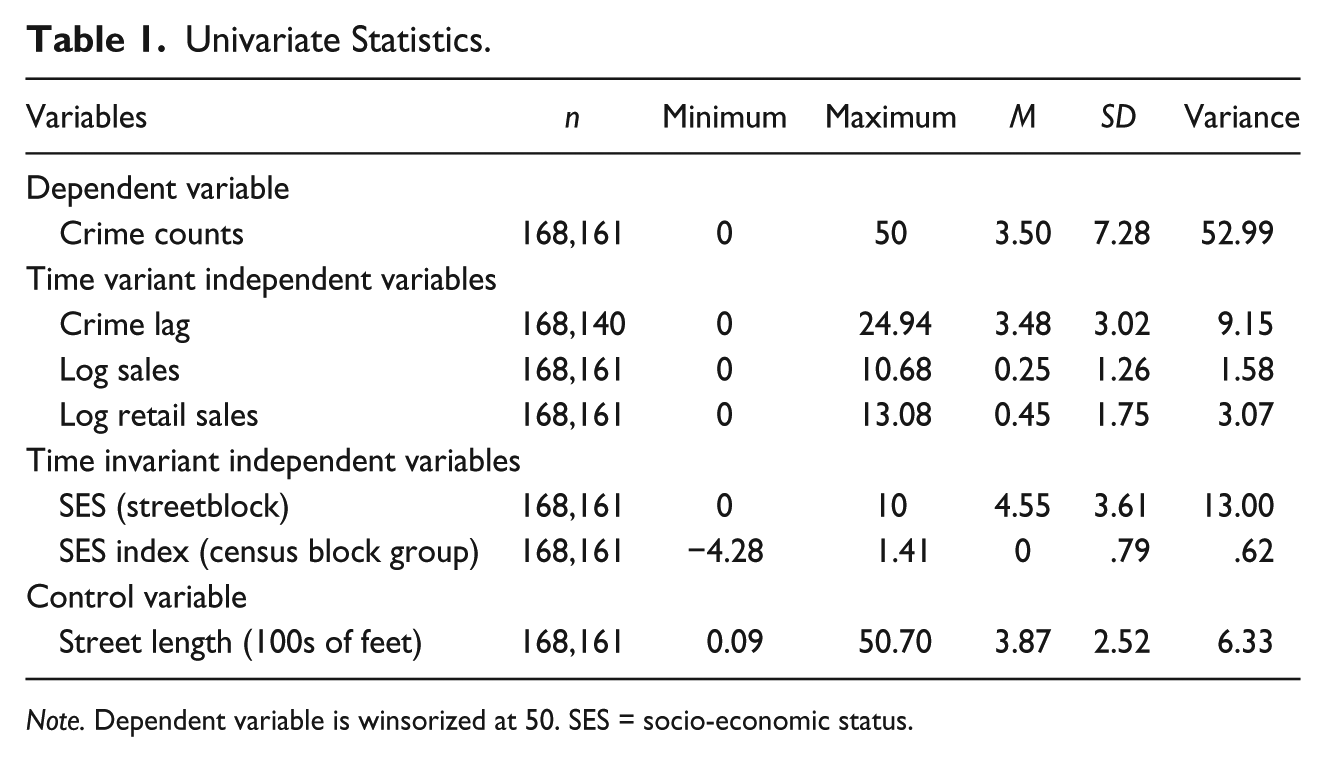
Note. Dependent variable is winsorized at 50. SES = socio-economic status.
Independent variable: Sales volume from convenience stores and fast food restaurants
Weisburd and colleagues used the InfoUSA database for all businesses in Seattle and successfully geocoded 87.8% of those (Weisburd et al., 2012). There is no one identified minimum acceptable hit rate for geocoding such facilities when they are to be used as crime predictors, but the geocoding hit rate is at least above the minimum acceptable hit rate for crime geocoding (Ratcliffe, 2004). Businesses associated with the North American Industrial Classification System codes for convenience stores and fast food restaurants 3 appeared on 1,197 (6%) of streetblocks. Revenue data (divided by $1,000) from these facilities were available for every other year from 1998 through 2004. Interpolated revenue numbers were used for odd numbered years by averaging data 1 year before and 1 year after the missing year. 4 Sales volume data for each type of facility were summed together, were natural log transformed after adding 1, and then were grand mean centered.
Modeling time
Linear temporal trends were captured with a centered linear time variable (1998 = −3; 2004 = +3). A centered quadratic time variable (1998 = 9; 2001 = 0; 2004 = 9) captured whether shifts in crime, linked to time, sped up or slowed down later in the period.
Control variable: Spatial lag
The Global Moran’s I of deviance residuals after empirical Bayes mean adjustment was .125 (pseudo-p < .001). A spatial lag variable was created to control for this spatial autocorrelation by averaging crime count values of all streetblocks within a quarter mile radius. Three streetblocks did not have a quarter mile neighbor and were dropped from the analysis due to listwise deletion.
Control variable: other commercial facilities (retail businesses)
To control for the effects of other commercial facilities beyond the two types of interest here, sales volume from retail establishments on each streetblock was included. The types of retail businesses used to generate this variable were identical to those used by Weisburd et al. (2012) and did not include fast food restaurants or convenience stores. 5 Data were available for every other year in the time period (1998-2004). Interpolated values were calculated by averaging data for the year before and the year after the missing time period. Values are in 1,000s of dollars.
Time Invariant Variable
Control variable: SES
Weisburd et al. (2012) captured SES using residential property value in 2004 reported by the Seattle Planning Department and the King County Tax Assessor’s website. To create this variable, Weisburd and colleagues (2012)
separately rank averaged property values for single-family housing and multifamily housing, assigning each street a rank between 1 and 10 based on the average values of properties. . . . Finally, the ranks of each street on the single-family property value and multifamily property value were then weighted by the percentages of the type of housing of a given street and then combined to create a property value index to represent the SES of a street. (Weisburd et al., 2012, p. 230)
The final index ranges from 0 to 10. Of the 20,023 streetblocks, 6,772 did not have any residential property; these places were coded as 0.
We created a supplemental variable to measure SES using census data available through the American Community Survey. Variables measuring household income and median home values were downloaded at the census block group level. The SES index was generated using a process identical to that used by Taylor, Ratcliffe & Perenzin (2015). This process is detailed in the online appendix for that publication. Cronbach’s alpha for the final index using data from Seattle was .803. This variable correlated in a significant and positive way with the streetblock level variable created by Weisburd et al. (2012).
Analyses were run using both versions of the SES variable, separately. As the significance patterns of these analyses were the same, we report the results from models that use the streetblock-level SES variable created by Weisburd et al. (2012).
Models
The outcome variable reflects annual crime counts at the streetblock level for the years 1998 through 2004. This count outcome was analyzed with a multilevel negative binomial model with years nested within streetblocks (Raudenbush & Bryk, 2002). Given that streetblock lengths ranged from 9 feet to 5,069 feet, street length was used as the exposure variable. All independent variables were grand mean centered. Random effects of the linear time variable were permitted to allow each streetblock to have its own pathway through time (Raudenbush, 2005). In the multilevel model, streetblock years were the Level 1 unit and streetblocks were the Level 2 unit. To control for correlation within streetblocks over time, all models were specified with robust standard errors in recognition that within-streetblock residuals may not have been independent. Correlations between the random effects were allowed by specifying an unstructured covariance structure. Finally, impacts of streetblock context—SES—on the slope of linear time were explored. Such links could provide more insights into the forces driving the spatio-temporal interaction in streetblock crime levels.
On the way to the full model, intermediate models included the null, or ANOVA, model to verify significant spatial variation in streetblock crime counts; a baseline model with fixed effects for linear time, quadratic time, spatial lag and sales volume and random intercepts for each streetblock (baseline model); a subsequent model that adds random effects for linear time permitting each streetblock its own pathway through time (Model A); and a final model adds the fixed effects of SES and retail sales from other types of commercial facilities (Model B).
Results
The null model (results not shown) revealed 71.8% of the variation in crime counts was between streetblocks whereas 28.2% was over time within streetblocks. The intraclass correlation coefficient (.867) revealed high within-streetblock consistency over years in crime counts.
Sales Volume
In the full model (Model B in Table 2), higher sales volume streetblocks, on average over the period, experienced higher expected crime counts (β = .071; p < .01; Incident Rate Ratio = 1.074). Streetblocks with higher than average (logged) sales from convenience stores and fast food restaurants experienced higher expected crime counts. Specifically, a one-unit increase in the average (logged) sales linked to an expected crime count that was 7.4% higher.
Results.
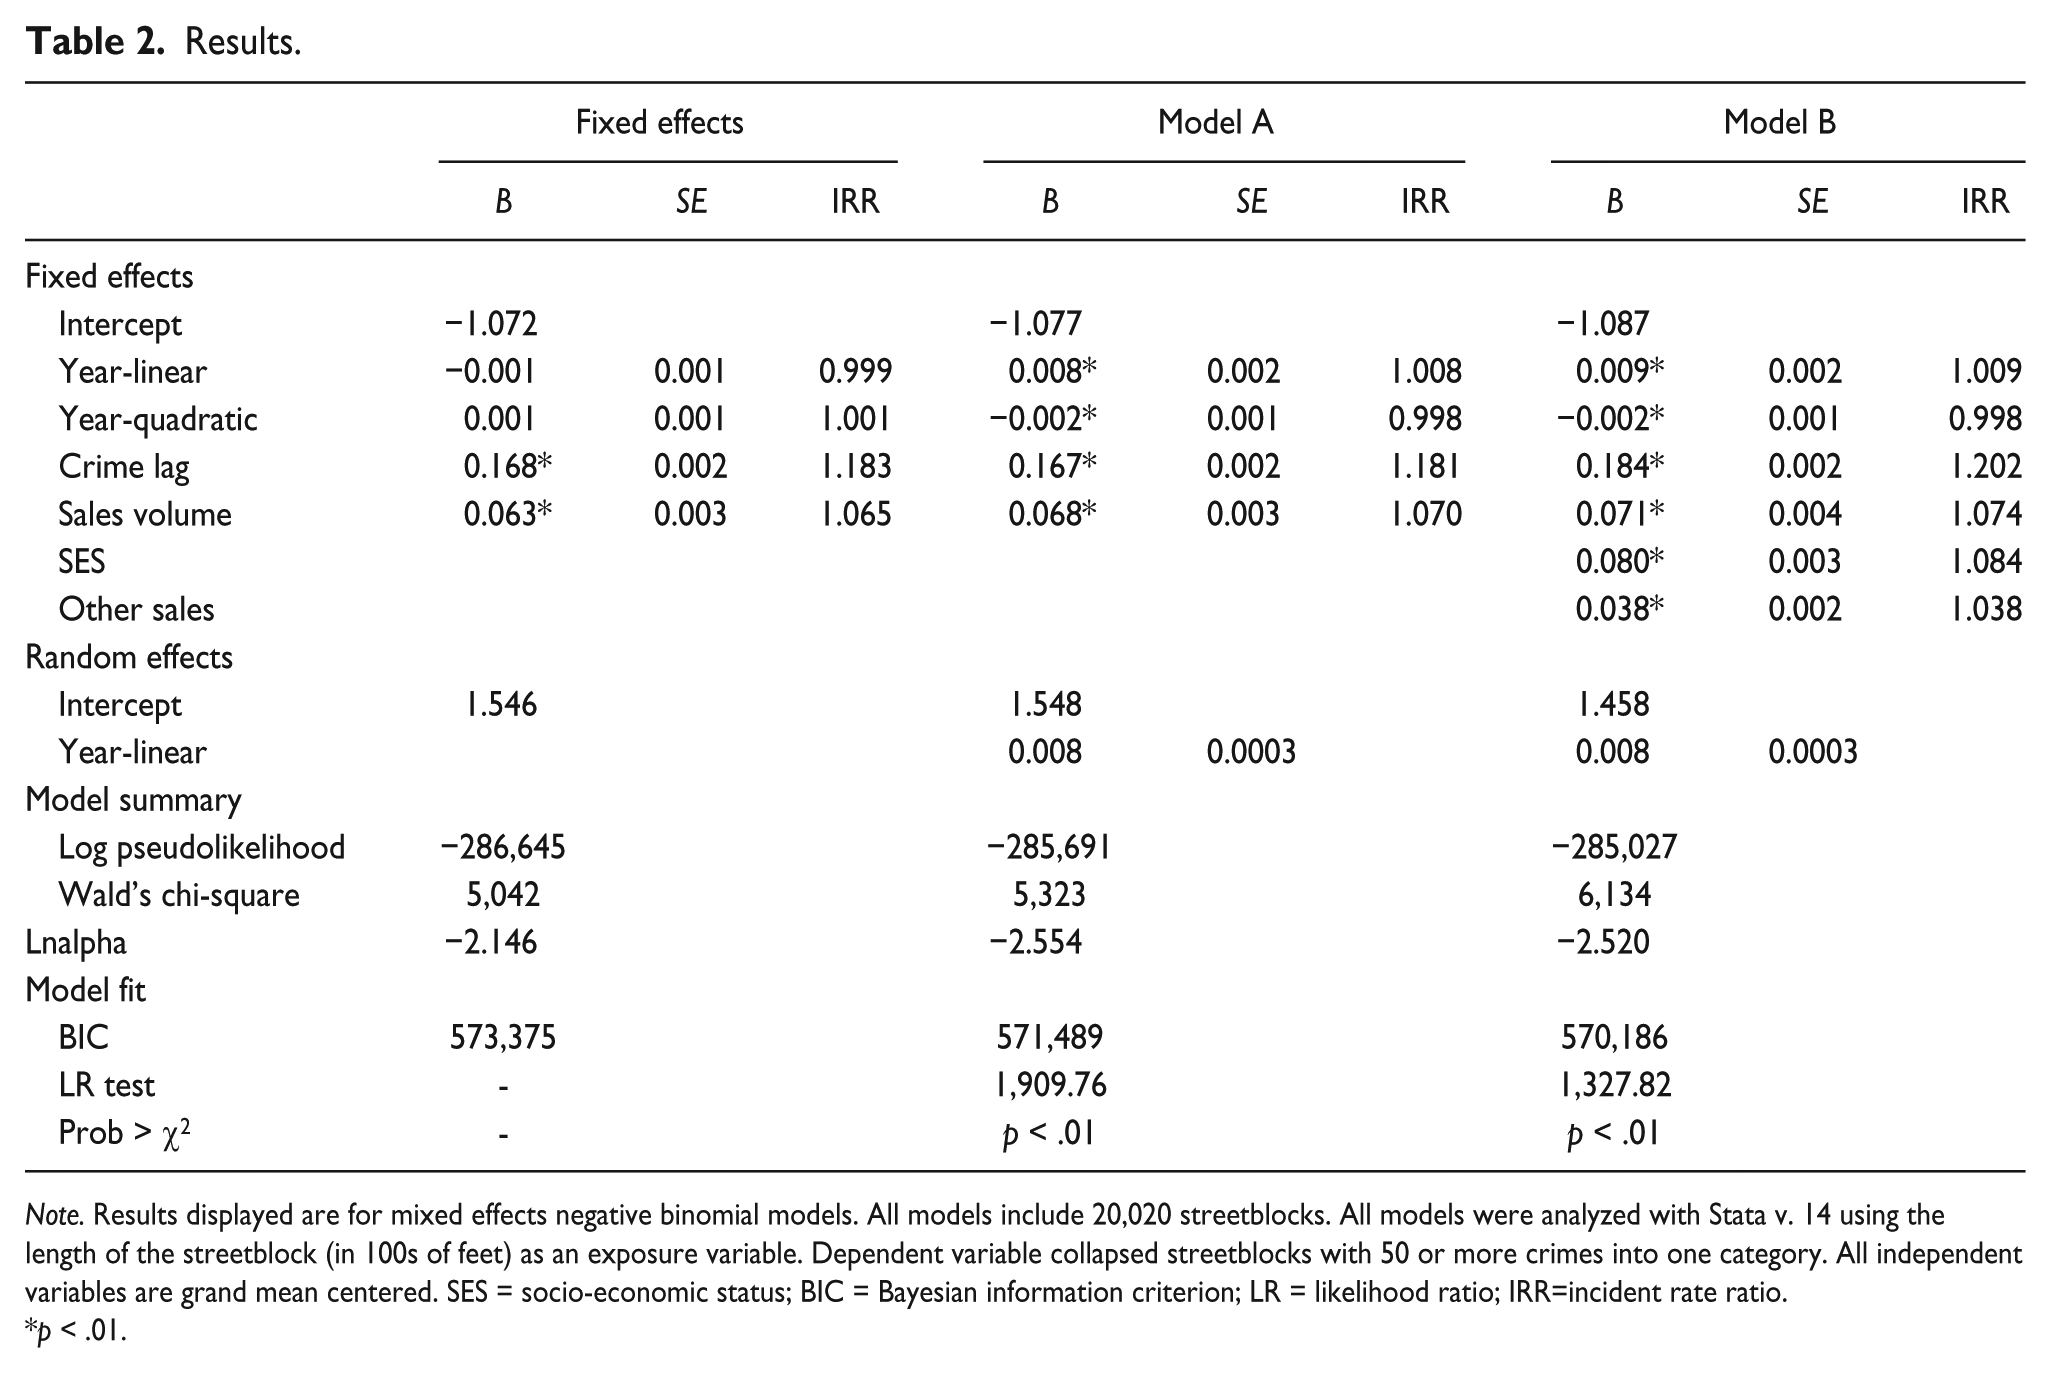
Note. Results displayed are for mixed effects negative binomial models. All models include 20,020 streetblocks. All models were analyzed with Stata v. 14 using the length of the streetblock (in 100s of feet) as an exposure variable. Dependent variable collapsed streetblocks with 50 or more crimes into one category. All independent variables are grand mean centered. SES = socio-economic status; BIC = Bayesian information criterion; LR = likelihood ratio; IRR=incident rate ratio.
p < .01.
Temporal and Spatio-Temporal Effects
Looking at the fixed effect of linear time, crime counts on streetblocks were relatively stable over the 7-year period, after controlling for crime nearby and the influence of retail sales (β = .009; p < .01, Incident Rate Ratio = 1.009, for the linear trend in Model B). The random effect of this linear crime trend, however, varied widely across locations. The random effect for the linear trend proved significant (ψ = .008, SE of ψ = .0003). This means that the long-term temporal trend played out in different ways across places. Although some streetblocks experienced overall decreases in crime over the time period, others experienced overall increases.
But were these differential impacts of time passing playing out in a spatially patterned or spatially random fashion? If the former was observed, it would suggest a spatio-temporal interaction, namely, that some subregions, or clusters of streetblocks, in Seattle were experiencing moderate changes in crime over the entire period, whereas other subregions were experiencing more drastic changes. This would speak to the extra-streetblock conditioning principle in micro-ecology (Taylor, 1997). If the latter was observed, the random effect of passing time on crime was perhaps being shaped largely by streetblock characteristics themselves.
The degree of spatial clustering of the linear temporal crime trends was analyzed using the Global Moran’s I. The value was significant (I = 0.011, z score = 11.76, pseudo-p < .01). Streetblocks with high–positive slope values clustered near other streetblocks experiencing the same trend. Similarly, streetblocks experiencing large negative slopes clustered together as well.
In an attempt to explain this spatio-temporal interaction, the effects of SES and retail businesses on the streetblock were examined. The SES variable and the retail sales volume variable were used to predict the slope coefficient for the linear temporal trend. Results (not displayed) demonstrate that both variables do exert a statistically significant negative effect on the slope coefficients; however, the SES variable is only significant when measured at the streetblock level using the Weisburd et al. (2012) measure. Using the SES variable measured at the census block group level, the coefficient was negative but did not reach statistical significance.
Model Fit
Likelihood ratio (LR) tests 6 and Bayesian information criterion (BIC; Raftery, 1995) 7 comparison values are used to describe model fit (LR test) while controlling for model complexity (BIC) across models (see Table 2). LR tests indicated if additional random slope coefficients were merited. The LR test of the random slope for linear trend considers the null hypothesis that the variance of this random effect is zero, meaning there is no significant variation in linear temporal crime trends between streetblocks (Rabe-Hesketh & Skrondal, 2012). The LR test comparing the mixed effects model with the fixed effects model proved to be statistically significant, thereby rejecting the null hypothesis that the effect of the random slope coefficient is zero. Furthermore, a sizable drop in BIC between these two models suggests the model improvement is worthwhile even after taking additional model complexity into account (see Raftery, 1995).
Second, LR tests and comparisons of BIC values were also used to examine if including the two control variables in the model resulted in an improvement in model fit. In the full model, we find that the addition of the control variables—SES and retail businesses—substantially lowered the BIC value (Model A to Model B in Table 2) and generated a significant LR test. These two additional variables resulted in a better fitting model, even when considering greater model complexity.
In sum, these findings identify a significant positive relationship between sales volume—for convenience stores and fast food restaurants only—and crime counts that remains significant after controlling for the customized crime trend on each streetblock. Spatial analyses reveal the random coefficients of linear crime trends are spatially clustered at the streetblock level identifying the presence of a spatio-temporal interaction in the data. These random slope coefficients are conditioned by the SES variable and the retail sales volume variable.
Discussion
The current study examined the effects of human activity associated with convenience stores and fast food restaurants on crime after controlling for the unique crime trend of each streetblock and local context. Multilevel modeling was used to examine these relationships using temporally nested data at the streetblock level. Using sales volume from these businesses, we were able to identify a statistically significant positive relationship between fast food restaurants and convenience stores and streetblock crime counts in Seattle from 1998 to 2004. This relationship holds even after controlling for SES, human activity generated by retail businesses, and local crime trends. This study also found evidence that individual crime trajectories of streetblocks are spatially patterned in a statistically significant way at both global and local levels. These findings corroborate with and extend prior research.
This study found evidence that the influence of sales volume on crime counts remains significant even after controlling for local SES and the presence of retail commercial facilities. In other words, sales volume generated by fast food restaurants and convenience stores is not simply picking up the effect of economic status or the degree to which a streetblock functions as a “busy place” (Jacobs, 1961) more generally; it is generating a unique effect that is separate from these two ideas.
This study also found that streetblocks experiencing similar crime trends over time were spatially clustered. The subregional patterning suggests something is going on above the streetblock level that is at least partially driving crime patterns. Theory would suggest this patterning could be driven through a process of exposure or a process of diffusion. The process of exposure suggests that characteristics that foster crime—low SES for instance—may be spatially and temporally patterned in a way that aligns with high levels of crime.
We relied on two measures of residential SES in this study; significance patterns generated by each variable in the model sequence were identical. However, when we used SES to predict the linear crime trend (results not shown), the streetblock measure of SES reached statistical significance; both variables, however, operated in the expected direction (negative). This means that high-SES locations experienced decreases in crime trends whereas low-SES locations experienced increases in crime over the seven year time period. These results are in line with a process of exposure.
Furthermore, the positive coefficient for the spatial lag variable was statistically significant. This means that crime counts on streetblocks were partially driven by crime counts on nearby streetblocks. Furthermore, this variable remained significant after allowing the slope coefficient for each streetblock to vary. The statistically significant spatial lag variable lends support for a temporally persistent diffusion process driving crime patterning.
Implications
Policy
The findings of this study can be useful for both city planners and law enforcement agencies. This study found evidence to support the classification of fast food restaurants and convenience stores as crime generators. A similar relationship has been found between bars and crime (Groff, 2011). In response to this, local ordinances have been implemented to restrict the hours of operation for bars and limit the density of bar concentrations. Some have suggested similar ordinances be implemented for fast food restaurants to improve aspects of public health related to nutrition (Ashe, Jernigan, Kline, & Galaz, 2003); the results of this study suggest these ordinances could have the added benefit of overall crime reduction.
Law enforcement agencies would also benefit from the findings of this study to inform resource deployment. Within the city of Seattle, some streetblocks were getting worse—experiencing more crime—over time. These types of places, however, proved to be spatially clustered. It is possible that these trends persisted into later years. Using this information to forecast ahead to future years, police agencies can target resources in these micro-areas that are experiencing higher than average increases in crime to prevent future crimes from occurring. This resource deployment could involve setting up foot beat patrols, partnering with local community groups to set up a neighborhood watch program, or working with local business associations.
Theory
Spatial patterning was detected in the unique crime trajectories of streetblocks over a seven year period. The spatial lag variable proved to be a statistically significant predictor of local crime counts. These results support the diffusion process as a possible driver of this clustering that persists over time. The process of exposure, as applied to structural characteristics that link to crime, also aligns with the finding that SES was a statistically significant variable that conditions the slope of the linear trend variable. It is possible that other types of exposure, such as exposure to other types of crime generators for instance, may also be responsible for this dynamic. Examining the exposure thesis through this lens could be explored in future research.
Limitations and Future Research
Despite the significant contributions of the current study, some limitations should be noted. One weakness includes the inability for our study to distinguish between stores that are open 24 hours a day, 7 days a week and stores that are not. Higher sales volume from stores that are open 24 hours a day, 7 days a week may not actually be an indicator of higher levels of human activity if the revenue is spread out over a longer period of time. For example, a store that never closes has 168 hr per week to earn revenue. Another store that closes overnight from 11 p.m. to 6 a.m. is only open 119 hours per week. If both of these stores have the same revenue for a given time period, the store that is open less will have higher concentrations of human activity compared with a store that is open longer. Future research should control for the hours of operation to model foot traffic in a more precise way.
Another limitation of the current study is the static measure for SES. SES was measured using an ordinal variable generated that was based on a weighted residential property value for the year 2004 at the streetblock level. Census data from 2000 and 2010 indicate the median home value increased from US$259,600 in 2000 to US$456,200 in 2010. Although it is likely that home values rose uniformly throughout the city of Seattle during this time period, it is possible that some streetblocks experienced significant increases in home values over the study period (1998-2004) whereas other streetblocks experienced decreases. Although it is unlikely that home values changed drastically during the four year period after the census data were published, the possibility of error in measurement should be noted. Future research would benefit from a dynamic measure of SES and other contextual variables that account for temporal variation throughout the study period.
Conclusion
The current study examined the influence of revenue from convenience stores and fast food restaurants on street-level crime counts in Seattle. In congruence with the existing theoretical literature, we found that streetblocks with greater sales volume experienced higher crime counts. In addition, we found statistically significant unique trajectories at the streetblock level, and that these trajectories are spatially patterned in a significant way. The statistically significant spatial lag variable lends support for a temporally persistent diffusion process driving this spatio-temporal patterning.
This study adds to the existing theoretical and empirical literature examining the relationship between human activity patterns and crime at the streetblock level. Environmental criminologists propose that crime is dependent on human activity. With the use of revenue data to model human activity, the findings of the current study demonstrate the crime-generating potential of particular types of commercial facilities do link to crime at the streetblock level.
Footnotes
Declaration of Conflicting Interests
The author(s) declared no potential conflicts of interest with respect to the research, authorship, and/or publication of this article.
Funding
The author(s) received no financial support for the research, authorship, and/or publication of this article.