
Abstract
Police shootings have received considerable attention recently. While official data have often been used to capture police use of lethal force, “unofficial” databases have been developed to document lethal force patterns throughout the United States. Thus, it is now possible to systematically compare databases, exploring racial differences and potential causes, which is important given longstanding criticisms of official records. Here, we examine police shootings using Mapping Police Violence and Supplemental Homicide Reports data and investigate the impact of commonly used structural predictors on race-specific police shootings. Significant differences are revealed across official and unofficial databases, particularly by race. We conclude that the data used to estimate police shootings matter, which has key implications for future work on this important topic.
Introduction
In recent years, Americans have witnessed numerous deaths resulting from the application of lethal force employed by those sworn to protect and serve. When considering the police use of deadly force, some scholars argue that racial minorities, especially Black Americans, disproportionately experience death at the hands of the police with regard to the size of their population in the United States (Durán, 2016; Hirschfield, 2015; Lersch & Mieczkowski, 2005; Nix, Campbell, Byers, & Alpert, 2017; Sorensen, Marquart, & Brock, 1993). However, the use of population size to measure disproportionality has been questioned because racial group representation may not include relevant information, such as the nature of police–civilian interactions and crime (Nix et al., 2017). In fact, a recent study finds that members of racial minority groups were less likely to attack the officer(s) or other civilians and more likely to be unarmed when they were shot than Whites (Nix et al., 2017). Debate continues around how to best capture racial disproportionality, the role of implicit bias, and which determinants are more relevant to the use of lethal force by police.
Part of the issue may lie in the fact that the United States does not have a national database that systematically collects these incidents (Fyfe, 2002). Criminologists and other scientific researchers have relied on official databases to estimate lethal force incidents: Supplemental Homicide Reports (SHR), National Vital Statistics System (NVSS), or the Death in Custody Reporting Program (Campbell, Nix, & Maguire, 2017; Nix et al., 2017; Ozkan, Worrall, & Zettler, 2017). Only recently, in response to several high-profile media reports of lethal force incidents, new databases have been created to systematically capture these events. This development offers an important opportunity to explore data from two separate data sources—one official and one “unofficial”—both providing information on the nature of these lethal encounters with the police. This study offers a novel approach to systematically examining data on the racialized nature of lethal force in an effort to investigate both the level and potential causes of police shootings. That is, in addition to comparing estimates of police shootings for Blacks and Whites captured in Mapping Police Violence (MPV) and SHR data throughout the United States, we draw heavily on several macro-level studies of lethal force and other seminal structural analyses to also investigate the impact of structural predictors on race-specific police shootings by data source.
Official data used to estimate lethal force have been widely criticized as inaccurate and limited by classification errors and underreporting, especially the SHR and NVSS (Fyfe, 2002; Nix et al., 2017; Williams, Bowman, & Jung, 2016). These critiques have become more problematic considering recent accounts of police shootings of Black Americans across the United States. To provide a more accurate picture of lethal force, three comprehensive, “unofficial” databases have emerged: MPV, The Counted (collected by The Guardian), and Fatal Force (collected by the Washington Post). Importantly, researchers have begun assessing the validity of these databases and have compared media-based and crowdsourcing efforts to official sources of homicide and lethal force (Feldman, Gruskin, Coull, & Krieger, 2017; Ozkan et al., 2017; Parkin & Gruenewald, 2017; Williams et al., 2016). So far, validation efforts have documented general support for media-based and crowdsourcing data collection efforts as viable alternatives (Feldman et al., 2017; Ozkan et al., 2017; Parkin & Gruenewald, 2017; Williams et al., 2016).
In our efforts to compare data sources in regard to racial differences in police shootings and offer a look into which macro-level predictors influence race-specific police shootings, we address three research questions. First, are there differences in police shootings by racial group when estimated by official and unofficial data sources? Second, does the impact of structural predictors on police shootings differ across racial groups? Third, are there significant differences found in the structural predictors that influence lethal force when police shootings are measured by an official (SHR) and an “unofficial” (MPV) source of data? With growing attention by scholars and the public on lethal outcomes by police, we provide a timely account of police actions and race relations. In addition, the advent of new databases provides the opportunity of moving beyond the confining limitations of official data, which may also provide alternative recommendations regarding public policy and police practices. Studying police use of force, especially when lethal, is of utmost importance given the negative impact exposure to these events can have on civic engagement in Black neighborhoods (Desmond, Papachristos, & Kirk, 2016). Finally, studying police shootings is also imperative as lethal force has remained fairly consistent despite high-profile incidents that resulted in widespread public outcry, especially when considering the shooting of Michael Brown in Ferguson, Missouri (Campbell et al., 2017).
Measuring Police Shootings
As noted previously, we focus on two separate databases in this study to reveal potential differences in estimates when results rely on official versus “unofficial” sources of police shootings. The official data used here come from the FBI’s SHR which is constructed from monthly reports compiled by individual law enforcement agencies (Regoeczi & Banks, 2014). The SHR provides homicide data, including details about the date and location, victim and offender demographics, the weapon used, incident circumstances and situational characteristics, and the relationship between the victim(s) and offender(s) (Regoeczi & Banks, 2014). There are several limitations to these data though, and these issues have persisted for many years (Fyfe, 2002; Hirschfield, 2015). For example, SHR does not include homicides at the federal level and its data collection is voluntary in nature, which contributes to inconsistencies in police agency submissions and the possibility of misclassified information (Hirschfield, 2015; Regoeczi & Banks, 2014; Williams et al., 2016). The definition that is used to denote these incidents is also problematic. Specifically, the circumstances that correspond to police lethality are reported as justifiable and are, specifically, labeled as “felons killed by police,” which is restrictive and excluding of other circumstances (Fyfe, 2002; Hirschfield, 2015). In fact, Williams et al. (2016) reported on an open-source content analysis in which they discovered that approximately 30% to 45% of incidents involving citizens killed by the police are not reported in official databases.
Due to the criticisms of official data estimations of police use of lethal force, new databases constructed through crowdsourcing and media accounts “have provided far more comprehensive data than the official data sources maintained by the U.S. government” (Campbell et al., 2017, p. 9). They include MPV, The Counted, and Fatal Force. Some similarities exist in data collection efforts across the three data sources, such as all three use other data sources from the Internet, articles from the news, and some records directly from the police (Campbell et al., 2017). However, The Counted and MPV also rely on crowdsourcing efforts to collect data, while Fatal Force does not (Campbell et al., 2017). Nonetheless, total cases of lethal force are relatively consistent across these three data sources. For example, Campbell et al. (2017) noted that in 2015 Fatal Force reported 990 incidents, The Counted reported 1,146 incidents (1,019 when limited to just shootings), and MPV reported a total of 1,210 incidents (1,034 when limited to just shootings) of lethal force. The differences that are apparent from these estimates likely stem from the definitions used to capture lethal force. For example, Fatal Force only reports on incidents that involve shootings by on-duty police officers (Campbell et al., 2017; Nicholson-Crotty, Nicholson-Crotty, & Fernandez, 2017; Williams et al., 2016). Given this, we use MPV as the source for comparison with SHR in this study.
MPV has been collecting data on the use of lethal force since 2013, and this database is updated as incidents occur. There are three overseers who have held varying roles in policy analysis, data science, education, activism, youth leadership, and so on, with a special emphasis on working within communities of color for racial justice and equity (MPV, 2017; for more information on the “Planning Team,” see http://mappingpoliceviolence.org/planning-team/). Importantly, MPV data “has been meticulously sourced from the three largest, most comprehensive and impartial crowdsourced databases on police killings in the country: FatalEncounters.org, the U.S. Police Shootings Database and KilledByPolice.net” (MPV, 2017; see the “About the Data” section of the website) The use of KilledByPolice.net by MPV is important as “it was fact-checked by Nate Silver’s FiveThirtyEight research organization” (Nicholson et al., 2017). Moreover, those who run the MPV data have also conducted some of their own research to add more quality and completeness to the data. This includes going through social media outlets, obituaries, criminal records databases, and police reports. The MPV website also notes that the Bureau of Justice Statistics (BJS) has released a report that estimated arrest-related deaths at similar counts to the data they collected between June 2015 and May 2016. Specifically, the BJS reported “1,348 potential arrest-related deaths” through reviews of open-source information and surveys of law enforcement and medical examiner/coroner information to confirm the deaths. In comparison, between these two time points, the MPV data indicate 1,179 deaths involving the police (BJS, 2016; MPV, 2017).
Overall, these data have been collected, and continue to be collected, in hopes of providing more transparency and accountability for police departments. It is also their goal that these data will help to lead to the end of police lethality within the United States. For conceptual purposes, these data go beyond SHR, and Fatal Force, regarding the scope of incidents included in its collection process. Specifically, they define incidents of lethal force as “a case where a person dies as a result of being chased, beaten, arrested, restrained, shot, pepper-sprayed, tasered, or otherwise harmed by police officers, whether on-duty or off-duty, intentional or accidental” (MPV, 2017). However, to ensure comparability with the data from SHR, we limit our study to only deaths resulting from police shootings. In the end, this study relies on MPV, which has only been done in one other study that we are aware of (see Nicholson et al., 2017), as a comparison to the SHR data as they both have data for 2013 and 2014—Fatal Force and The Counted have only been collecting since 2015 (Campbell et al., 2017)—and because of MPV’s improvements on the data collection efforts regarding police shootings.
To illustrate differences between these databases, Table 1 displays the top 10 states for Blacks and Whites killed in police shootings by total count and rate over a 2-year period (2013 and 2014). This table shows that the rates of Black victimization from MPV are consistently higher than figures reported in the SHR. While this pattern is found among Whites as well, the Black rate differences are larger across data sources than those found among Whites. For instance, while Texas is ranked second across both races and databases, its counts and rates are not consistent, and the rate differences are more pronounced among Blacks killed in police shootings. Specifically, SHR indicates that 28 (0.48) Blacks and 71 (0.31) Whites were killed by the police, whereas MPV indicates 39 (0.68) and 72 (0.32), respectively. Besides this, other inconsistencies are present, such as Georgia indicating 15 (0.26) Black deaths in the SHR but 21 (0.36) according to MPV. It is also important to note the discrepancies between SHR and MPV data regarding Whites killed by police in California and Arizona. That is, according to the SHR data, there are several more Whites shot and killed by police in these two states than the MPV data reports. This overestimation of Whites could likely stem from the reporting of Hispanics as White, which has been a longstanding problem in official databases (Steffensmeier, Feldmeyer, Harris, & Ulmer, 2011). Given these findings, we attempt to systematically examine these data sources on the racialized nature of police shootings in an effort to investigate reproducibility of findings in criminology. Below we offer a discussion of the data and methods used to estimate the impact of structural predictors on race-specific police shootings when measured by SHR and MPV. The key findings and conclusions follow.
Top 10 States With the Most Police Shootings by Racial Group and Data Source—Counts and (Rates) Are Reported. a
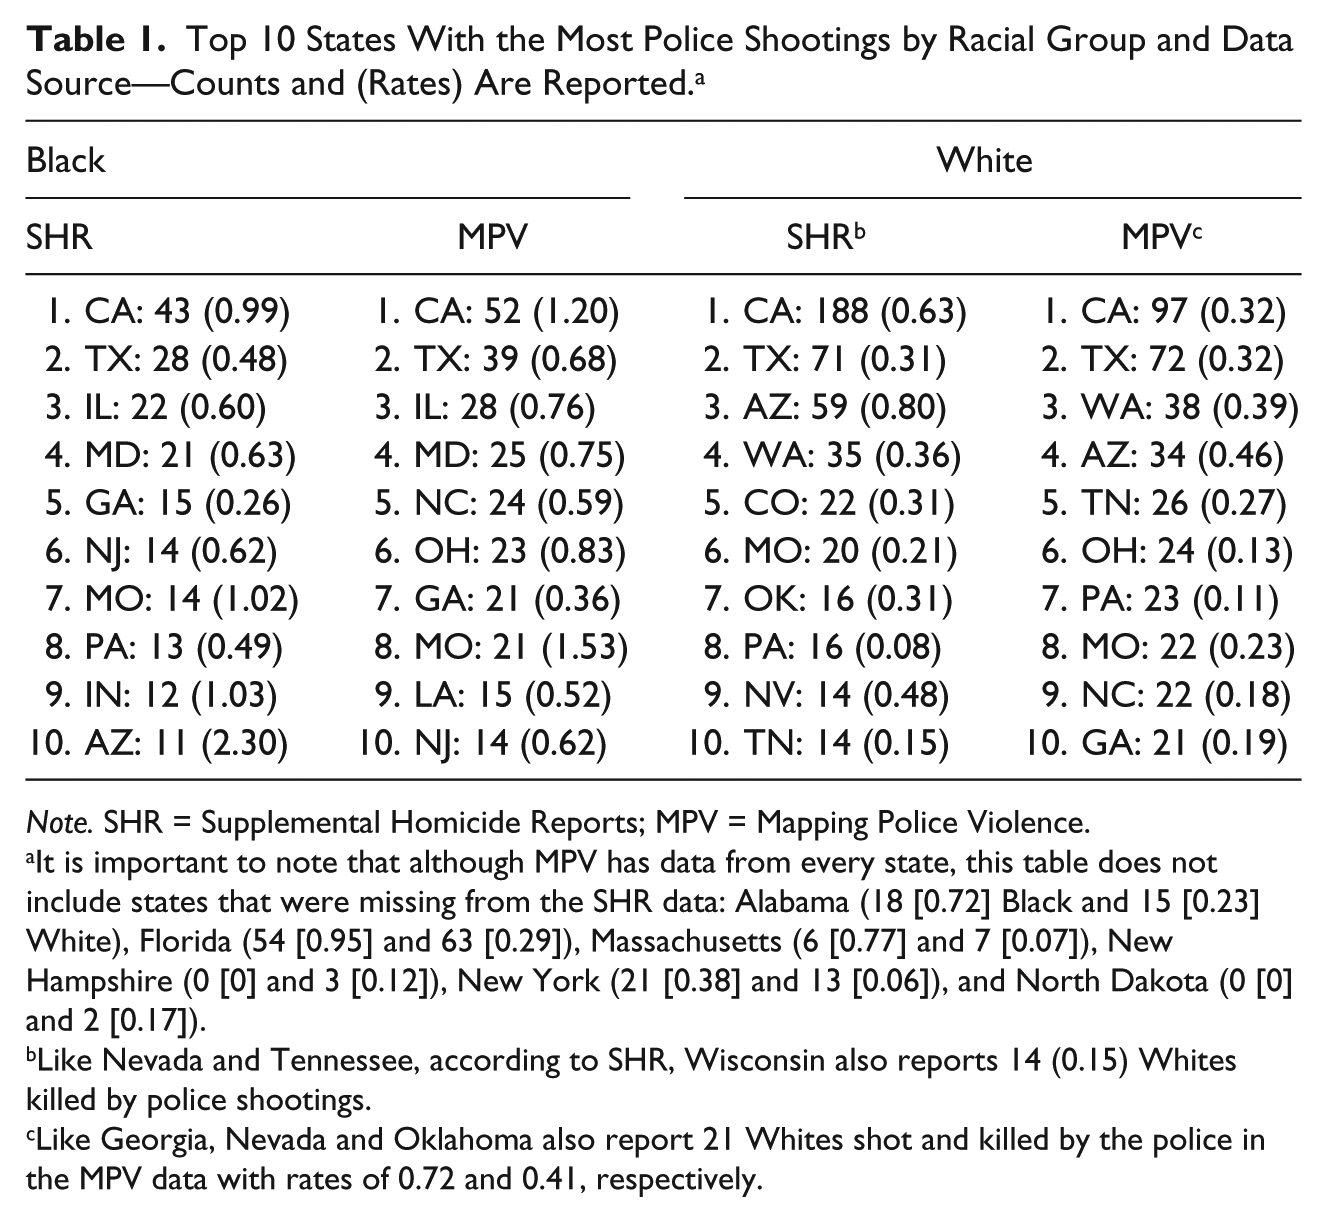
Note. SHR = Supplemental Homicide Reports; MPV = Mapping Police Violence.
It is important to note that although MPV has data from every state, this table does not include states that were missing from the SHR data: Alabama (18 [0.72] Black and 15 [0.23] White), Florida (54 [0.95] and 63 [0.29]), Massachusetts (6 [0.77] and 7 [0.07]), New Hampshire (0 [0] and 3 [0.12]), New York (21 [0.38] and 13 [0.06]), and North Dakota (0 [0] and 2 [0.17]).
Like Nevada and Tennessee, according to SHR, Wisconsin also reports 14 (0.15) Whites killed by police shootings.
Like Georgia, Nevada and Oklahoma also report 21 Whites shot and killed by the police in the MPV data with rates of 0.72 and 0.41, respectively.
Method
Units of Analysis
While we examine state-level data in this study, we are aware of the potential limitations of this approach. For example, using states as our unit of analysis may “mask heterogeneity within much smaller units of analysis, such as cities or census blocks” (Klinger, Rosenfeld, Isom, & Deckard, 2015; Nix et al., 2017, p. 314). However, even cities have been cited as problematic regarding macro-level studies (Jacobs & O’Brien, 1998; Klinger et al., 2015). Ultimately, we pursue a state-level analysis for a couple of reasons. First, much of the previous research of deadly force has been conducted at the state or city level; thus, we wanted our analysis to be consistent with previous studies. In addition, as we are exploring the differences of two different databases which, to our knowledge, has not been done before, we chose states as the unit of analysis because this is a more conservative approach. Future studies should conduct research of deadly force at smaller units of analysis, like Klinger et al.’s (2015) study of one city and Holmes, Painter, and Smith’s (2018) study of cities across the United States.
Dependent Variables
Both SHR and MPV provide estimates of lethal force; however, some modifications are made to increase comparability for this study. First, we limit the dependent variables to race-specific measures of police shootings of Blacks and Whites, similar to other state-level studies of lethal force (Jacobs & O’Brien, 1998; Legewie & Fagan, 2016). Second, as SHR data are missing some states, these states were removed from the MPV data as well. That is, the SHR is limited in sample by providing data for only 44 states out of 50 plus the District of Columbia. Finally, our measures of race-specific police shootings were combined over a 2-year period—2013 and 2014—for both data sets, resulting in four dependent variables: Black- and White-specific counts of police shootings by MPV and SHR data sources.
As displayed in Table 2, during these 2 years, SHR reported 267 Black victims and 611 White victims, whereas MPV reported 419 Blacks and 724 Whites killed in police shootings. Differences in the rates across data sources are revealing as well. Table 2 shows that the SHR estimates an average of 5.93 Blacks killed by police shootings in contrast to MPV’s average of 9.31. Among Whites killed by the police, differences across the data sources are also present but they are less pronounced. The difference between SHR and MPV averages for Whites is 13.58 and 16.09, respectively. Overall, given the notable differences in estimates by data source and level of disparities by racial group, an analysis of the MPV data is an important point of comparison with the SHR because it provides a fuller account of killings by the police in the United States. Even when limiting the analysis to police shootings in the MPV data, the SHR data appear to fall short in reporting these deaths, particularly among Blacks compared with Whites.
Descriptive Statistics With Means and (Standard Deviations) for All Measures.
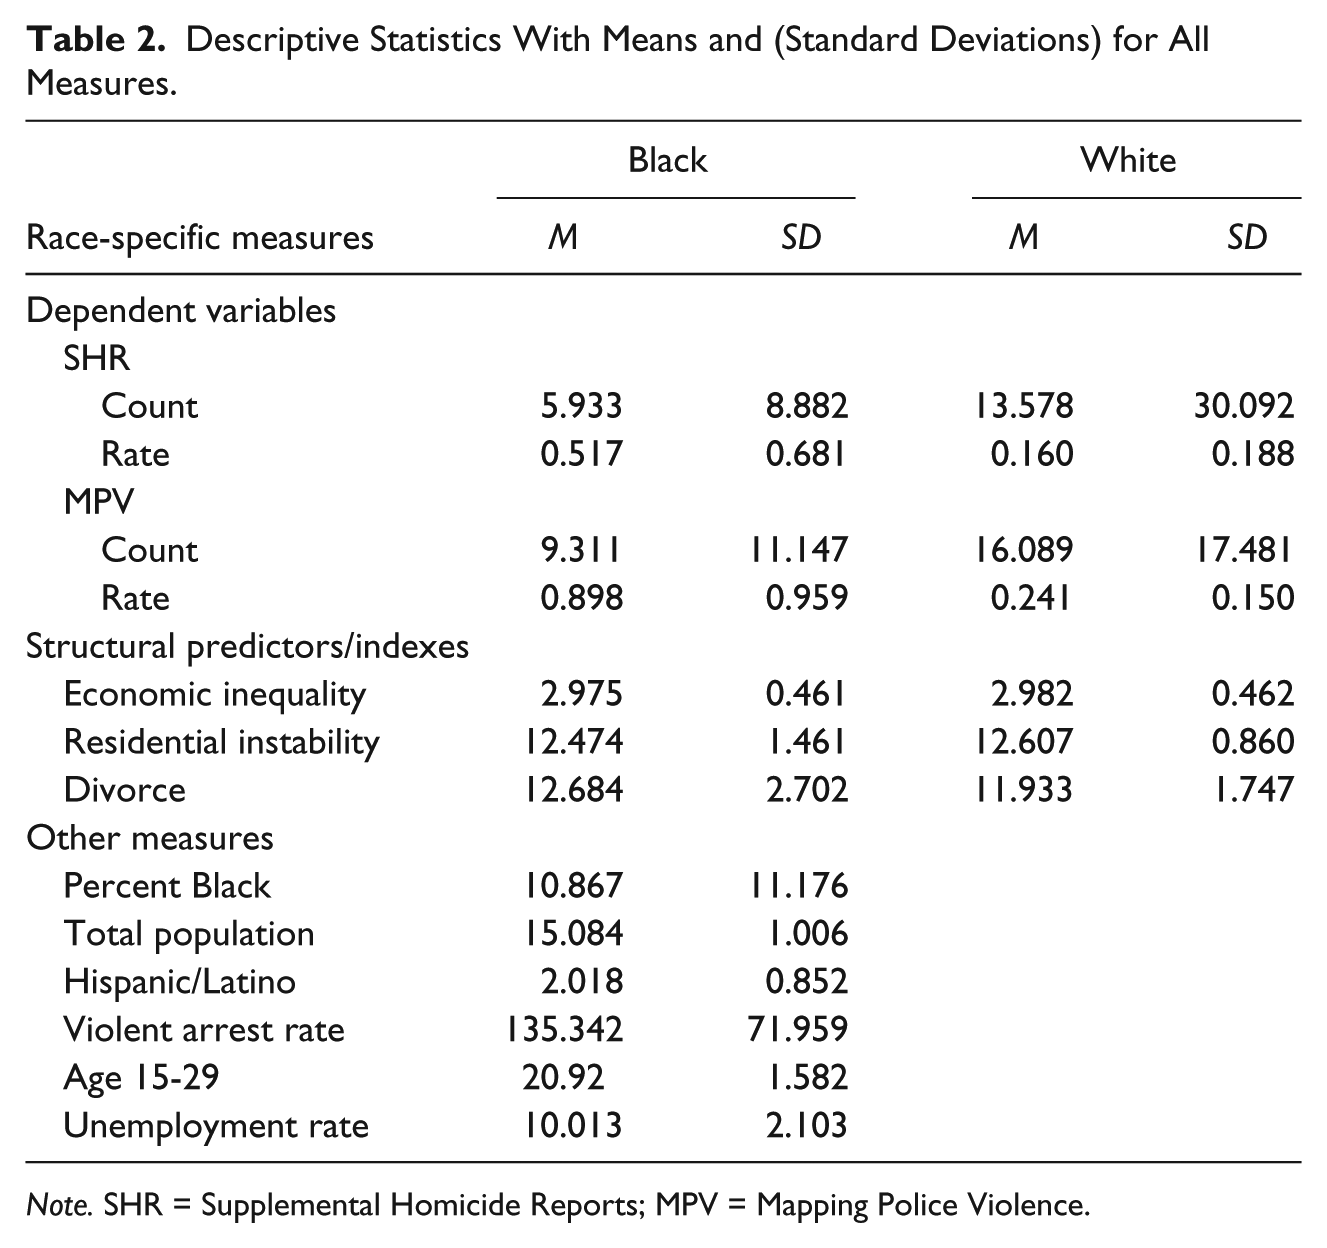
Note. SHR = Supplemental Homicide Reports; MPV = Mapping Police Violence.
Structural Predictors
To analyze the structural predictors of police shootings, we incorporate some of the most commonly used indicators in macro-structural research. That is, our selection of structural predictors is informed by the previous work of Pratt and Cullen (2005), Land, McCall, and Cohen (1990), and McCall, Land, and Parker (2010). These studies offer systematic investigations of structural predictors over time and space (Land et al., 1990; McCall et al., 2010) and via meta-analysis (Pratt & Cullen, 2005). Besides these seminal articles, several studies focusing on police use of force at the macro level were considered when deciding on what measures to incorporate in the current analyses (Alpert & MacDonald, 2001; Holmes, 2000; Jacobs & Britt, 1979; Jacobs & O’Brien, 1998; Legewie & Fagan, 2016; Liska & Yu, 1992; Smith, 2003, 2004; Smith & Holmes, 2014). We also considered other state-level analyses of state-sanctioned violence—the death penalty (Jacobs & Carmichael, 2002, 2004; Jacobs, Carmichael, & Kent, 2005).
First, this study includes race-specific measures of economic inequality which have been important to structural-level analyses of the past (Land et al., 1990; McCall et al., 2010), and the use of force specifically. Economic inequality has been a positive and significant predictor of police brutality and violence (Holmes, 2000; Smith, 2003), and, at the state-level, Jacobs and Britt (1979) found that states with more economic inequality were more likely to have more lethal force incidents. In addition, Jacobs and O’Brien (1998) observed Black-specific models of lethal force and found support for their measure of economic inequality. To measure economic inequality in this study, the 1-year estimate data provided by the American Community Survey (ACS) for 2010 were used because they are best suited for the analysis of large population sizes (U.S. Census Bureau, 2016; for more information on when to use 1-year estimates versus others, see http://www.census.gov/programs-surveys/acs/guidance/estimates.html). These measures include the mean family income and median family earnings, which were measured for Blacks and Whites. Following past researchers (Jacobs & O’Brien, 1998; Parker, Stults, & Rice, 2005), these measures were transformed into ratios: White income and earnings were divided by their Black-specific counterparts. The larger the value of these ratios, the greater economic inequality there is between Whites and Blacks within states. An index of residential instability was included, which combines indicators of movement across state borders and from abroad into states. These measures were also collected race-specifically, thus providing evidence of ere Black and White differences in residential settings. The construction of these indexes using principal components factor analysis is reported in Table 3 (see Land et al., 1990; Parker et al., 2005). In addition to producing constructs consistent with previous studies, the indexes reduce the presence of multicollinearity, where the variance inflation factors (VIF) remained below the criteria (less than 4.00) in all models.
Principle Component Analysis Utilizing Varimax Rotation for Race-Specific Structural Predictors.
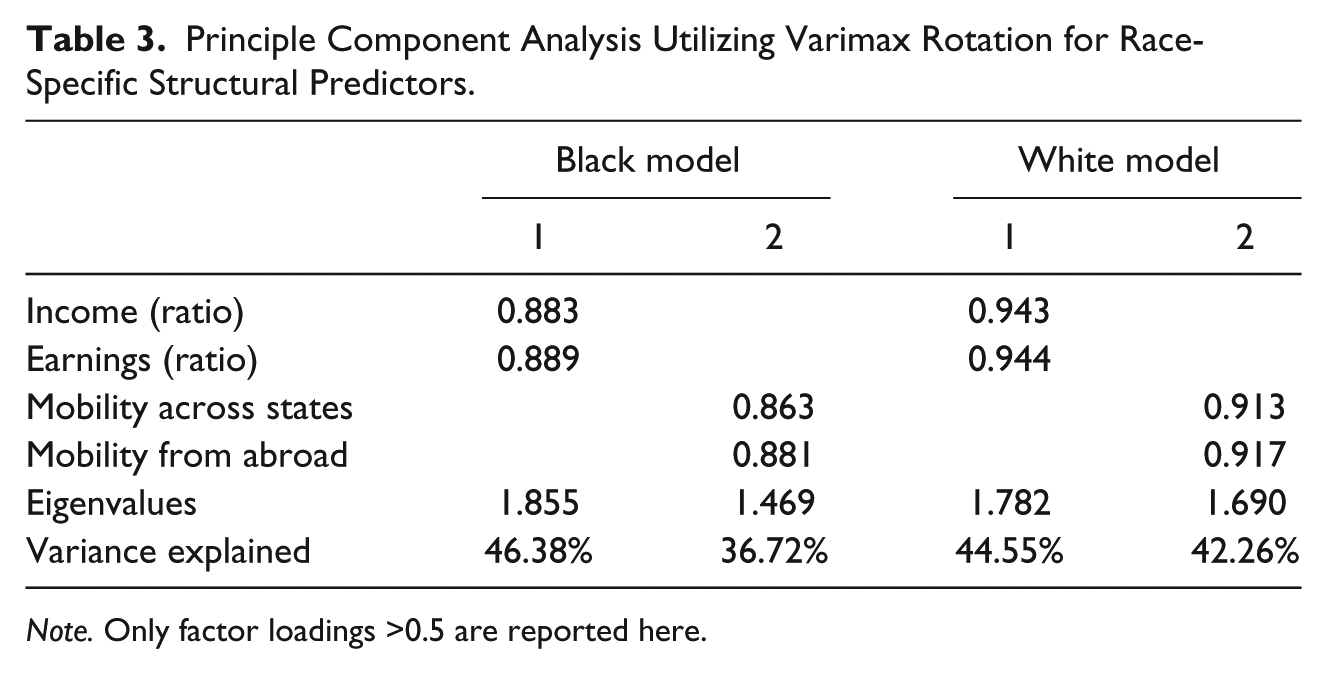
Note. Only factor loadings >0.5 are reported here.
Family disruption is another widely used structural predictor, and, in fact, it has been one of the strongest and most stable structural predictors in criminological literature (Land et al., 1990; McCall et al., 2010; Pratt & Cullen, 2005). Therefore, the percentage of the population that is divorced for both Blacks and Whites is included in their respective race-specific models. Specifically, areas with more familial disruption may not have social networks that are able to provide social control, which is often tied to more violent crime in these areas (Shihadeh & Steffensmeier, 1994). As a result, this lack of social control may contribute to persons being involved in more criminal activity, and therefore, there would be more chances for interactions with police.
Racial composition is another important structural predictor (Pratt & Cullen, 2005). Specifically, studies observing excessive force and brutality cases have found that the size of the Black population is a significant predictor of these incidents occurring more frequently (Holmes, 2000; Smith & Holmes, 2014). Including a measure of the percentage of the population that is Black has also been a significant predictor in some studies of lethal force (Smith, 2003, 2004), but not in other studies (Jacobs & Britt, 1979; Jacobs & O’Brien, 1998)—unless the analysis was looking at Black-specific instances of lethal force victimization (Jacobs & O’Brien, 1998). Finally, Liska and Yu (1992) found that the most consistent predictor of police lethality was the percentage of the population that was non-White. Thus, we would expect states with larger Black populations to also have more police shootings. Another compositional measure included in the analysis is the percentage of the population that is Hispanic/Latino, as Latinos have replaced African Americans as the largest racial-ethnic minority (Martinez, 2006) and recent evidence that Latino threat leads to higher levels of punitiveness toward their population (Stewart, Martinez, Baumer, & Gertz, 2015). This measure was logged to correct for its skewed distribution.
Other measures commonly used in studies of police use of lethal force are considered. First, the total population for each state was included because areas with larger populations also provide more chances of interactions between the police and citizens. This measure is logged to correct for skewness. Another population measure included in the current study is the percentage of the population between the ages of 15 and 29. As the Land et al. (1990) and McCall et al. (2010) studies indicate, this age range has been an important predictor, and as there is evidence of lethal force affecting the young disproportionately, it may help with further understanding when lethal force is used (Durán, 2016; Sorensen et al., 1993). The rate of violent crime arrests from each state, which was constructed using Uniform Crime Report (UCR) data for 2010, was also included. In several studies, a high level of violent crime in the area has been a significant predictor of use of force, both excessive and deadly (Alpert & MacDonald, 2001; Jacobs & Britt, 1979; Jacobs & O’Brien, 1998; Smith, 2003, 2004). Another measure Land et al. (1990) and McCall et al. (2010) consider in their structural-level studies of homicide is the rate of unemployment; however, this has not been included in previous analyses of force with one notable and recent exception (see Legewie & Fagan, 2016). Thus, the unemployment rate of those aged 16 and older was employed in the current analysis. Finally, a geographic region control measure is important to account for variation in police shootings. In this study, a measure for states residing in the South was created by coding southern states dichotomously (1 = the state residing in the south, 0 = for states not in the region).
Analytic Technique
Due to the nature of the dependent variables, Poisson and negative binomial regressions were considered for the analyses in this study. These statistical methods provide an alternative to other forms of regression analysis, such as ordinary least squares (Osgood, 2000). These analyses are appropriate for dependent variables that measure counts or integer-valued responses that are positive and discrete (Beck & Tolnay, 1995). These regressions, which were race-specific, were also offset for the log of the population being observed—Black or White—multiplied by 2 to create rate-like values from the counts that were added over a 2-year period (Reckdenwald & Parker, 2010). It is important to note that for the White MPV model, Poisson regression is the appropriate analysis, whereas negative binomial regressions are appropriate for all other models indicating that these dependent variables are overdispersed (Osgood, 2000). This was determined by examining the likelihood-ratio test of alpha = 0, where all but the White model from the MPV data indicate a chibar2(1) value that was significantly different from zero (Osgood, 2000). Robust standard errors were also requested, which corrects for heteroscedasticity. In addition, incident rate ratios (IRR), which are estimates that are exponentiated, were requested as an alternative to the coefficients that negative binomial and Poisson regressions provide (Rabe-Hesketh & Skrondal, 2012). In the result tables, VIFs are reported to check multicollinearity (Rabe-Hesketh & Skrondal, 2012).
Results
Black Models
In Table 4, two models are presented that correspond to Blacks killed by police shootings. Model 1 shows the results regarding the SHR data and Model 2 displays the corresponding results when MPV data are used. Even when we note definitional differences of lethal force across data sources, discrepancies in effect size and significance in structural-level predictors become evident. However, there are some general consistencies. First, looking at the Black-specific police shootings using SHR (Model 1) and MPV (Model 2) estimates, differences in structural predictors for percent Hispanic and unemployment rate are reported. Second, there are five predictors that reach statistical significance across both databases: South, total population size, percent Black, age structure, and economic inequality.
Negative Binomial and Poisson Regressions Reporting IRR Coefficients (Robust Standard Errors) for Race-Specific Police Shootings (N = 42).
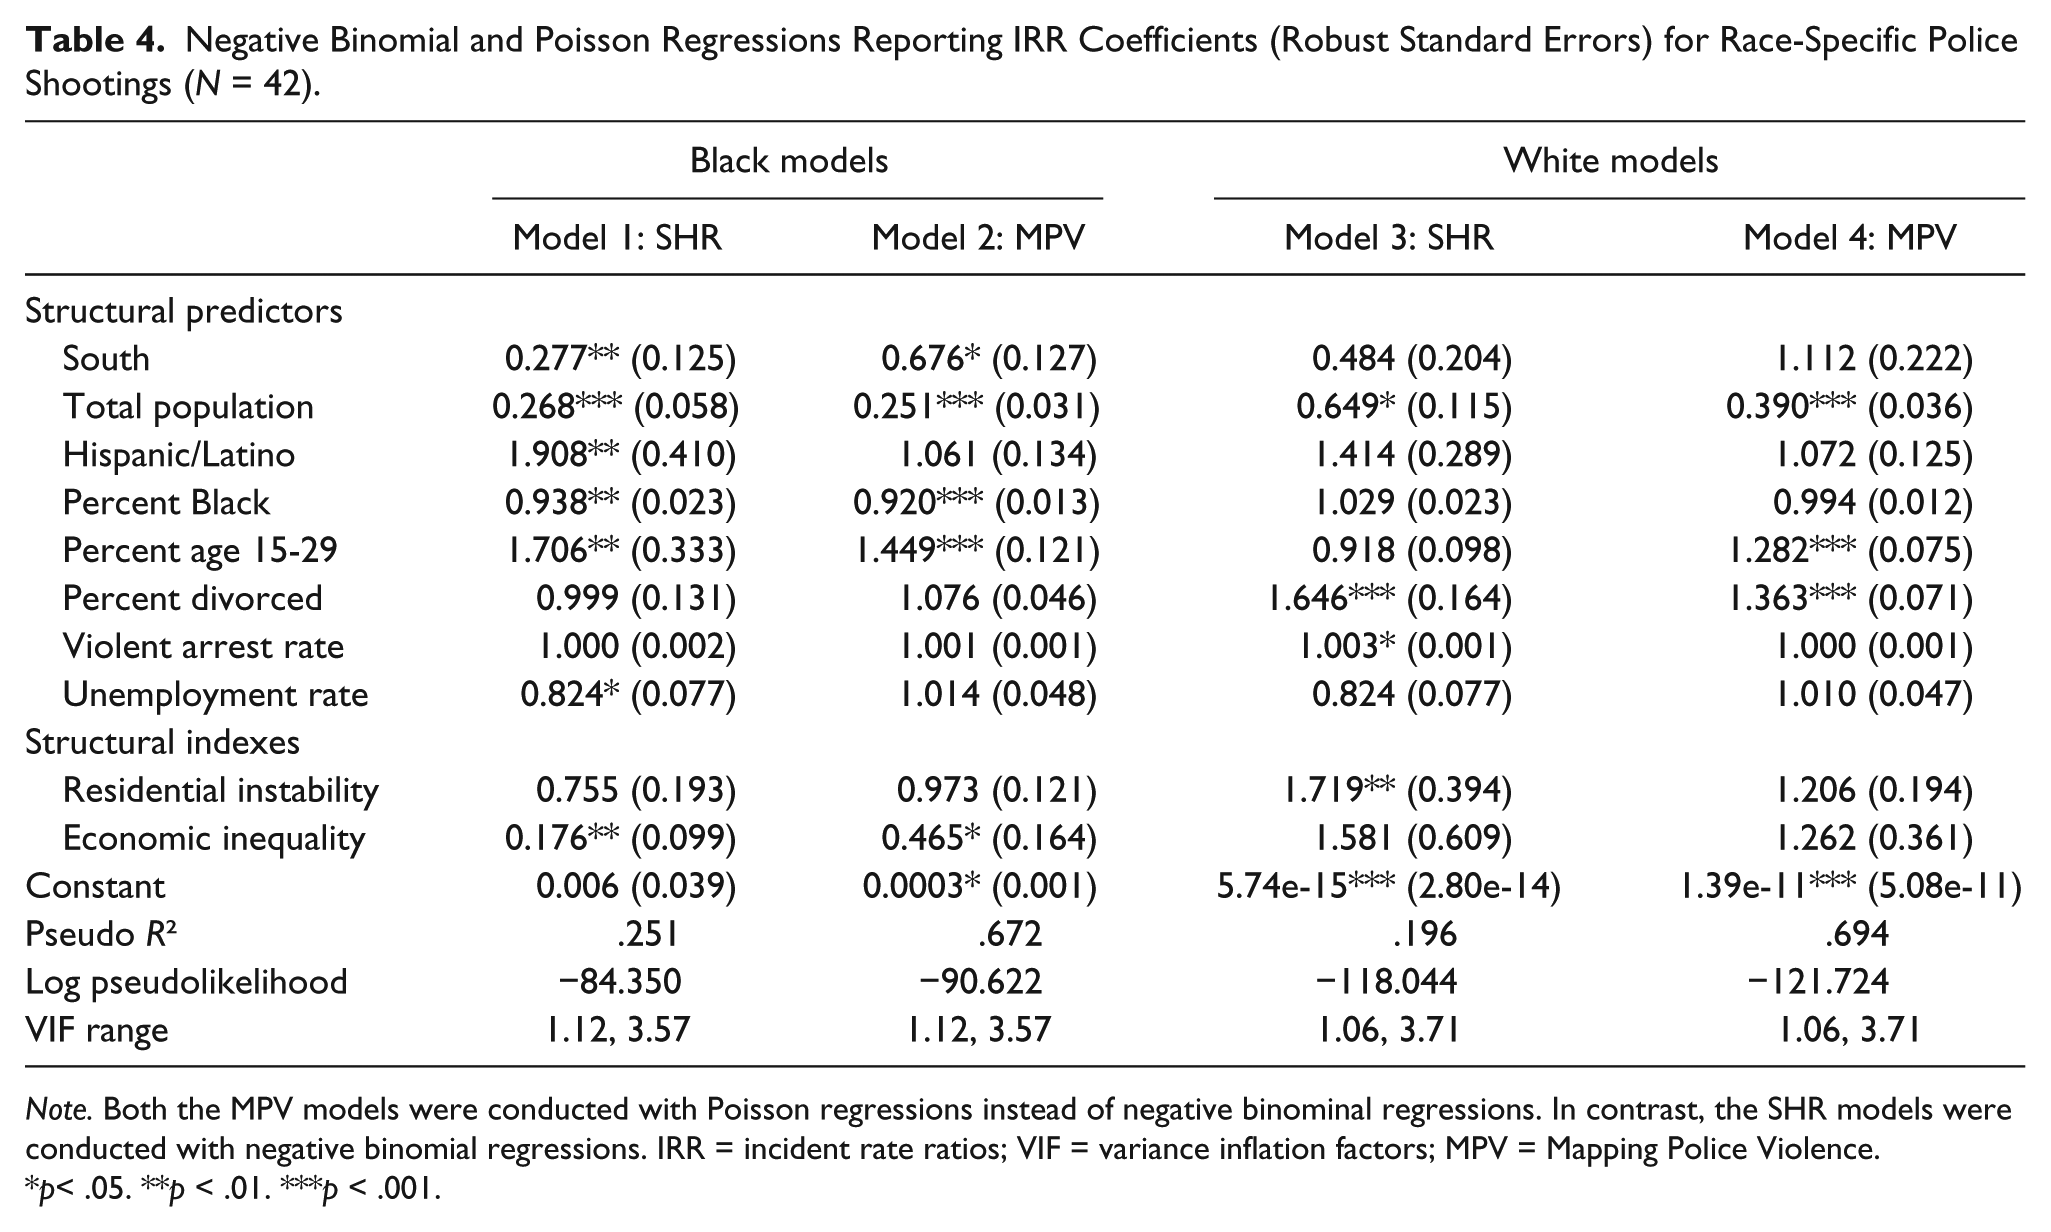
Note. Both the MPV models were conducted with Poisson regressions instead of negative binominal regressions. In contrast, the SHR models were conducted with negative binomial regressions. IRR = incident rate ratios; VIF = variance inflation factors; MPV = Mapping Police Violence.
p< .05. **p < .01. ***p < .001.
Regarding the differences, we find that percent Hispanic and unemployment rate are all significant when police shootings of Blacks are measured by official data (SHR). In Model 1, we see that the size of the Hispanic population has a significant effect. Specifically, as the Hispanic population increases, there is also an increase in police shootings of Black Americans at a rate of 91.1%. The final predictor that is significant according to the SHR, but not MPV estimates, is the unemployment rate. As unemployment rate increases, there is a decrease at a rate of 17.7% regarding Blacks who were killed by police shootings. None of these predictors reached significance when considering our source of “unofficial” data (MPV).
On the contrary, there are some statistically significant results that are generally consistent regardless of which data are used to estimate the number of police shootings of Black Americans. First, the size of the state’s total population indicates a negative relationship with the number of Black police shooting victims. Model 1 reports that as the population size increases, police shootings decrease at a rate of 73.1% and this is echoed in Model 2 which indicates a decrease at a rate of 74.9%. Second, as the size of the Black population increases across states, there is a decrease in police shootings against Blacks at a rate of 6.2% in Model 1 and 8.0% in Model 2. Third, the larger the population between the ages of 15 and 29, the more police shootings there are regarding Black estimates. Specifically, police shootings increase at a rate of 70.6% in Model 1 and at a rate of 44.9% in Model 2. Fourth, and contrary to previous use of force literature, the measure of economic inequality has an inverse relationship with police shootings. That is, as inequality between Whites and Blacks increases, Blacks killed by police shootings decreases at a rate of 82.3% in Model 1 and a rate of 53.5% in Model 2. Finally, another contradictory finding consistent across both data sources is that states in the South experience less police shootings than other regions; however, the effect sizes are different. Specifically, the findings from the SHR indicate that police shootings are 72.1% less likely to occur in the South, whereas the MPV findings predict 32.4% fewer incidents. As the results show, there are some general consistencies regarding structural predictors and police shootings, but there are also notable differences depending on which estimate of police shootings we consider.
White Models
Also, in Table 4, Models 3 and 4 provide similar comparisons in data sources for the impact of structural predictors on White-specific counts of police shootings. Like in the Black models, there are clear differences in significance levels and effect sizes. Between Models 3 and 4, we see that inconsistencies arise regarding measures of the age structure, violent arrest rates, and residential instability. However, two structural predictors are relatively consistent across the White models. First, divorce among Whites indicates a positive and significant relationship regardless of whether we are examining SHR (Model 3) or MPV (Model 4) estimates of Whites killed by police shootings. As Model 3 shows, when divorces increase, we see an increase in police shootings at a rate of 64.6%, whereas police shootings increase at a rate of 36.3% as divorces increase in Model 4. Second, the size of the total population indicates a negative relationship across both estimates of Whites killed by police shootings. Specifically, Model 3 indicates that there is a 35.1% decrease in police shootings of Whites and there is also a decrease of 61.0% per Model 4 regarding the size of the population.
When considering differences among our predictors, in the SHR model for White victims (Model 3), there are two significant predictors that we do not see reproduced in the MPV model (Model 4). First, increases in the violent arrest rate indicate increases in police shootings against Whites by a rate of 0.3%; however, this is a relatively small effect. Second, in Model 3, the effect of residential instability indicates that Whites shot and killed by the police increase at a rate of 71.9% as instability increases. In Model 4, one other structural predictor reaches significance not previously seen when considering the SHR’s White estimate of police shootings (Model 3). As the size of the population between the ages of 15 and 29 increases, there is an increase in police shootings of Whites at a rate of 28.2%.
In sum, findings are not replicated across the SHR and MPV data, suggesting that when scholars examine police shootings using either database, differences are likely to be reported. However, there are a few general consistencies. For example, in the Black models, economic inequality is a stable predictor indicating that where Blacks are worse off economically, they are less likely to be shot and killed by the police. In the White models, we also see a stable and significant predictor: divorce. This finding indicates that when Whites have high levels of family disruption, they also have an increased chance of being killed by the police, regardless of which source we use to measure police shootings. In addition, by offering race-specific measures, we find significant variation in the impact of structural predictors across racial groups. For example, divorce is a stable predictor of White counts of police shootings but has no significant effect regarding Black counts. On the contrary, economic inequality was a stable and strong predictor of the odds Blacks are killed by police shootings but has no effect on White models. Age structure, however, yielded some stability across both racial groups when examining estimates of police shootings from MPV. Specifically, younger populations (between the ages of 15 and 29) are more likely to be victims of police shootings regardless of the racial group. The size of the total population also yielded a consistent, negative effect across all four models indicating that states with larger total populations have lower counts of police shootings. We now turn to our general discussion and conclusions.
Discussion and Conclusion
In the United States, there have been several high-profile cases highlighting the use of excessive and, sometimes, lethal force by the police in the last few years. As Hirschfield (2015) wrote, “When it comes to police lethality, the United States is unrivaled among industrialized nations” (p. 1110). The purpose of this study was to re-examine the connections between race and police shootings at the state level while also replicating the analysis across two separate sources of lethal force data, one official and the other “unofficial.” In proceeding with these goals in mind, formative studies of structural predictors across time and space were considered, as well as several structural-level studies of the police’s use of force.
For years, researchers have been dependent on official sources of data, such as the Federal Bureau of Investigation’s (FBI) SHR, although these reports have long been criticized for inaccuracies regarding the use of lethal force by police (Fyfe, 2002; Williams et al., 2016). Thus, MPV, a recent “unofficial” data source, was also examined as it makes several improvements over the SHR by providing more comprehensive data collection efforts, not relying on just police records, and lethal force is not as narrowly defined. As the findings from Table 4 indicate, how we measure lethal force matters. Besides this crucial point, these results also indicate the importance of disaggregating incidents of police shootings by race. Combined, these two points have great significance in answering the questions posed at the beginning of this study. That is, results are not replicated across the SHR and MPV data sources when observing race-specific counts of police shootings. This finding may not be surprising given the differences between these sources, but it has critical implications going forward regarding studies of lethal force. Importantly, SHR underreports police shootings and represents lower level of racial disparities in rates than what is found in the MPV data. In addition, even when methodological considerations for comparability and appropriate statistical estimation are accounted for, reported results are likely to produce inconsistent evidence about which structural features influence police shootings of Blacks and Whites because of the data source itself. As found here, there are some relatively consistent findings when looking at race-specific counts across the separate data sources; however, there are several inconsistencies as well. As a result, efforts to inform theory, policy, and police are affected.
It should be noted that there are several factors that may have affected and limited the findings reported here. First, this analysis has been conducted with state-level data, which may not be the most appropriate unit of analysis to capture group processes. That is, using state-level data may have impacted the effects of our predictor variables. However, there is some research indicating that the level of analysis may not matter and that the effects of predictor variables should be relatively invariant, but more work needs to be done in this regard (Land et al., 1990). Thus, future research would benefit from a similar analysis as the one presented here, but at different units of analysis such as cities, counties, or neighborhoods and census tracts. Second, this analysis was limited in the number of years available for the measures of police shootings because MPV has only been collecting data since 2013. Third, some research has stressed the importance of examining dynamic structural predictors; thus, it may be beneficial to capture increases and decreases in measures like the size of the Black population, not just static predictors (Chamlin, 1989; Jacobs & O’Brien, 1998). In addition, this study only utilized income and earnings to measure economic inequality, but it has been argued that other measures such as education and occupation should be considered (Chiricos & Waldo, 1975; Kubrin, Stucky, & Krohn, 2009).
Future research should begin to consider these issues and try to recognize what other structural predictors will help better understand the use of lethal force. For example, Hirschfield (2015) noted that America’s gun culture may be another area of future research regarding police lethality. He believes this is the case because in this culture “police are precariously primed for the possibility that suspects are packing”; thus, there may be a constant fear and sense of danger in this line of work (Hirschfield, 2015, p. 1112). We should also begin to look at legitimate versus illegitimate incidents of lethal force (Hirschfield, 2015) to see what disparities exist here and what factors may contribute to these designations. Future research should also begin to examine more than just the Black–White dichotomy of police shootings because recent research has found some support for the contention that Latinos are also perceived as a threatening population in the United States (Stewart et al., 2015). Finally, there are other data sources available that could also be explored regarding the use of lethal force by police such as The Counted (The Guardian) and Fatal Force (Washington Post).
In conclusion, there is much more work that needs to be done when observing police use of lethal force. The new data provided by outlets, such as MPV, are a step in the right direction to police accountability, but more research is still needed. The results in this study clearly indicate that the findings are not replicated across the data sources used; thus, what measure of police shootings, and lethal force as a whole, we use matters. Several limitations to this study have been outlined and there are some definite possibilities for future research that may help us to better understand the use of lethal force by police.
Footnotes
Declaration of Conflicting Interests
The author(s) declared no potential conflicts of interest with respect to the research, authorship, and/or publication of this article.
Funding
The author(s) received no financial support for the research, authorship, and/or publication of this article.