



Abstract
Recent incidents involving police shootings of unarmed men of color have increased tensions between communities and police departments across the United States. In response, scholars have intensified efforts to understand the factors that shape attitudes toward the police. The current study examines individual and aggregate factors that influence satisfaction with the police. To this end, we address three research questions: (a) are there significant racial/ethnic differences in satisfaction with police; (b) do these differences persist after accounting for experiences with the police, perceptions of safety, and aggregate measures; and (c) can procedural justice help explain racial variation in attitudes toward the police? Study findings highlight the importance of perceptions of safety in explaining racial/ethnic variation in attitudes toward the police.
Introduction
Recent highly publicized incidents of police force have highlighted the deep divide between the police and many racial and ethnic minority communities. These incidents have fueled tremendous social unrest and outrage, especially on the part of African American and Latinx individuals, and led to riots in cities such as Baltimore, Cleveland, and Milwaukee. 1 A Gallup Poll conducted in the aftermath of the deaths of Michael Brown and Eric Garner revealed a 22-year low in confidence in the police among the public. 2 Mending the fractured relationship between law enforcement and communities with large numbers of Black and Latinx residents is one of the central priorities of the contemporary American criminal justice system (see, for example, The President’s Task Force on 21st Century Policing). To facilitate this fence-mending, social scientists have intensified their efforts to advance our scholarly understanding of attitudes toward the police. As described by Schuck and Rosenbaum (2005), “understanding and measuring residents’ attitudes toward the police has become increasingly important as police departments face growing pressure to address accusations of police misconduct and discriminatory treatment of minorities” (pp. 391-392). To better understand the factors that influence attitudes toward the police, this study analyzes recent survey data to examine the individual and neighborhood-level factors that influence satisfaction with the police.
The bulk of attitudes toward the police research indicates that most respondents hold supportive and positive views of the police (e.g., Huang & Vaughn, 1996; Maguire & Pastore, 2003). That said, much of this work also demonstrates consistent variation in attitudes across demographic characteristics, individual experiences, and neighborhood contexts (e.g., Dai & Johnson, 2009; Gau, Corsaro, Stewart, & Brunson, 2012; Sampson & Bartusch, 1998; Wu, Sun, & Triplett, 2009). For example, African Americans tend to be less supportive and less trusting of police than their White counterparts (see Decker, 1981; Webb & Marshall, 1995 for reviews). Moreover, while less frequently studied, Hispanic/Latinx support for the police generally tends to be lower than that of White yet higher than that of Black respondents (Lai & Zhao, 2010; Rosenbaum, Schuck, Costello, Hawkins, & Ring, 2005; Schafer, Huebner, & Bynum, 2003; Schuck & Skogan, 2006; Wu, 2014). This study endeavors to examine the factors that have traditionally been found to be influential in shaping attitudes toward the police including demographic background, experiences with the police, perceptions of police interactions, perceived public safety, and aggregate community context.
Our research advances prior research in this area in two important ways. First, departing from much of the extant research concerning attitudes toward the police, we move beyond the White–Black dyad by investigating the potential impact of White, Black, and Latinx racial /ethnic categories on attitudes toward the police. Second, we employ a two-stage analytic strategy. We first identify statistically significant correlates of views toward the police in the full sample of respondents. We then conduct analysis on a subsample of respondents who reported experiencing involuntary police contact and introduce procedural justice measures. Our review of the literature failed to identify any study that contained all these specific features. In sum, this research utilizes survey data from a sample of 1,405 Milwaukee residents collected in 2014 to advance prior research in attitudes toward the police. In so doing, we explore three primary research questions:
Literature Review
Extant research has identified four primary groups of covariates found to be significant predictors of evaluations of the police. Following the work of Reisig and Parks (2000) and Dai and Johnson (2009), we test the salience of these groups of variables and orient our review of the literature around (a) individual demographic characteristics, (b) experiences with police, (c) perceived public safety, and (d) aggregate community context.
Individual Demographic Characteristics
An individual’s background often provides important context to explain variation in views of law enforcement. Research shows that, on balance, young, economically disadvantaged persons of color have far less favorable attitudes toward the police than older, affluent Whites (Apple & O’Brien, 1983; Garcia & Cao, 2005; Gau et al., 2012; Huang & Vaughn, 1996; Sampson & Bartusch, 1998; Tuch & Weitzer, 1997). Relative to other demographic characteristics, a respondent’s racial background has been one of the most consistent predictors of attitudes toward the police. Survey research consistently shows that African American respondents report less satisfaction than White ones (Bordua & Tifft, 1971; Decker, 1981; Weitzer, 2000; Weitzer & Tuch, 1999). Although there is a wealth of research concerning racial differences in levels of police support, only a handful of studies examine the attitudes of White, African American, and Latinx respondents simultaneously. This problem is endemic to criminology and criminal justice research more generally, which too frequently reduces racial categories into a White–Black dyad (Russell-Brown, 2009). Unfortunately, this dyad disregards the substantial body of evidence that African American and Latinx in the United States “. . . differ considerably from each other with regard to victimization experiences, the extent to which they are affected by disorder, perceptions of police behavior and attitudes toward the police” (Van Craen & Skogan, 2015, p. 301).
Previous studies of Hispanic/Latinx evaluations of law enforcement have yielded inconsistent results. The bulk of studies have found that Hispanic/Latinx respondents report higher levels of support for the police than African American respondents, but lower levels of support than White respondents (Brown & Benedict, 2002; Lai & Zhao, 2010; Skogan, 2006b; Taylor, 2001; Tyler, 2005; Weitzer & Tuch, 2005; Wu, 2014). Other work, perhaps surprisingly, has found that Hispanic/Latinx support for law enforcement is comparable with Whites (Cheurprakobkit, 2000) and at least two studies have shown that Latinx respondents’ evaluations of the police are higher than White respondents (Schuck, Rosenbaum, & Hawkins, 2008; Weitzer & Tuch, 2006). Scholars have turned to several explanations to account for this variation in attitudes across racial/ethnic groups. It is to these explanations, which we now turn our attention.
Experience With Police
Much of the racial/ethnic differences in support for the police have been attributed to differing experiences with the police. The premise of the experience with police model is that attitudes toward the police are influenced by type of prior contact with the police and police behavior during those contacts. Two key questions have been addressed in this line of research: (a) does type of police contact (e.g., traffic stop, victimization) affect how people view the police? (b) does procedural justice predict respondent satisfaction with the police? Research in this area reveals that type of contact matters (e.g., Bordua & Tifft, 1971; Decker, 1981). Studies call attention to the importance of distinguishing between voluntary and involuntary contact with the police (Decker, 1981). Voluntary contacts, or when individuals willingly initiate or engage in contact with the police (e.g., service requests), tend to increase confidence in the police (Correia, Reisig, & Lovrich, 1996; Skogan, 2005). On the contrary, involuntary contacts (e.g., traffic stops, searches) are associated with less positive feelings about the police, including decreased satisfaction (Eith & Durose, 2011; Tyler, Fagan, & Geller, 2014). Likewise, victimization often has a negative impact on respondents’ evaluations of police performance (Brown & Benedict, 2002; Wu et al., 2009).
Attitudes toward the police are not only a function of who initiates police interactions. Researchers have also investigated the ways in which attitudes are shaped by respondents’ treatment by the police during encounters (i.e., procedural justice). Procedural justice embodies the “fairness of the process through which the police make decisions and exercise authority” (Sunshine & Tyler, 2003, p. 514). When respondents view police decision making as fair and impartial and when they perceive being treated with dignity and respect, they are more likely to report being satisfied with police interactions (Mazerolle, Antrobus, Bennett, & Tyler, 2013; McCluskey, 2003; Skogan, 2005; Tyler, 1990; Tyler & Fagan, 2008; Tyler & Huo, 2002). That said, demographic characteristics (most notably race and ethnicity) can affect the weight that is given to encounters with law enforcement. It is not entirely clear how the link between police evaluations and procedural justice differs across respondents’ race.
For Whites, negative encounters exert a significant impact on satisfaction (Rosenbaum et al., 2005). Chandek (1999) shows that this inconsistency results from White respondents holding higher expectations of police interactions. When White and Black respondents report similar interactions with the police, White respondents report lower levels of police satisfaction than their racial/ethnic minority counterparts ostensibly because Whites have higher expectations of police interactions (Chandek, 1999; Rosenbaum et al., 2005). Other work, however, shows no racial differences in the importance of procedural justice in shaping perceptions of the police, or the invariance thesis (Jackson, Bradford, Stanko, & Hohl, 2012; Tyler, 2005; Wolfe, Nix, Kaminski, & Rojek, 2016). A final body of extant research also finds that procedural justice is more important for African American evaluations of the police (Sunshine & Tyler, 2003; Tyler, 2005; Tyler & Wakslak, 2004). In sum, the literature concerning racial background of respondent, procedural justice, and police evaluations has found that procedural justice is more important for Whites, more important for African Americans, and no differences across racial subgroups.
Perceptions of Public Safety
Research also tends to find that assessments of public safety are connected to support for law enforcement. As articulated by Reisig and Parks (2000), “Here, research has been guided by the tenet that perceptions of neighborhood conditions (e.g., crime, social disorder and physical decay) affect levels of satisfaction with the police” (p. 610). Several studies have found that attitudes toward the police are significantly related to perceptions of neighborhood crime (Reisig & Giacomazzi, 1998), disorder (Cao, Frank, & Cullen, 1996; Reisig & Giacomazzi, 1998), and fear of crime (Cao et al., 1996; Dowler & Sparks, 2008). In fact, two studies find that perceptions of neighborhood safety and crime are the strongest predictors of opinions of the police (Dowler & Sparks, 2008; Reisig & Parks, 2000). Residents often hold police accountable for the social conditions of their neighborhoods and communities (Cao et al., 1996; Reisig & Giacomazzi, 1998; Reisig & Parks, 2000).
Community Context
Finally, researchers have also turned to aggregate measures of community context to explain variation in support for the police. Researchers have focused specifically on the role that racial/ethnic composition of neighborhoods and aggregate measures of economic well-being as potential correlates of views of law enforcement. Studies have found that officers stop residents in predominantly minority disadvantaged areas more often than in Whiter, more affluent neighborhoods. Furthermore, research suggests that officers often view residents of poorer and predominantly African American neighborhoods with heightened levels of suspicion and wariness (Skogan, 2006a; Terrill & Reisig, 2003).
Recent work that has employed direct measures of neighborhood context (e.g., racial/ethnic composition, socioeconomic status [SES], residential mobility, crime rates) and multilevel modeling (e.g., hierarchical linear modeling [HLM], random effects models, etc.) have found that neighborhood characteristics can shape respondents’ perceptions of the police (Dai & Johnson, 2009; Gau et al., 2012; Reisig & Parks, 2000; Sampson & Bartusch, 1998; Wu et al., 2009). Aggregate crime rates have the potential to condition satisfaction with law enforcement. According to Sampson and Bartusch (1998), “. . . violent crime is a major part of the story of why residents of concentrated poverty areas rate the police so negatively” (p. 800). Respondents in high crime areas might view the police as ineffective in preventing crime or even perceive their presence as exacerbating problems in their neighborhoods (Sampson & Bartusch, 1998).
Prior research suggests that these four models are critical to our understanding of attitudes toward the police. However, several questions remain. Do experiences with the police, perceptions of public safety, and aggregate community covariates explain the consistent importance of an individual’s racial/ethnic background in shaping views of law enforcement? Based on our review of the literature, the effects of these explanatory factors are inconsistent and conditional. This study seeks to advance this body of work by continuing to weigh the relative salience of explanatory factors in accounting for the vital role of race. The study at hand strives to accomplish this goal by analyzing recently collected survey data of Milwaukee residents.
Data and Method
Data
The data for this study were collected from three sources: (a) the U.S. Census American Community Survey (ACS), (b) the Wisconsin Incident–Based Reporting System (WIBRS), and (c) the City of Milwaukee Police Satisfaction Survey of 2014. The survey, administered by the University of Wisconsin–Milwaukee Center for Urban Initiatives & Research on behalf of the Milwaukee Fire and Police Commission, was conducted via telephone with a random sample of Milwaukee residents (n = 1,405). Interviewers asked respondents about their attitudes toward law enforcement and their experiences with police. Questions also covered resident’s exposure to crime, perceptions of safety, and a host of additional variables.
The sample of Milwaukee residents, gathered in the summer of 2014, is the result of RDD (random digit dialing) telephone surveying with both landline (46.2%) and cell phone numbers (53.8%) with a ±2.6% margin of error at the 95% confidence level. The survey was administered in both English and Spanish (approximately 5.8% of the sample completed the survey in Spanish). 3 The response rate for this survey was 8.8%. This is admittedly low, as response rates of 10% or less have been typically been considered indicative of a methodologically flawed study (Jennings & Reingle, 2014; Maxfield & Babbie, 2014). The assumption has always been “. . . that the larger the proportion of participating sample units, the more accurate the survey estimates (American Association for Public Opinion Research [AAPOR], 2017, para. 1).” In recent years, this issue has become of considerable importance, as response rates have dramatically fallen (Brick & Williams, 2013; Curtin, Presser, & Singer, 2005) with many of the nation’s most respected surveys (e.g., those conducted by Pew Research) producing response rates below 10% (Kohut, Keeter, Doherty, Dimock, & Christian, 2012; Schueler & West, 2016; Tourangeau, Maitland, & Yan, 2016; Weinberg, Freese, & McElhattan, 2014). Some have begun to refute the claim that higher response rates equal greater accuracy (Pickett, 2017). A low response rate does not necessarily equate with the survey’s potential for bias; instead, as Groves and Peytcheva (2008) argued, “[The] nonresponse rate of a survey, by itself, is a poor predictor of the absolute relative nonresponse bias (p. 174).”
Dependent Variable
Our analyses center on satisfaction with the police. Cao (2015) argues that satisfaction is an internally oriented and experience-driven assessment of police. We measured satisfaction with police as an index of separate items that asked respondents how satisfied they were with the Milwaukee Police Department across seven separate domains: (a) addressing violent crime, (b) addressing property-related crimes, (c) enforcing traffic laws, (d) responsiveness to public concerns, (e) honesty and integrity, (f) general attitude and behavior toward individuals, and (g) general competence. All seven indicators had the same response options (i.e., 0 = not at all satisfied, 1 = not very satisfied, 2 = somewhat satisfied, 3 = very satisfied). The alpha reliability estimate for this index was .906. Furthermore, the results of a principal axis factor analysis using an oblique rotation indicated that the seven items loaded on one factor. Respondents who answered with “don’t know” or who refused to answer were coded as missing values and were subsequently removed from all the bivariate and multivariate analyses. 4
Individual Demographic Variables
We included numerous individual-level demographic control variables shown in previous research to be significant predictors of respondents’ evaluations of police. First, we included gender (men = 1), age as measured by four ordinal categories (18-29 years = 0, 30-44 years = 1, 45-59 years = 2, and 60 years and above = 3), and education recoded into a dichotomous variable (any college or more = 1) in our analyses. Numerous studies have shown that men, older, and less educated respondents are more supportive of the police (Dowler & Sparks, 2008; Taylor et al., 2001; Weitzer & Tuch, 1999, 2002). Next, we included measures of race and ethnicity, as they are central to our analyses as strong and consistent predictors of attitudes toward the police. One question asked whether respondents self-identified as Hispanic or Latinx. If yes, then Latinx respondent = 1. We created a Black respondent variable by selecting out those cases where the respondent self-identified as African American. We examine the potential effects of being unemployed (yes = 1) and sharing a residence with a felon (yes = 1), considering extant evidence that which indicates that employment status (Wheelock, Semukhina, & Demidov, 2011) and personal connections to offenders and victims (Rosenbaum et al., 2005) can be statistically significant predictors of views toward the criminal justice system more generally. Finally, we used an item from the survey that asked respondents whether they were a past crime victim: “During the past 12 months, have you been the victim of a crime in the City of Milwaukee?” (1 = yes). Previous research has established that victimization tends to decrease satisfaction with the police (Brown & Benedict, 2002; Wu et al., 2009).
Experience With Police
All respondents were asked about their interactions with MPD police during the last year. Voluntary contact was based on one survey item that asked respondents “Have you approached or sought help from the Milwaukee Police Department or a Milwaukee police officer for any reason in the past 12 months?” (1 = yes). Over half of the respondents (57%) who reported experiencing voluntary contact with the police did so to report a crime. The remaining 43% did so for “some other reason.” Involuntary contact was based on the survey question “Has a Milwaukee police officer-initiated contact with you in the past 12 months?” Both contact items had dichotomous yes/no responses.
In the final stage of our analyses, we examine the role of three additional experiences with police variables on satisfaction with the police for a subset of the sample (i.e., persons who had an involuntary contact with the police). These respondents were asked questions specifically about their perceptions of the police-initiated contact they reported. The first question asked respondents whether they believed that the police had a legitimate reason for initiating contact. Next, respondents were asked whether they were treated with respect and courtesy during their police-initiated contact. Finally, respondents were asked whether they were satisfied with the way the police handled the contact. The first and second question had yes/no response options, while the third measure had Likert-type scale response options ranging from not at all satisfied, not very satisfied, somewhat satisfied, to very satisfied. We then combined these items into a procedural justice index (Cronbach’s α = .753) and include it in the subsample models. 5
Perceptions of Public Safety
Two measures comprise our perceptions of public safety concept. The first is a two-item index, feel safe in neighborhood, which was the sum of two variables that asked respondents about their views of public safety in their specific neighborhoods during the day and at night (Cronbach’s α = .789). The response options for each of these two items included 0 = not at all safe, 1 = not very safe, 2 = somewhat safe, and 3 = very safe. We then included a measure of perceived safety, but the point of reference is changed from a respondent’s neighborhood to Milwaukee as a whole (feel safe in Milwaukee). This item is a single-item measure with the same response options as the perceived safety question referencing neighborhoods (i.e., 0 = not at all safe to 3 = very safe). 6 These measures reveal differences between the ways actual experiences with criminal victimization can influence satisfaction with police compared to perceived fear of criminal victimization.
Aggregate Community Context
To establish respondents’ location, we utilized a question that asked, “What is your current zip code?” There were 44 unique zip codes in the survey data that we matched to U.S. census zip codes. Numerous zip codes (n = 16) either did not match Milwaukee area zip codes or did not match with WIBRS/Census ACS data. These zip codes, and their corresponding 49 respondents, were treated as missing data. In short, a relatively small number of respondents were removed from the analysis due to nonmatching zip codes (3.8% of the total cases included in the full models). The multilevel analysis rests on the remaining 28 aggregate zip code units. Drawing from the U.S. Census ACS, 7 we included percent Hispanic/Latinx. We then created a single composite crime index (Cronbach’s α = .948) from violent (i.e., homicide, sexual assault, robbery, aggravated assault) and property crimes (i.e., burglary, theft, motor vehicle theft, arson) using data drawn from the WIBRS.
Analytic Strategy
We employed the following analytic strategy. First, we observed the level of satisfaction with the police among Milwaukee survey respondents with our descriptive statistics. Second, we sought to determine the unique contribution of the covariates included in the multivariate regression models with the STATA SE 14 package. Our satisfaction with police dependent variable ranges from 0 to 21 and approximates a normal distribution. The use of ordinary least squares (OLS) regression with our data is potentially problematic, however, because many respondents reside in the same zip code, which may result in correlated error terms and deflated standard errors (and hence inflated t values). On average, there were 41.6 respondents per aggregate unit (with a minimum value of 1 and a maximum value of 120 respondents), or zip code. The potential for correlated errors is substantial with this data structure so we corrected for the potential deflation of standard errors by estimating random effects models. These models better account for within and across unit error relative to the basic OLS models (Brunton-Smith, Sturgis, & Leckie, 2018; King & Wheelock, 2007). Finally, we estimate coefficients for models restricted to respondents that reported experiencing involuntary police contact to further explore the potential role of procedural justice and legitimacy in accounting for race effects in this specific subgroup.
We focus exclusively on respondents who reported an involuntary contact in the subsample analysis because scholars have discovered that procedural justice can operate as key mitigating factors between experiences with law enforcement and perceptions of the police. In addition, procedural justice may be more important in involuntary contacts than voluntary ones (Murphy, 2009; Skogan, 2005, 2006a). As Skogan (2006a) articulated, The legitimacy of police intervention is surer when [the police] are contacted for assistance; police-initiated contacts on the other hand, may not be entered into voluntarily and are more likely to be of a suspicious, inquisitorial and potentially adversarial nature. (p. 104)
In addition, during voluntary contacts with the police, people tend to have clearer outcome expects, whereas in an involuntary (police-initiated) encounter, people are more concerned with the way they are treated (Murphy, 2009).
Findings
Descriptive statistics (Table 1) reveal that on a 21-point scale of police satisfaction, the global mean satisfaction is 12.9 (SD = 5.21). These data show that a large majority of Milwaukee respondents express at least some satisfaction with the police. Our results are consistent with related evidence that shows strong support for law enforcement nationwide. For example, our results were very similar to a recent poll conducted by the Pew Research Center, which found that 77% of respondents had “some” or “a great deal” of confidence in police (Morin & Stepler, 2016). 8
Descriptive Statistics.
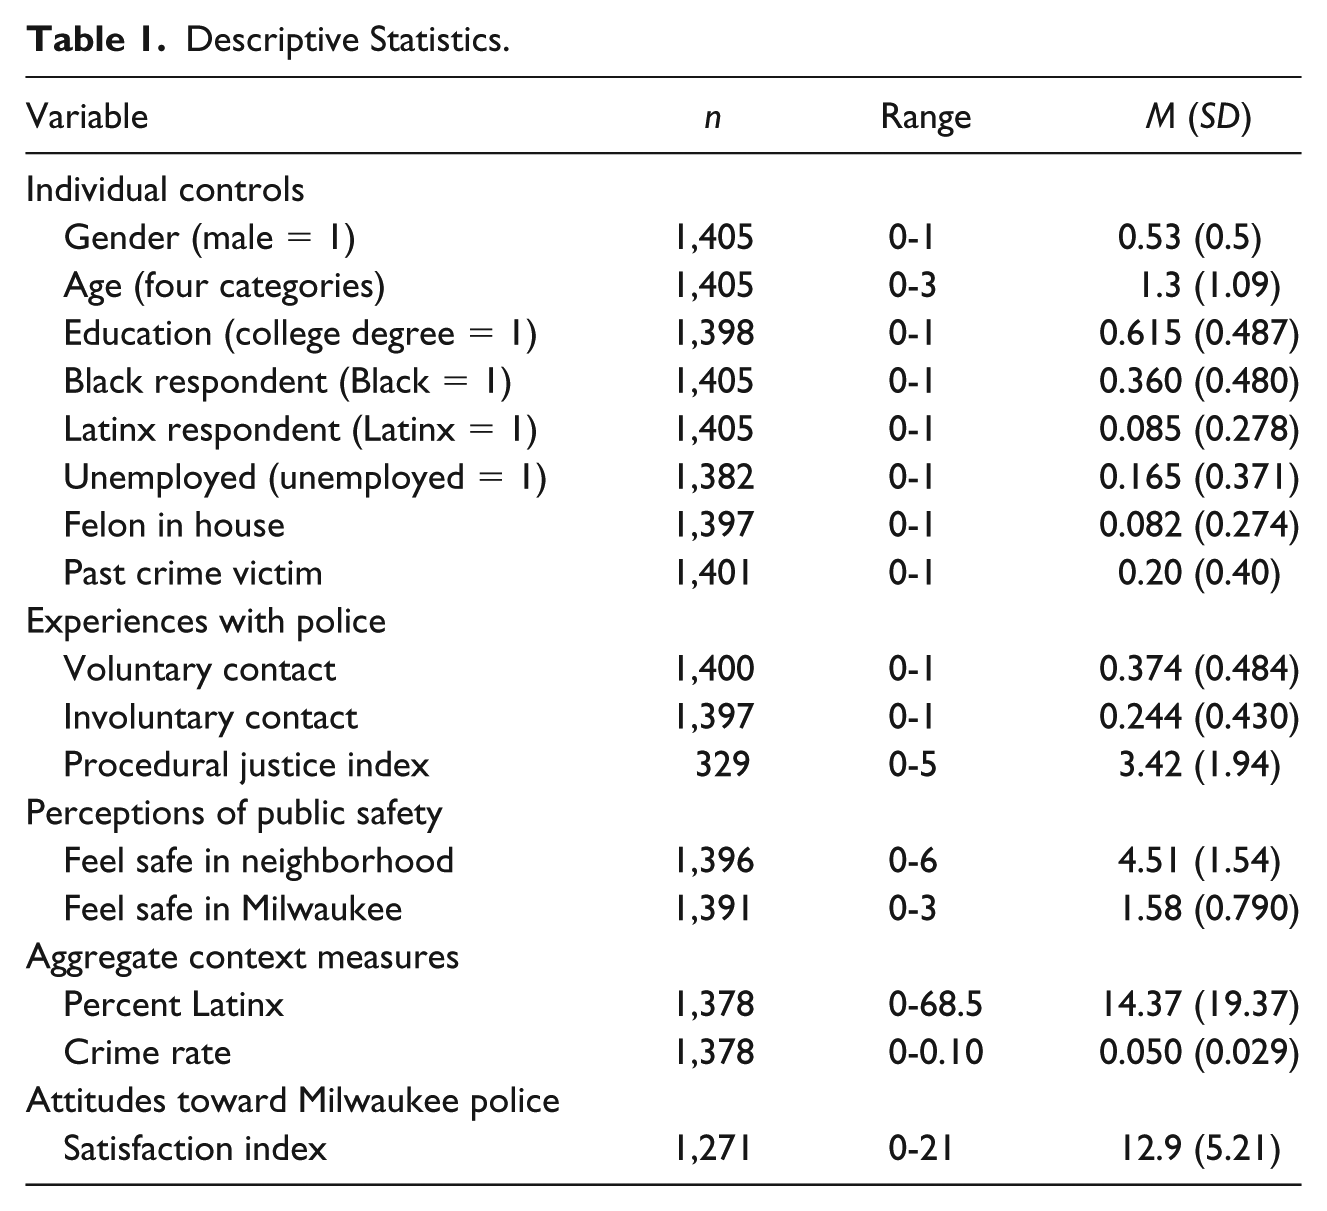
We now focus our discussion to the variation in satisfaction with the police across key explanatory variables.
Multivariate Models
Table 2 displays the results for the five full sample models for the satisfaction with police index. In Model 1, we examined the impact of demographic characteristics on satisfaction with police. We found that older respondents were more supportive of the police (b = .338; p < .001), while being more educated (b = –.797; p < .01), Black (b = –.2.94; p < .001), and a past crime victim (–2.16; p < .01) 9 were associated with lower levels of satisfaction net of the other variables in the baseline model. This finding is consistent with previous research (Dowler & Sparks, 2008; Frank, Smith, & Novak, 2005; Reisig & Parks, 2000; Sampson & Bartusch, 1998) that African American respondents tend to report significantly lower levels of satisfaction with the police than other racial/ethnic groups. Noteworthy and contrary to our expectations, we found that Latinx respondents’ attitudes did not significantly differ from non-Latinx respondents. As discussed in our review of the literature, there is little consensus on whether Latinx’ support for police aligns closer to Whites or African Americans, but our findings are consistent with Cheurprakobkit’s work (2000), which suggests that Hispanic/Latinx views of law enforcement are more comparable with Whites.
Random Effects Unstandardized Regression Coefficients: Satisfaction With Police Index.

p < .05. **p < .01. ***p < .001.
The second model included the demographic and control variables plus the aggregate percent Latinx and crime rate variables. Once again, older respondents were significantly more likely to report higher levels of police satisfaction, while respondents who were college-educated, Black, and recent crime victims were significantly more likely to report lower levels of satisfaction with the police. With regard to the aggregate measures, crime rate is nonsignificant, 10 but the percent Latinx is statistically significant and positive. As random effects coefficients capture both the within-entity and between-entity effects, the results of Model 2 show the average increase of police satisfaction (1.9%) when the percent Latinx increases across zip codes by 1%. In Model 3, we include the two different types of police contact measures. The results here show that the previously significant control variables (i.e., education, race, age, and victimization) all remain statistically significant and in the expected directions net of the other variables in the model. Neither of the type of contact measures were statistically significant; respondents who reported voluntary contact with the police did not significantly differ in their satisfaction with the police compared with respondents who did not report this type of contact. The same is true for respondents that reported involuntary police contact. The results of Model 3 indicate that with respect to these data, voluntary contact and involuntary contact with the police are not salient factors in explaining variation in satisfaction with the police.
Model 4 contains demographic covariates, perceptions of public safety, and aggregate-level predictors (i.e., percent Latinx and crime rate) and yields two important findings. First, even though Black respondent, college education, younger age, and criminal victimization remain statistically significant, the magnitude of those four coefficients all decrease in Model 4. The coefficients for the Black respondent and crime victim variables shrink considerably. In fact, the difference in the coefficients for Black respondent (d = –.8) is approximately 5 times greater than the standard deviation of the difference between the two variables (sd = .16), indicating that the reduction in the Black respondent coefficient from Model 2 to Model 4 is statistically significant. The same calculation shows that the difference in the crime victim coefficient between Models 2 and 4 is also, d = .87; sd = .209, statistically significant (see Clogg, Petkova, & Haritou, 1995 for comparing coefficients across nested models). Second, the perceived public safety measures are both statistically significant (.903; p < .001 and 2.03; p < .001, respectively) and drive the changes in Model 4. Adding the perceived safety measures contributes to explained variability in a substantive and meaningful way (an increase in R2 of .199 or more than a doubling from Model 3 to Model 4.).
Model 5, or the full model, contains demographic measures, experiences with police, perceptions of public safety and aggregate-level predictors. The results for this final model replicate from Model 4. Net of the other covariates in the model, older respondents and respondents who reside in areas with greater concentrations of Latinx individuals report higher levels of satisfaction with the police. Respondents who report feeling safe in their communities and in Milwaukee are also more likely to report higher levels of satisfaction with the police. In fact, our results indicate that these two variables are especially salient. For example, even after statistically controlling for the other covariates in the full model, feeling Milwaukee is very safe compared with feeling it is not at all safe produces a difference in satisfaction with police of 8.12 (2.03 × 4) points. Given a standard deviation of 5.21 on the policing satisfaction index (Table 1), such a swing is both practically and statistically significant. On the contrary, African American respondents, college-educated, and past crime victims report lower levels of satisfaction with the police.
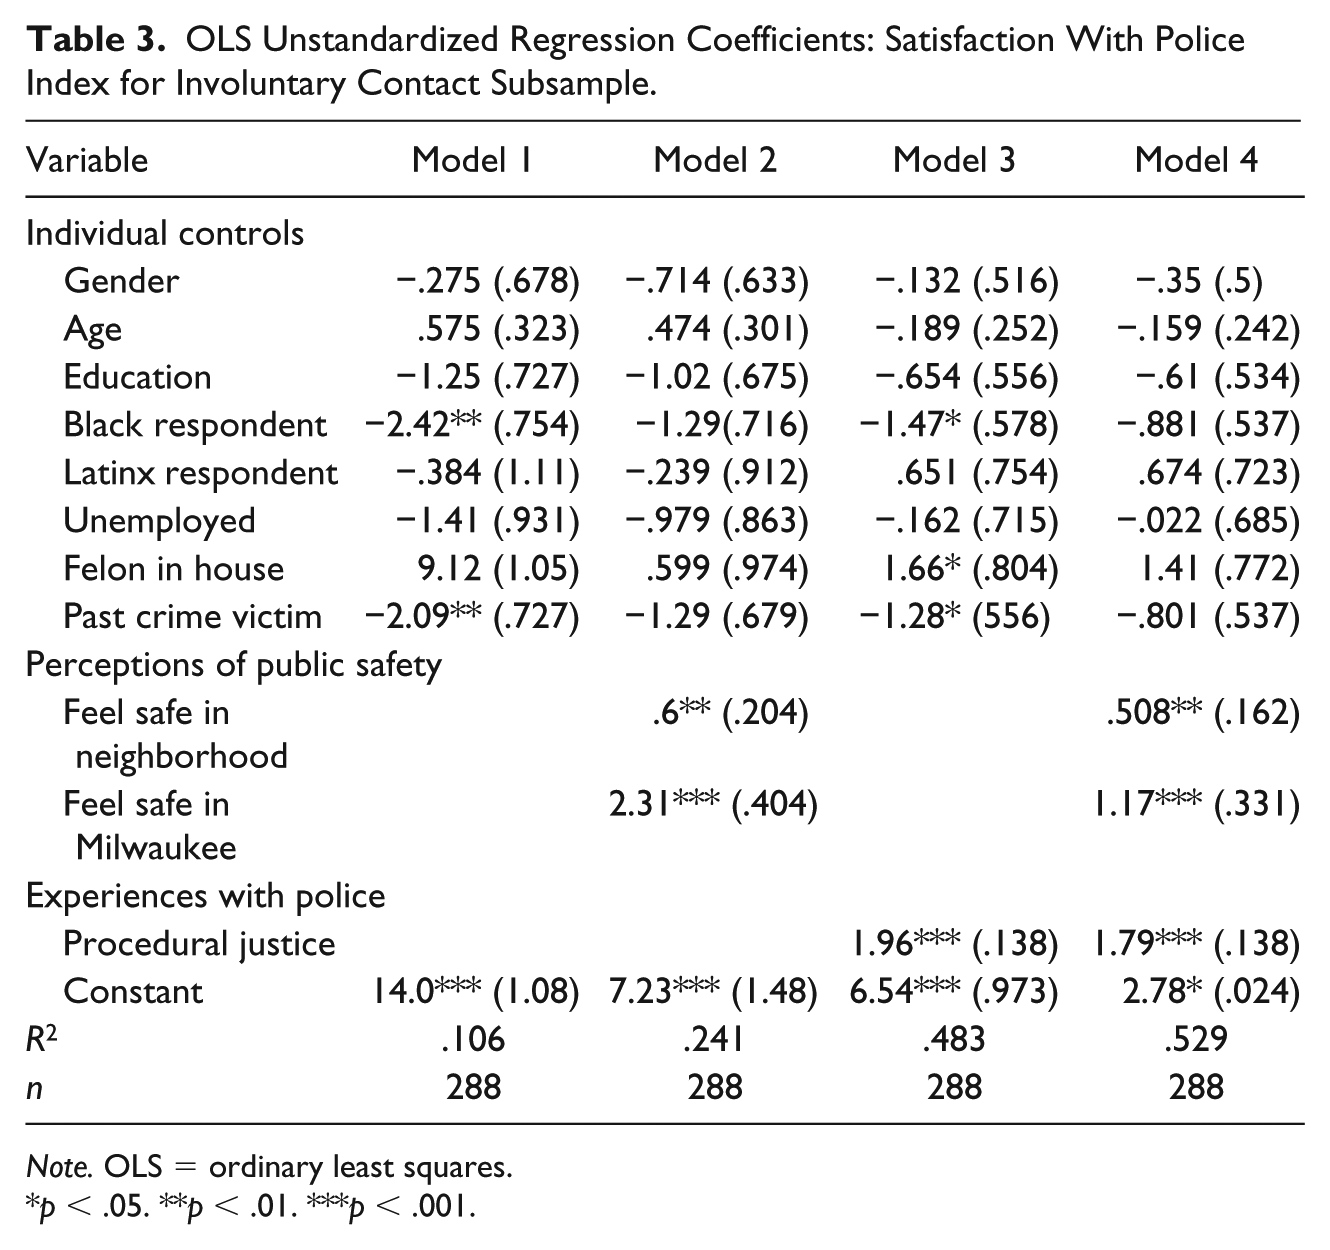
For analyses on the involuntary contact subsample, type of contact variables and the aggregate variables were removed. In their place, we added measures related to respondents’ experience during their contact with police. These variables measured perceptions of the legitimacy of the stop, the treatment respondents received from police, and their satisfaction with the encounter. These measures were used to create a procedural justice index. The analyses presented in Table 3 examine the salience of procedural justice variables in predicting satisfaction levels among a subset of the sample who had an involuntary (police-initiated) contact with the police. Contact with the police, however, is not a stochastic process. Rather, research repeatedly indicates that certain subgroups of the population are more likely to experience involuntary police contact (American Civil Liberties Union [ACLU], 2015; Ingram, 2007; Mastrofski, Reisig, & McCluskey, 2002; Weitzer, 2015; Weitzer & Tuch, 2004) and thus estimated coefficients are at risk of bias due to an unobserved underlying selection process.
OLS Unstandardized Regression Coefficients: Satisfaction With Police Index for Involuntary Contact Subsample.
Note. OLS = ordinary least squares.
p < .05. **p < .01. ***p < .001.
To account for this potential problem, we employed a two-stage Heckman selection procedure (Heckman, 1979). The results from the Heckman models indicated that men (.163; p < .05) and victimized respondents (.486; p < .001) were more likely to report involuntary contact, whereas older respondents (–.092; p < .05) were less likely to report the same type of police contact. The inverse mills ratio (sigma × rho) coefficient was nonsignificant (4.918; p = .269), suggesting that respondents in the involuntary contact subsample hold views of the police that do not differ significantly from the views of the police of a randomly drawn sample with average population characteristics. 11 The substantive results from the Heckman models replicate the results with regard to tests of significance and the coefficients between the two models are close in magnitude. 12 Therefore, we report and discuss the results of standard OLS (satisfaction with police index). We ran four regression models. The first model entered individual control variables, the second added perceived public safety measures, the third included the procedural justice index, and the fourth, the full model, included all the aforementioned covariates.
The results shown in Table 3 demonstrate the importance of race, experiences with victimization, perceptions of public safety and procedural justice in predicting satisfaction with the police. In Model 1, Black respondents and respondents who experienced a criminal victimization were significantly less likely to express satisfaction with the police. After adding perceived safety measures in Model 2, the Black respondent variable and the victimization covariates are reduced to nonsignificance. The coefficients for both these variables substantially shrank while the standard errors remained relatively stable across Models 1 and 2. This finding suggests that once we statistically account for perceptions of safety, levels of satisfaction with the police do not significantly differ across racial and ethnic subgroups of respondents that experienced involuntary police contact. In Model 3, we include the procedural justice index to the baseline model and find that it is also a significant predictor of satisfaction toward the police. We find it noteworthy, however, that while the coefficients for Black respondents and past criminal victimization were reduced to nonsignificance with the introduction of perceptions of safety items, they remain statistically significant even after the introduction of the procedural justice index. In sum, perceptions of safety and procedural justice are both clearly key explanatory variables, as evidenced by the increases across the model R2 estimates but perceptions of safety, and not procedural justice, account for racial differences in satisfaction with police.
Discussion
Consistent with previous studies, we found that race plays a crucial role in conditioning the ways people view the police. In all our models utilizing the entire sample, Black respondents were significantly less likely to be satisfied than Whites and Latinx respondents. This finding alone, however, is hardly groundbreaking and merely supports the findings of extant research (e.g., Cao et al., 1996; Garcia & Cao, 2005; Gau et al., 2012; Huang & Vaughn, 1996; Sampson & Bartusch, 1998; Tuch & Weitzer, 1997). What was surprising was that the Latinx respondent covariate was not significant in any of the models. Instead, consistent with Cheurprakobkit (2000), we found that levels of support for law enforcement among Latinx respondents were not discernible from the views of White respondents. We find that contact with law enforcement is unable to account for racial differences in support for police. These data also demonstrated that voluntary contacts (typically more positive in nature) for Latinx respondents were significantly lower than both White and African American respondents, and levels of involuntary contact did not differ significantly across the three racial/ethnic categories we examined. If experiences with the police are unable to account for African American and Latinx differences in support for the police, then what factors can explain it?
There is some evidence to suggest that the patterns in the data are the artifact of complex histories of Black and Latinx groups in the United States generally and Milwaukee specifically. There is a much longer history of discrimination and harassment against Blacks in our country. As Bobo (1999) found, “members of more recent and voluntarily incorporated minority groups. . . ,” such as Latinx individuals, report feeling “. . . less alienation than members of long-term and involuntarily incorporated minority groups” (p. 461). Even when Latinx victims are the subject of police violence, these incidents do not consistently invoke the same level of outrage and protest. Recent examinations show that even though Latinx victims are disproportionately killed by law enforcement, 13 there tends to be less attention and focus on these incidents relative to when African American victims are killed by police 14 (Rojas & Schmidt, 2016). Our study lends additional empirical evidence that feelings of skepticism and mistrust are more diffuse among African Americans than other groups, supporting the results of other work in this area (Berg, Stewart, Intravia, Warren, & Simons, 2016; Brunson, 2007; Gau & Brunson, 2010; Sampson & Bartusch, 1998; Stewart et al., 2009).
We found that the Black respondent variable remained statistically significant in all the analyses involving the full sample of respondents (Table 2). Also significant was our community context measure percent Latinx; respondents who resided in areas with greater concentrations of Latinx individuals also held more positive views of the police than areas with lower populations of Latinx residents, irrespective of having a contact with the police, how safe they felt, or official crime rates in their area. We also found it noteworthy that our measures of perceptions of public safety were important predictors of satisfaction with the police, whereas our contextual measures assessing actual crime (rates) were not. This is consistent with prior research, which has found perceptions of crime and safety have the strongest influence on assessments of police (e.g., Dowler & Sparks, 2008; Gau et al., 2012; Nix, Wolfe, Rojek, & Kaminski, 2015; Reisig & Parks, 2000). When considering the specific measures that comprised our perceptions of public safety concept, this also highlights the distinction between different types of crime evaluations on views of the police.
One of our primary goals was to determine why African Americans express lower levels of satisfaction with police. Although including perceptions of safety significantly reduced the magnitude of the Black respondent coefficient, we were unable to fully account for lower levels of reported satisfaction with the police on the part of African American respondents in the full sample. Focusing our analysis on just those respondents who reported experiencing police-initiated contact yields two findings. First, procedural justice is a significant predictor that explains considerable variation across satisfaction with the police for the subsample (the R2 jumps from .106 in Model 1 to .483 in Model 3). This finding is consistent with much of the existing literature in procedural justice and police evaluations (Mastrofski, Snipes, & Supina, 1996; Mazerolle et al., 2013; Sunshine & Tyler, 2003; Tyler & Huo, 2002). Second, Models 2 and 4 show that when perceptions of safety measures are included in the analysis, the Black respondent coefficient is reduced to nonsignificance. 15 This noteworthy finding advances research concerning racial minorities’ police evaluations and it partly accomplishes one of our primary goals.
With regard to the subsample of respondents who have experienced police-initiated contact, once we statistically controlled for perceptions of safety, police evaluations for African American respondents were not statistically different than Latinx or White ones. For example, in the subsample, the satisfaction with police mean values for African American respondents who felt safe (12.32) was comparable with the mean estimates for White and Hispanic/Latinx respondents who reported police-initiated interaction (12.85). 16 Conversely, the satisfaction with police mean estimate for African American respondents who felt safe was nearly half a standard deviation higher than for African American respondents who felt less safe (M = 9.87; SD = 5.72). Our subsample findings support Wolfe et al.’s (2016) contention that the importance of procedural justice on police evaluation is largely invariant. We would add that model specifications should include measures of perceived safety to find support for the invariance thesis. We now turn to the policy implications of our study.
Policy Implications
Our study highlights the importance of experience with the police in shaping individuals’ attitudes toward the police. Interactions with law enforcement are too frequently perceived as lacking courtesy and respect (i.e., procedural justice), ultimately having a deleterious effect on satisfaction with the police and other important outcomes (see Nix et al., 2015). We offer two specific policy prescriptions. First, we endorse efforts to include “procedural justice training” for law enforcement. Currently, this has become part of the core curriculum in police academies across the world including the United States, the United Kingdom, and Australia (Fildes & Thompson, 2016; Rosenbaum & Lawrence, 2017). Training may be explicitly and exclusively devoted to procedural justice, but may also exist as a component of a larger training course (e.g., on community policing, bias-free policing). Regardless of its mode of delivery, training on procedural justice typically comprises four essential components: (a) giving individuals a voice, (b) exhibiting neutrality in decision making, (c) treating individuals with dignity and respect, and (d) conveying trustworthy motives during police encounters (Tyler & Huo, 2002). The results of our research are consistent with these changes to police training; strengthening and expanding these training programs would likely bear the fruit of improved relationships between the police and communities of color.
The second policy prescription addresses the important finding that perceptions of safety play a critical role in influencing attitudes toward the police. In our full model, perceptions of safety in one’s neighborhood and the city of Milwaukee more generally were salient predictors of satisfaction levels. They were also central in our analyses involving the involuntary contact subsample; they reduced the impact of race on satisfaction with the police to nonsignificance. Consequently, “[f]rom a policy point of view, improving the neighborhood conditions of minorities would go a long way in improving attitudes toward the police” (Dowler & Sparks, 2008, p. 410). Police might work with community members directly toward this end, such as organizing or participating in neighborhood clean-ups, or they might work with other local government agencies (e.g., garbage/sanitation, health, code enforcement) to eradicate many of the disorderly conditions that give off crime-promoting signals and make resident feel unsafe.
Limitations and Directions for Future Research
This study set out to unpack the complicated role racial background plays in shaping views toward the police. Our work contributes to support for the police literature, but our efforts are not without limitations that future research in this area should consider addressing. First, this study relies on self-reported interactions, which revealed similar rates of involuntary police contact across White, Black, and Latinx respondents. Studies that focus specifically on official police reports of traffic stops and searches often yield substantively different results regarding the distribution of law enforcement contact across racial groups (Pierson et al., 2017). We would like to see future research incorporate both official and self-reported interactions with the police and their impact on attitudes toward law enforcement. Finally, our aggregate measures capture geographic characteristics at the zip code level. Although we observed considerable variation in aggregate unit characteristics, this is admittedly a large geographic unit of analysis. We were unable to truly capture potential “neighborhood” effects on satisfaction with the police and thus we were unable to account for community cohesion or collective efficacy as a neighborhood process (Sampson, Raudenbush, & Earls, 1997), even indirectly. Future research might include census tract indicators of cohesion and efficacy in its analysis (such as Nix et al., 2015), or measure characteristics of even smaller microgeographic spaces when examining the role of context on support for the police. Doing so could shed further light on the complex ways in which geography and space shape our views and thus provide a deeper understanding of social processes that result in satisfaction with the police, the criminal justice system, and social institutions more generally. In our view, this goal is imperative to foster improved relationships between communities of color that report high levels of distrust and antipathy toward the police, who are in turn tasked with the managing the challenges of law enforcement in contemporary American society.
Footnotes
Acknowledgements
The authors acknowledge the University of Wisconsin-Milwaukee Center for Urban Initiatives & Research, the Milwaukee Fire and Police Commission, and Joseph Cera for their efforts in designing and conducting the project that generated the survey data we analyze in this paper. We are also grateful to Michael D. Reisig for his feedback on earlier drafts of this work and Elizabeth Lyne, Marshall Freeman and Ray’Netta Pierce for their invaluable research assistance.
Declaration of Conflicting Interests
The author(s) declared no potential conflicts of interest with respect to the research, authorship, and/or publication of this article.
Funding
The author(s) received no financial support for the research, authorship, and/or publication of this article.
