



Abstract
This study examined the impact of business improvement districts (BIDs) on street block robbery counts in Cincinnati, OH. The relationships among BIDs (as well as other relevant control measures) and street block robbery counts were then examined using negative binomial regression models. Results showed that BIDs played an important role in the spatial patterning of robbery at the street block level. Street blocks within BIDs experienced higher street robbery counts even after controlling for street network betweenness and the presence of potentially criminogenic places within and around BIDs. Although previous research suggests BID implementation leads to crime reductions, the present study shows BIDs still provide ample opportunities for criminal activity as one component of the environmental backcloth.
Introduction
Business improvement districts (BIDs) are a modern invention for revitalizing urban commercial areas (Hoyt & Gopal-Agge, 2007; Mitchell, 2001). BIDs are delineated geographically as a relatively small area of contiguous properties. BIDs are created through legislation after a majority of local property and business owners agree to their formation. Properties within BIDs are assessed an extra tax, which is reinvested into the area’s physical, marketing, and security infrastructures (Houstoun, 2003; Ward, 2007).
BIDs have been shown to influence their local communities in many ways (Brooks, 2008). Relevant to this study, research suggests creating BIDs is associated with crime reductions in the local area (Brooks, 2008; Cook & MacDonald, 2011; Hoyt, 2004; MacDonald, Stokes, Grunwald, & Bluthenthal, 2013). However, crime and place research has also consistently shown that crime is disproportionately concentrated within select places (e.g., Andresen & Linning, 2012; Andresen & Malleson, 2011; Pierce, Spaar, & Briggs, 1988; Sherman, Gartin, & Buerger, 1989; Weisburd, Groff, & Yang, 2012), particularly if they are places that attract a lot of people (e.g., Bernasco & Block, 2011; Haberman & Ratcliffe, 2015). Thus, while the creation of BIDs may produce a prevention benefit, it may not completely remove the opportunity for criminal activity. That is, whether or not crimes concentrate near BIDs, or if BIDs themselves affect spatial crime patterns, remains unclear, as prior research has primarily focused on the impact of new BID implementation. As outlined below, crime and place theories provide a framework for thinking about how BIDs, as a general component of the environmental backcloth, might link to higher or lower overall crime levels via different theoretical mechanisms. Therefore, the present study examines whether BIDs affect spatial crime patterns even after controlling for other theoretically relevant features of the environmental backcloth.
Literature Review
BIDs
BIDs are relatively new. The first BID was created in Toronto, Canada, in 1970. Shortly thereafter, the first American BID was established in New Orleans, Louisiana, in 1974 (Hoyt, 2006). BIDs are now fairly common in cities throughout the world. As of 2008, all but two states have BID legislation guiding their implementation and operation, and it is estimated that up to 10,000 BIDs exist across the world (Mitchell, 2008) with over 1,000 in the United States alone (Becker, Grossman, & Dos Santos, 2011). Generally covering a relatively compact and well-connected geographic area, BIDs include a wide range of business types, such as food, entertainment, retail, and office space (Sands & Reese, 2017) making them akin to “malls without walls” (Lippert, 2010, p. 482).
BIDs can be described generally as legally authorized organizations that provide goods and services to defined geographic areas by levying additional taxes on property owners (Mitchell, 2008; Sands & Reese, 2017). They are typically established through a petition process brought about by property or business owners, and they receive most of their funding through an added property tax assessed to the entire district (Mitchell, 2001; Sands & Reese, 2017). In other words, businesses cannot opt out of the tax, and all businesses contribute and benefit from improvements implemented by the BID.
BIDs implement services through both private and public organizations, such as nonprofits or local government agencies. They focus on issues affecting their entire district, typically through the use of a governing board made up of property and business owners (Mitchell, 2001). These issues can vary across districts, but tend to include things such as security, neighborhood beautification, event planning, marketing, and promotion (Houstoun, 2003; Mitchell, 2001). Although there is variation across BIDs in their implementation style, the structure of BIDs sets them apart from other similar groupings of businesses without a centralized management organization.
The Effect of Implementing BIDs on Crime
Although the literature discussing the positive benefits of BIDs is vast (e.g., Briffault, 1999; Ellen, Schwartz, Voicu, Brooks, & Hoyt, 2007; Gross, 2005; Hoyt & Gopal-Agge, 2007; Mitchell, 1999, 2001), less is known regarding their influence on crime. The few studies examining the link between BIDs and crime have primarily focused on how implementing new BIDs changes crime levels. Although this study takes a different approach to studying the relationship between BIDs and crime, the existing research, which is reviewed below, certainly helped shape the present study.
First, Hoyt (2005) used sociodemographics and crime predictors to classify commercial areas as BIDs versus non-BIDs in Philadelphia using linear discriminant analysis. The results suggested that property crime, thefts, vehicle theft, and theft from vehicles could be used to differentiate between BID and non-BID areas. The author interpreted this finding to mean that implementing a BID reduced crime within the BID area by either increasing informal or formal social control. Next, Brooks (2008) compared Los Angeles BID areas to other similar areas. Initial results indicated that BID areas saw significantly reduced crime postimplementation when compared with (a) neighborhoods with similar levels of crime preimplementation, (b) neighboring areas, and (c) commercial areas that seriously considered but did not become BIDs. Third, Cook and MacDonald (2011) found that crime was lower after BIDs were implemented in Los Angeles police department reporting districts. Furthermore, increased security spending led to greater crime reductions, and there was no spillover effect from BID areas to non-BID areas. Overall, these studies suggest that implementing BIDs can reduce crime within and around them (Brooks, 2008; Hoyt, 2004, 2005).
Crime Within and Around BIDs
Although crime levels may change in BID areas relative to non-BID areas after implementation, BIDs ultimately become another important feature of the environmental backcloth once they are integrated into a city (Brantingham & Brantingham, 1993). Crime pattern theory (CPT) predicts that crimes are a function of people traveling to and from different places (Brantingham & Brantingham, 1995, 1984, 1993). According to CPT, human activity and interaction are structured around an environmental backcloth, which is defined as “the uncountable elements that surround and are part of an individual and that may be influenced by or influence his or her criminal behavior” (Brantingham & Brantingham, 1993, p. 6). Physically, this backcloth is comprised of nodes where people tend to congregate, such as work, home, and shopping outlets, and the pathways people take to get to and from nodes. The efforts of the BIDs, by definition, are designed to increase foot traffic in an area. Therefore, Brantingham and Brantingham’s (1995) notion of crime generators is particularly important for understanding how BIDs might affect spatial crime patterns. Crime generators experience higher crime levels because the large number of people using those places results in more convergences of motivated offenders and suitable targets lacking capable guardianship (Cohen & Felson, 1979). Because BIDs are designed to generate usage by definition, they might actually become crime generators in the environmental backcloth (Brantingham & Brantingham, 1995).
Of course, one might also argue that increased usage of BIDs links to lower crimes. Jacobs (1961) notion of “eyes on the street” could certainly be present in BIDs. In other words, informal social control (or guardianship) may be higher in BIDs because BIDs increase user traffic in an area, thereby reducing crime within and around them.
In addition, a distinguishing characteristic of BIDs is that business owners voluntarily opt to form and/or join their BID to enjoy the benefits associated with BID membership. Levy (2001) likens the use of BIDs to other commercial properties that have a single owner who oversees property management (e.g., shopping malls, office parks, and entertainment centers) because BIDs allow for a more streamlined management system that forces all businesses within a district to abide by a set of rules and regulations. Research on decision making by business owners indicates that place management choices may affect crime levels at individual places, such as bars or apartment buildings (Madensen, 2007; Madensen & Eck, 2008; Payne, 2010). Although their decisions are not necessarily always directly related to crime, the choices place managers make have an impact on the number and type of criminal opportunities available at their business (Madensen, 2007). This principle may apply to broader groupings of voluntarily partnered businesses as well. Research has found that security expenditures by BIDs correlate with less crime (e.g., Cook & MacDonald, 2011; Hoyt, 2004), suggesting that BID governing bodies may engage in behaviors that incentivize decisions, which prevent crime (Sampson, Eck, & Dunham, 2010). Therefore, BIDs could also provide a protective effect and experience less crime as a whole.
BIDs are also comprised of high activity nodes (e.g., restaurants, retail stores) located along well-traveled paths. Research stemming from CPT highlights the importance of different types of places, commonly called facilities, for understanding spatial crime patterns (Brantingham & Brantingham, 1995; Eck & Weisburd, 1995). Many of these places are found in BIDs, including bars, restaurants, and retail stores (for more in-depth examinations of facilities and crime, see Bernasco & Block, 2011; Haberman & Ratcliffe, 2015; Weisburd et al., 2012). In addition, to get to BIDs, people may use public transportation, such as buses, subways, or streetcars, each of which have been shown to influence spatial crime patterns (Block & Block, 2000; Block & Davis, 1996; Clarke, Belanger, & Eastman, 1996; Hart & Miethe, 2014). Likewise, research has linked commercial land use more generally to crime (e.g., Anderson, MacDonald, Bluthenthal, & Ashwood, 2013; Stucky & Ottensmann, 2009; Taylor, Koons, Kurtz, Greene, & Perkins, 1995). While not all commercial places are considered BIDs, all BIDs are used for commercial purposes. Studies generally show increases in criminal activity near commercially zoned and other nonresidential areas. Thus, an important unanswered question about BIDs and crime is whether or not they link to higher or lower crime in nearby areas, potentially via the mechanisms described above, regardless of the facilities located within them.
Integrating BIDs Into the Environmental Backcloth
Given the theoretical ideas discussed above, the maturity of BIDs in many U.S. cities, and recent advances in crime and place research methods, the present study builds on past work to understand how BIDs can affect spatial crime patterns in at least three ways. First, with the perspective that BIDs have become an integrated component of the environmental backcloth, the present study examines how their presence and proximity are related to crime levels at the microlevel. This is a stark contrast to past research. Whereas those studies sought to estimate the effect of introducing new BIDs on crime levels, the present study assumes BIDs are now well integrated into (at least some) cities’ backcloths and may have independent effects on spatial crime patterns via the theoretical mechanisms described above. Stated differently, BIDs may be a crime generator in the modern metropolis or they may provide a management structure that helps control crime despite being comprised of facilities that commonly link to higher crime. Prior research has not addressed this line of inquiry as it has been primarily focused on BID implementation.
Second, the past studies outlined above used larger spatial units of analysis, such as census areas (e.g., Hoyt, 2004) or administrative police areas (e.g., Brooks, 2008; Cook & MacDonald, 2011). Evidence from crime and place research suggests that smaller units of analysis better capture the spatial heterogeneity of urban crime patterns (Groff, Weisburd, & Morris, 2009; Weisburd et al., 2012). Therefore, this study draws on recent advances in crime and place research to model the microlevel impact of BIDs as a component of the environmental backcloth on microlevel crime patterns. Focusing on the actual street network provides a more realistic operationalization of how cities are used and crime patterns potentially emerge.
Third, if BIDs are truly an important component of the environmental backcloth, then they should have an independent effect on spatial crime patterns after controlling for other features of the environmental backcloth that have been previously linked to spatial crime patterns. For example, numerous studies have linked different facilities to spatial crime patterns (e.g., see Bernasco & Block, 2011). In addition, researchers have recently demonstrated how components of the street network can influence spatial crime patterns (e.g., see Davies & Johnson, 2015). Thus, to expand on findings of prior research, our study holds nodes and pathway features constant to assess the impact of BIDs on spatial crime patterns.
Data and Methods
The current study addresses these limitations by examining what effect BIDs have on street block robbery levels after controlling for the impact of a variety of facilities, street blocks’ location in the overall street network, and the surrounding areas’ sociodemographic composition.
Study Site
This study examines BIDs in Cincinnati, OH. Cincinnati is home to approximately 300,000 residents, which makes it the third largest city in Ohio. Cincinnati is racially diverse with just under 50% of the population identifying as White and nearly 45% of residents identifying as Black. The median household income of US$34,000 is well below the national average of US$54,000. An estimated 30% of residents live at or below the poverty line compared with the national average of 14% (U.S. Census Bureau, 2015).
In Cincinnati, BIDs are referred to as neighborhood business districts, but we will generally use the term BIDs for simplicity and consistency with the existing literature. The Cincinnati neighborhood business districts program began in the early 1990s. To date, there are 37 BIDs located in 32 of Cincinnati’s 52 neighborhoods (Cincinnati Neighborhood Business Districts United, 2017). Cincinnati BIDs are defined as contiguous commercial areas made up of retail stores, restaurants, personal services, and other similar “walk-in” customer-oriented businesses (Fischer, 2016). BIDs are typically located on primary streets that are important to neighborhood functioning. The Cincinnati BID program allocates roughly US$2 million annually to fund improvement projects across BIDs. Roughly US$1 million comes from community development block grant funds and another US$1 million comes from city capital funding. From 1995 to 2016, approximately US$40.9 million in public funds leveraged more than US$383 million into private investment in Cincinnati’s BIDs (Fischer, 2016). Figure 1 provides an illustration showing the locations of Cincinnati BIDs throughout the city.
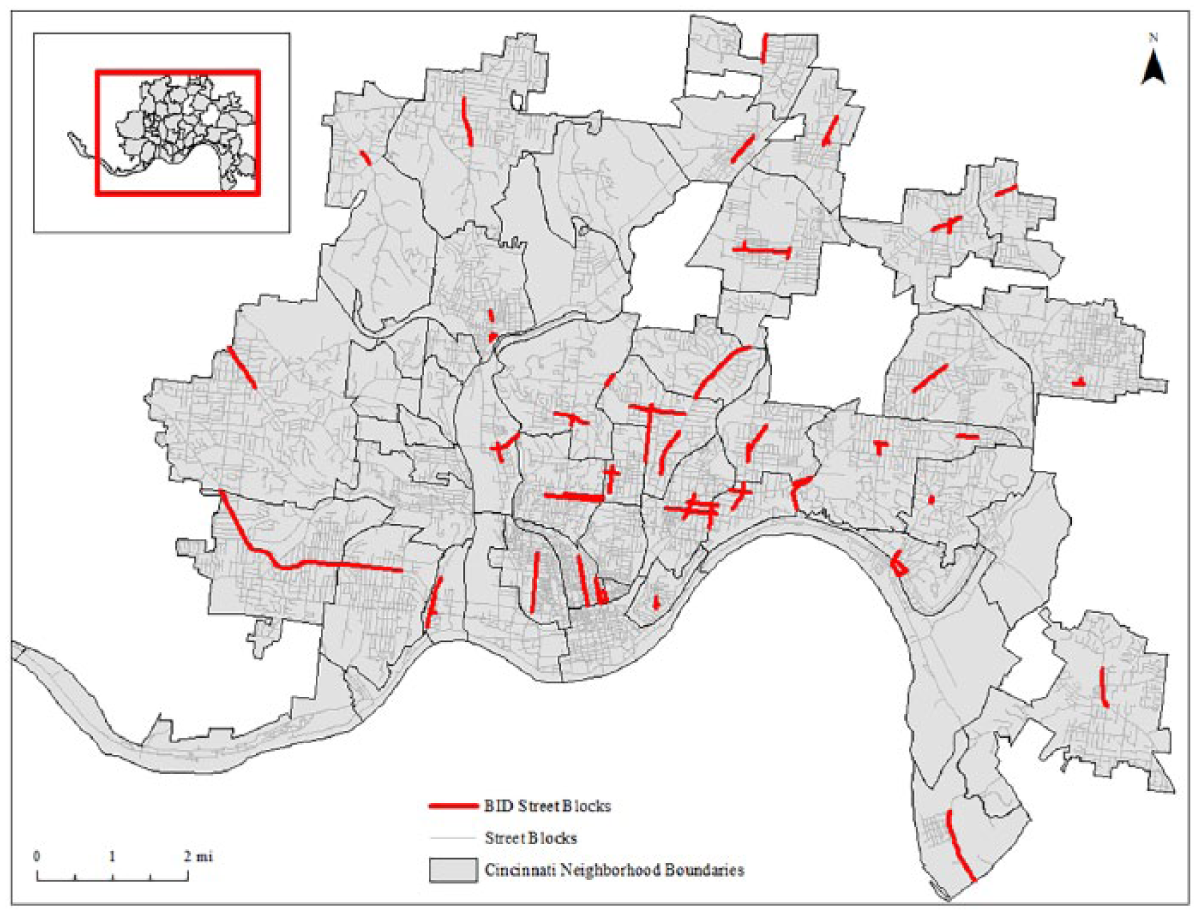
Business improvement districts (BIDs) by street blocks in Cincinnati.
Spatial Units
Street blocks are the unit of analysis in this study. Street blocks (which also may be referred to as street segments) are defined as both sides of a street between two intersections (Taylor, 1997, 1998; Weisburd et al., 2012). Street blocks were chosen as the unit of analysis for the following reasons. First, BID designations are street block–specific, so it is easy to identify BID and non-BID areas using street blocks. Second, research has shown that crime varies from street block to street block, even within high crime areas (Braga, Hureau, & Papachristos, 2011, 2010; Groff et al., 2009; Groff et al., 2010; Weisburd et al., 2004; 2012). Third, street blocks are theoretically important to the study of crime and place as they approximate behavior settings for human activity (Taylor, 1997, 1998; Wicker, 1987). In other words, street blocks serve as spatial containers for recurring human activity patterns where people who frequent street blocks get to know one another, develop roles within the small-scale community, and accept the norms and patterns of the activities that occur there (Taylor, 1997). Overall, street blocks provide a realistic unit for how people use the environmental backcloth.
Street blocks were derived from a countywide street centerline data set (n = 32,734; CAGIS, 2017). Consistent with past research, the street centerline data required cleaning to represent true street blocks as described above (e.g., see Schnell, Braga, & Piza, 2017, Note 6). First, all street blocks within Cincinnati’s limits with a valid address range (i.e., at least one address was located on the segment) were queried. Second, all streets digitized as two separate centerlines were generalized into a single feature. Third, irregular intersections were cleaned to ensure street blocks each represented a single street block between true intersections. Finally, streets contained within universities or colleges with private police departments, and for which no crime data were available, were removed. This resulted in 10,940 street blocks averaging roughly 500 ft in length.
Dependent Variable
Street block robbery counts are the dependent variable. CPT proposes that the spatial patterning of criminal opportunity is a function of human activity in public spaces, and public space robberies among strangers require these mechanisms by definition. We thus opted to use robbery as our dependent variable, as opposed to any other type of crime, as it was best suited to our theoretical frame. CPT also stresses crime-specific outcomes (Brantingham & Brantingham, 1978, 1981, 1984), we thus include only robberies where offender(s) took property by force or threat of force from a stranger(s) in a public or semipublic location. 1 Furthermore, previous research examining the impact of certain types of places on crime (e.g., Bernasco & Block, 2011; Haberman & Ratcliffe, 2015; Ratcliffe, 2012) has routinely used a similar definition thus making the results comparable with past work. Finally, this definition of robbery avoids the tautology of modeling robberies that occur at facilities (i.e., commercial robberies) with facilities.
The robbery data were procured from the Cincinnati police department (CPD). CPD provided robbery incident data for the year 2016 (n = 1,339). All CPD robberies were coded at specific addresses, thus avoiding the problem of how to treat incidents coded at intersections (e.g., see Weisburd et al., 2012). Qualitative coding of officers’ narrative reports was used to identify all robbery incidents fitting the above definition. After geocoding just those robberies to the street block level using a dual-range address locator at a 99% hit rate, 922 robberies were aggregated to street blocks.
Independent Variables
First, two independent variables captured the presence and proximity of BIDs. A BID indicator was coded “1” for all street blocks that are part of the BID and “0” otherwise. In the literature review, we described two possible relationships between BIDs and robbery. If BIDs are a crime generator in the urban landscape, the effect of this variable on street robbery will be positive in the regression models described below. If BIDs provide a crime protective effect, then the effect will be negative.
Numerous studies have found different crime generators also “radiate” crime opportunities to nearby areas (e.g., Bernasco & Block, 2011; Bowers, 2014; Groff, 2011; Groff & Lockwood, 2014; Ratcliffe, 2012). This may also be true about BIDs. Thus, each street block’s street network distance to the nearest BID was captured in terms of feet. Street blocks within BIDs were assigned a value of zero on the BID network distance measure. BID network distance was measured from street block midpoints to the nearest BID using ArcGIS Network Analyst’s Closest Facility tool. We hypothesize the same two-tailed interpretations as the BID indicator are possible for the BID street network distance measure.
Second, street blocks’ centrality within the overall network was captured with betweenness scores (Davies & Johnson, 2015). Betweenness is generally calculated for each street block by dividing the number of times it would be included in the shortest paths between all possible pairs of street blocks in the street network by the total number of street block pairs in the street network (Barthélemy, 2004). Betweenness scores are thus relative to their respective network with higher betweenness scores representing greater human usage potential (Davies & Johnson, 2015).
A primal street network data set (Porta, Crucitti, & Latora, 2006) based on the unedited CAGIS street network for all of Hamilton County was used to calculate the betweenness scores. This provided two major benefits. First, it ensured travel distances were representative of human behavior by allowing shortest paths to include edges that would not represent true street blocks based on the definition above (e.g., access roads without address ranges) that were excluded from the analysis data set, but would likely factor into true human travel behavior. Second, the inclusion of street blocks in the county surrounding Cincinnati mitigated the impact of edge effects when computing centrality measures (Gil, 2017).
Betweenness scores were calculated using the Urban Network Analysis Toolbox for ArcGIS (UNA; Sevtsuk & Mekonnen, 2012; Sevtsuk, Mekonnen, & Kalvo, 2016). Betweenness was computed using the midpoints of the analysis street blocks described above as the units of analysis and the unedited street network file to compute travel distances (i.e., geodesics). In fact, one recognized advantage of using UNA is that it can compute centrality measures for features (such as buildings or street block midpoints) that are not necessarily an edge/node in the underlying network in a traditional sense (Sevtsuk et al., 2016). A cutoff radius of one mile was used to ensure that betweenness scores capture more local effects consistent with the distances pedestrian usually travel in urban areas (Krizek, Forsyth, & Baum, 2009). Because betweenness values are relative to the specific network and the raw values had a large range, the variable was z-scored before entering it into the model to ease interpretation.
Third, additional predictors captured potentially criminogenic facilities on or nearby each street block. 2 Four predictors captured the number of facilities associated with entertainment activities: (a) eating places (n = 575; count), (b) bars and night clubs (n = 153; count), and (c) entertainment sites, which included amusement parks, arcades, art galleries, bowling alleys, casinos, museums, sports arenas, theaters, and other landmarks/attractions (n = 76; indicator). In addition, the presence of (d) hotels (n = 27; indicator) on a street block controlled for the potential of tourists and visitors to facilitate street robbery opportunities.
Fourth, the potential for specific facilities to link to robbery because patrons may be traveling to/from the locations carrying cash, personal property, and/or purchased goods was modeled with seven predictors. (a) Retail stores consisted of consumer electronics stores, clothing stores, household items stores, jewelry stores, office supply stores, recreational equipment stores, thrift stores, florists, and discount stores (n = 694; count). (b) Everyday stores included convenience stores, gas stations, small/ethnic grocery stores, pharmacies, and tobacco/vape stores (n = 363; count). (c) Grocery stores included locations where patrons typically drive to/from shop for larger quantities of food/goods (n = 25; indicator). (d) Traditional pawnshops and check cashing stores were sometimes colocated, so they were captured with a single variable (n = 20; indicator). (e) Grooming/beauty stores consisted of barbershops, hair salons, nail stylists, waxing salons, and massage parlors (n = 179; indicator). (f) Laundry included self-service laundromats and full-service dry cleaners (n = 32; indictor). (g) Body art stores such as tattoo parlors and piercing studios were also measured (n = 18; indicator).
Fifth, eight additional facilities were modeled using indicator variables, which are as follows: (a) city parks (n = 47; indicator), (b) recreation centers and city pools (n = 38; indicator), (c) bus stops (n = 3,166; indicator), (d) public housing communities (n = 22; indicator), (e) public/private/charter high schools (n = 35; indicator), (f) higher education institutions (n = 9; indicator), (g) drug treatment centers (n = 42; indicator), (h) public libraries (n = 17; indicator), and (i) gang territory (n = 2,215; indicator). 3
Finally, Cincinnati BIDs are located across the entire city in areas with varying socioeconomic and demographic make-up. Although most BID street blocks are predominantly commercial areas, some include single and multifamily residential units or mixed-used buildings. In addition, street blocks around BIDs are commonly residential areas. Sociodemographic composition has long been linked to geographic crime levels (Bursik & Grasmick, 1993; Peterson & Krivo, 2010; Sampson, Raudenbush, & Earls, 1997; Shaw & McKay, 1942), and is an important component of the environmental backcloth (Brantingham & Brantingham, 1993). In addition, previous crime and place research has controlled for sociodemographic composition at the microlevel (e.g., Bernasco & Block, 2011; Haberman & Ratcliffe, 2015; Weisburd et al., 2012). Therefore, census block group data from the 2015 American Community Survey 5-year estimates were allocated to the street block level. Street blocks were assigned the sociodemographic measures of the surrounding census block group. When street blocks were on the borders of more than one census block group, they were assigned the mean of the surrounding census block groups’ sociodemographic measures. 4
Four commonly used control measures were derived to capture sociodemographic aspects of the environmental backcloth (Brantingham & Brantingham, 1993). Socioeconomic disadvantage was measured by the percentage of the population living at or below the poverty line. Residential mobility was measured as the percentage of the population who reported living somewhere else the previous year. Racial heterogeneity was measured as one minus the sum of the squared proportions of five race categories (White only, African American only, Hispanic only, Asian only, and all other races) where values close to zero indicate racial homogeneity and values close to the maximum value of 0.80 indicate racial heterogeneity (Gibbs & Martin, 1962; Chainey & Ratcliffe, 2005). Finally, total residential population was included as a control variable to account for the baseline population in and near the BIDs. Descriptive statistics for all of the variables are presented in Table 1.
Descriptive Statistics for All Model Variables.
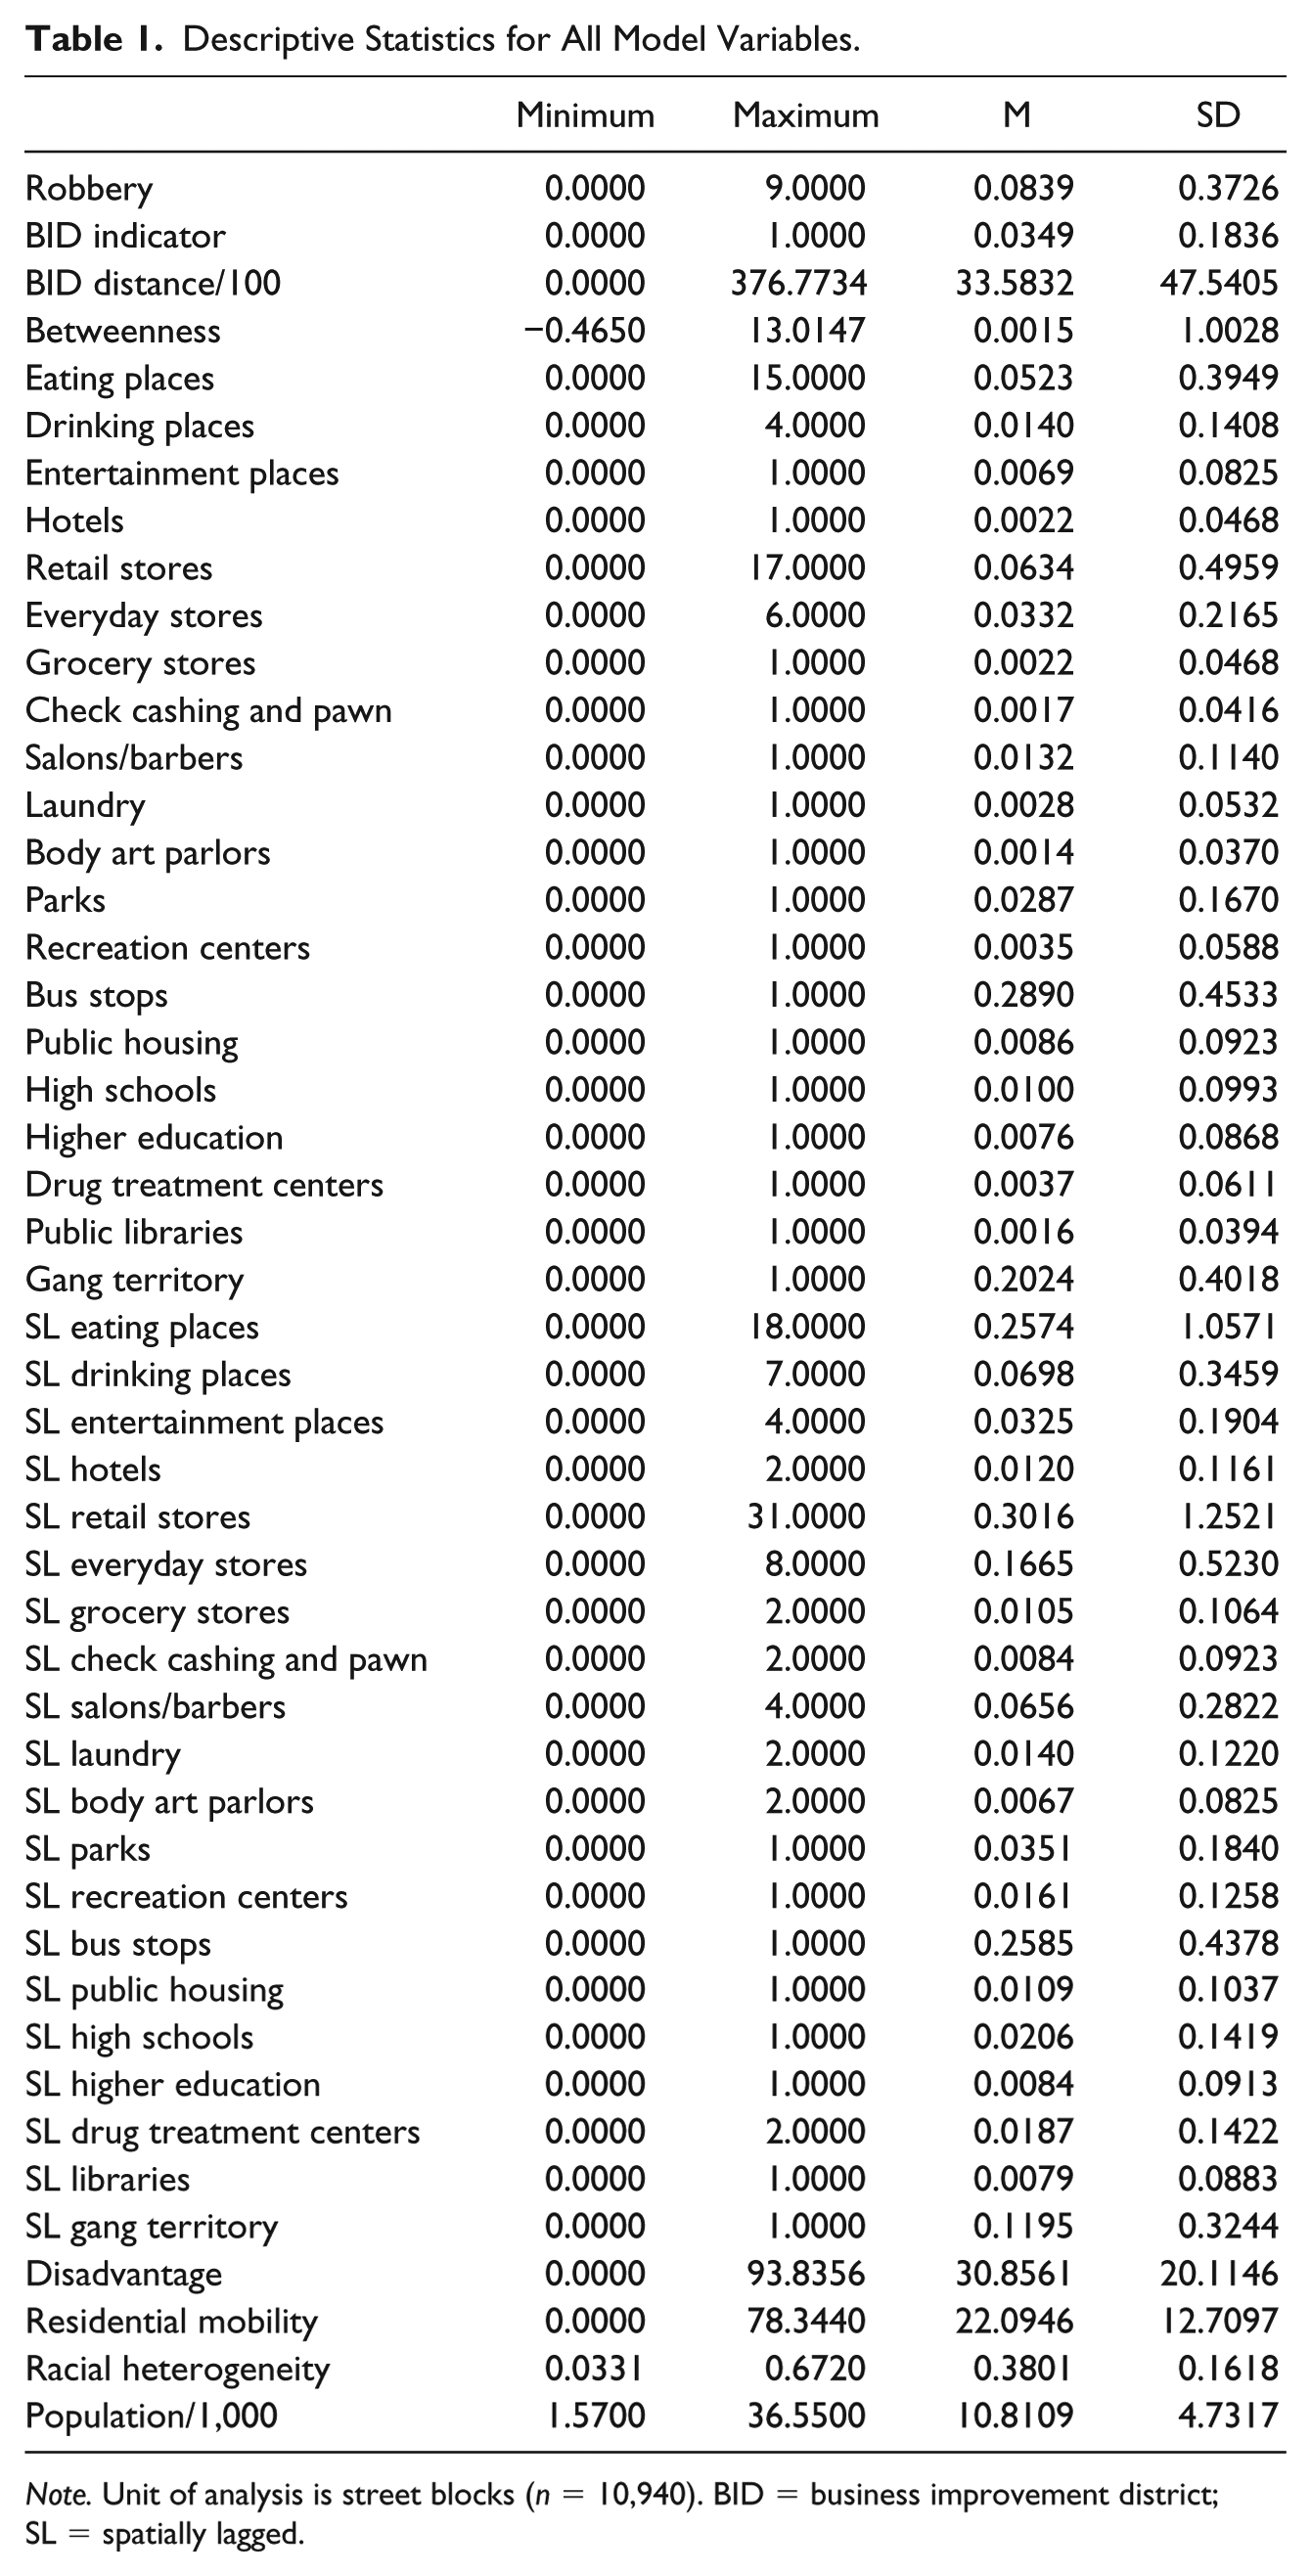
Note. Unit of analysis is street blocks (n = 10,940). BID = business improvement district; SL = spatially lagged.
Spatial Effects
Spatially lagged predictors are theoretically important as they capture facilities’ potential “spillover” effects (Bernasco & Block, 2011; Bowers, 2014; Groff, 2011; Groff & Lockwood, 2014; Ratcliffe, 2012). It is possible that facilities create robbery opportunities on nearby street blocks as well, which is especially likely for facilities that create pedestrian traffic as well as those where guardianship is high at the actual facility (Haberman & Ratcliffe, 2015). Wheeler (2016) argued the spatially lagged effects of some facilities could be greater than their spatially immediate effects. Therefore, the facility measures were spatially lagged using a first-order queen contiguity spatial weights matrix. For count variables, the spatially lagged predictors were the sums of the facilities on all neighboring street blocks. For indicator variables digitized as points, the spatially lagged predictors were the sum of neighboring street blocks with the facility present. For the indicator variables originally digitized as polygons, the spatially lagged predictors captured if the facility was located on a nearby block, but not located on the focal block. The latter operationalization was necessary because multiple street blocks may have been experienced a focal effect if the polygon-based facility could be accessed from it (see Note 3).
Analytic Plan
Negative binomial regression models were used to estimate the relationship between BID proximity and street block robbery counts net of the other predictors (for an overview see Cameron & Trivedi, 2013). Negative binomial regression models are appropriate for discrete count outcomes when overdispersion is present (Hilbe, 2007; Osgood, 2000). The need to model overdispersion was identified using graphs comparing the predicted and observed probabilities of expected counts for Poisson and negative binomial models as well as likelihood-ratio tests directly comparing the fit of Poisson versus negative binomial models (Long & Freese, 2014). All negative binomial regression models were estimated using the nbreg commands in Stata v.14. An offset variable of street block length in terms of feet was included in all models. Variance inflation factor (VIF) confirmed multicollinearity was unproblematic. Local Moran’s I test of standardized Pearson, standardized deviance, and Anscombe residuals confirmed spatial autocorrelation was unproblematic. 5
Results
Table 2 shows the negative binomial regression results directly estimating the impact of street blocks’ distances to the nearest BID and robberies per foot in street block length, net of the other variables in the models. BIDs were associated with significantly higher street block robbery levels, even after controlling for the types of facilities located within them. Expected robberies per foot in street block length were roughly 59% higher for street blocks within BIDs. Furthermore, expected robberies per foot in street block length decreased by about 0.7% every 100 ft a street block was from a BID. Stated differently, expected robberies per foot decreased by roughly 3.5% for each additional street block increment away from a BID.
Negative Binomial Regression Models Results.
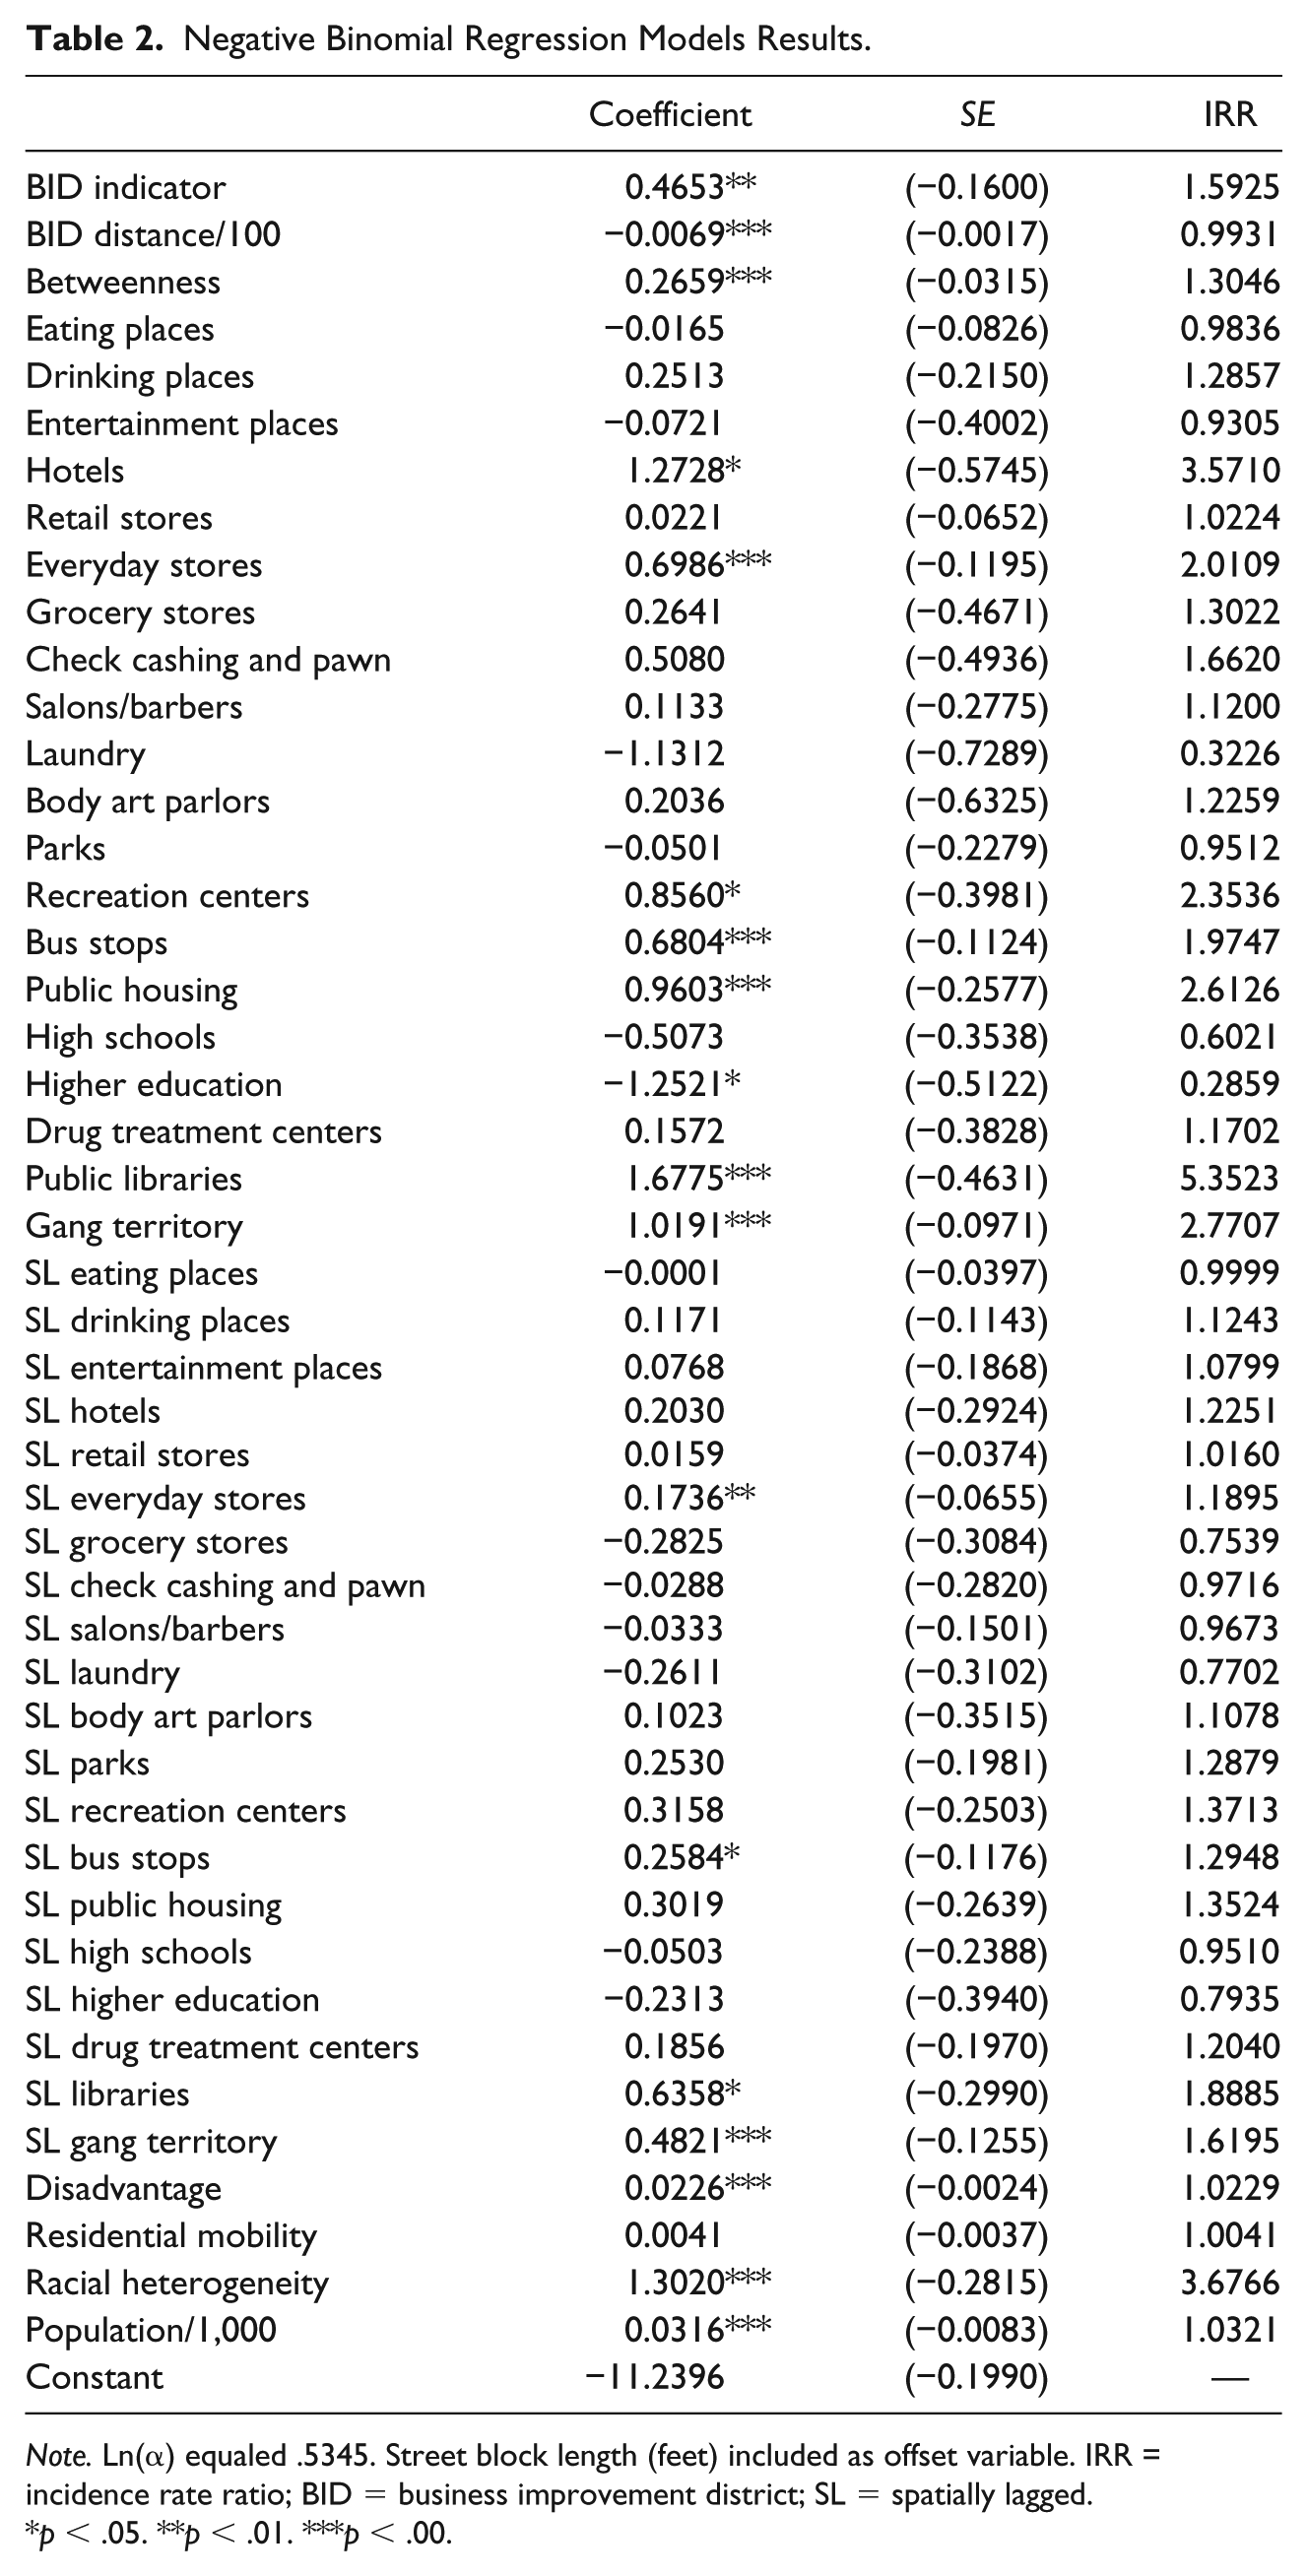
Note. Ln(α) equaled .5345. Street block length (feet) included as offset variable. IRR = incidence rate ratio; BID = business improvement district; SL = spatially lagged.
p < .05. **p < .01. ***p < .00.
Second, street blocks’ centrality to the overall network was also associated with higher robbery levels. A one standard deviation increase in street block betweenness linked to roughly 30% higher robbery rates. In other words, street blocks with greater usage potential have more robberies per foot irrespective of their proximity to BIDs, the presence of facilities on the street block or nearby street blocks, and surrounding sociodemographic composition.
Third, street block robbery levels were also associated with eight different facilities. Street block robbery levels were higher for each additional everyday store (~101%) or the presence of a hotel (~257%), recreation center (~135%), bus stop (~97%), public housing community (~161%), public libraries (~435%), or gang territory (~177%) and lower with the presence of a higher education campus (~71%). Likewise, the spatially lagged effects of everyday stores (~19%), bus stops (~29%), public libraries (~89%), and gang territory (~62%) also linked to significantly higher robberies/length rates.
Fourth, the disadvantage, racial heterogeneity, and population measures were all positively associated with street block robbery by length rates as expected by community criminology. Each additional percentage of the population living in poverty was associated with about 2% higher robbery rates regardless of specification of the spatial effects. Furthermore, street blocks with entirely racially heterogeneous populations in the surrounding area were estimated to have robberies that were about 183% higher per foot in length when compared with a racially homogeneous surrounding population. Finally, each additional 1,000 residents in the surrounding area were associated with roughly 3.2% higher robbery levels.
Discussion
This study examined the impact of BIDs on microlevel robbery patterns in Cincinnati, OH. BIDs positively and significantly predicted higher expected robbery counts net of an extensive set of control variables, suggesting that BIDs are busy places (or have the potential for busyness) that facilitate robbery opportunities. Therefore, rather than providing protective effects, BIDs appear to act more like crime generators in Cincinnati (Brantingham & Brantingham, 1995). It is important to point out that this finding should not necessarily be viewed as a critique of the Cincinnati BID program. In fact, one might interpret this finding to mean that Cincinnati BIDs have succeeded in creating busy commercial districts, which unfortunately may just inevitably lead to more street robbery opportunity (e.g., see Wilcox & Eck, 2011). It follows that BIDs should emphasize crime prevention, and crime prevention planning should potentially be a core requirement of BID creation laws.
In addition, as one moves away from busy BIDs, the potential for crime dissipates. This finding further supports the notion that BIDs create robbery opportunities by simply being busy places. In other words, as one gets farther away from a BID and the level of pedestrian traffic related to the BIDs presumably decreases and robbery opportunities also decrease. Although BIDs will have to be geographically bounded for administrative/operational purposes, this finding suggests BIDs may also need to focus crime prevention efforts in the immediate surrounding areas to help reduce robbery opportunities. The present study also demonstrated that street blocks with greater usage potential had higher robbery levels. Overall, this finding is not surprising given the study’s theoretical frame suggesting busier places provide more robbery opportunity as well as previous research linking higher street network connectivity and crime (Davies & Johnson, 2015).
As predicted by CPT, certain places in Cincinnati were linked to robbery. This supports previous research that has associated with the presence of certain facilities, including those significantly linked in the current study, to street robbery counts (e.g., Bernasco & Block, 2011; Haberman & Ratcliffe, 2015). Thus, even after controlling for BID variables and street network connectivity, some places generate or attract more (or, in the case of higher education institutions, less) criminal opportunities.
The current study has both practical and theoretical implications. First, the results suggest that BID implementation is not a panacea for crime. Although the current literature suggests that BID creation leads to crime reductions, it does not completely remove all opportunities for criminal activity. Rather, BIDs are highly trafficked areas made up of multiple activity nodes, all of which potentially produce criminal opportunities. Business owners, BID managers, municipal personnel, and law enforcement should not expect BIDs to inherently remove crime. As previous research suggests, BIDs should invest in security and prevention measures, and crime analysts should be sure to recognize the importance of potentially criminogenic places in criminal opportunity creation.
Similarly, those creating BIDs should be aware of the types of facilities they include. Although not all facility types were significantly linked to robbery in the current study, this could be a function of the study location rather than the operation/function of that facility. For instance, bars and restaurants have been shown to be linked to street robbery in a number of other cities (e.g., Bernasco & Block, 2011; Haberman & Ratcliffe, 2015). Nonetheless, the current study suggests that features of street blocks beyond the BID itself also link to robbery, so BID planners will need to think critically about how their constituent components might affect crime patterns and plan accordingly. In other words, BID planners may need subplans that address the opportunities associated with specific types of facilities within BIDs. Likewise, BID planners may need to develop crime prevention plans for the surrounding areas to be “good neighbors” as well. In practice, developing a crime prevention plan may require hiring outside experts who can assist in its effective development. Overall, the takeaway message is that crime prevention should be a major component of the planning process for opening and operating BIDs, and legislators may even require BIDs to create regular crime prevention plans.
This study is not without its limitations. In short, the study did not control for the features of individual BIDs. Data on specific amenities and actions taken by individual BIDs were not available. Typically, a small number of places within any given facility type account for the majority of crime (Eck, Clarke, & Guerette, 2007). Thus, it is possible that a small number of BIDs drove the significant influence of BIDs on robbery counts. Future studies may also want to account for place management practices among BIDs/BID businesses to see if they help explain nearby criminal opportunity (e.g., Madensen & Eck, 2008).
Next, this study did not compare BIDs to other types of commercial areas. It is possible that similarly comprised non-BID commercial areas have a different impact on robbery than BIDs do. We did not examine this comparison, as the goal of this study was to see if BIDs, net of control factors, had a significant effect on robbery patterns. If we consider locations with “entertainment activities” (eating places, bars and night clubs, entertainment sites, and hotels) or “cash/property/goods stores” (retail stores, everyday stores, grocery stores, pawn shops/check cashing stores, grooming/beauty stores, laundry places, and body art stores) to be “commercial places,” then there were 2,162 “commercial places” contained within the study data. Of these, 713 (n = 33.00%) were located directly in a BID. This suggests Cincinnati commercial places were prominent in BIDs, which were located on only 3.49% (n = 382) of Cincinnati street blocks (n = 10,940). Still, the majority of commercial places were located in areas without BID representation. That said, future studies may want to compare BID and non-BID commercial areas to better understand the relationship between commercial places and crime. It may still be true that BIDs reduce crime relative to non-BID areas and implementing BIDs provides a smart first step in redeveloping commercial areas. Finding that BID areas have different crime levels compared with other commercial locations might have important policy implications.
Finally, our study was cross-sectional, and we did not assess the potential that the impact of BIDs on crime changes throughout their life course. The consensus from the research discussed above suggests that BID implementation can be a crime-prevention measure for city planners and business owners to take, especially if money is spent on security. It is possible that the crime prevention benefit of BIDs decreases over time if BIDs become more complacent in their security practices or experience changes in dollars available for security (e.g., because shifts in funding priorities). Alternatively, the BIDs studied may have drastically reduced crime compared with when they opened, but simply not eliminated it entirely. Unfortunately, we were unable to obtain data on the age of the BIDs or their activities over time. Although the focus of this study was simply on whether or not relatively mature BIDs link to robbery patterns as currently comprised, future research should consider how the effect of BIDs on crime varies within and between BIDs over time.
Despite these limitations, the present study makes important contributions to the crime and place literature. First, the study demonstrated that BIDs linked to higher, not lower, crime in Cincinnati, thereby further supporting the notion that busy places can facilitate crime opportunities (Wilcox & Eck, 2011). Second, the study demonstrated that street blocks with higher usage potential also link to higher street robbery, thus supporting the general premise from environmental criminology that busy places create crime opportunities. Third, the study demonstrated that certain types of places provide additional opportunities for robbery, perhaps due to the respective types of victims and offenders who frequent those places. Finally, the results provide implications for how BIDs and their management might be used to reduce nearby robbery opportunities.
Footnotes
Declaration of Conflicting Interests
The author(s) declared no potential conflicts of interest with respect to the research, authorship, and/or publication of this article.
Funding
The author(s) received no financial support for the research, authorship, and/or publication of this article.
