
Abstract
Ethnic succession theory is concerned with the process and consequences of racial and ethnic migration into and out of cities. Minority threat theory is a branch of conflict theory that is concerned with the extent to which racial and ethnic minorities are perceived as threatening to the powerful. In this article, we propose a blend of these theories called successive threat theory which posits that racial and ethnic groups are perceived as threatening when they first move into a city, but as they assimilate, the perceived threat dissipates. The primary contribution of this theory is the previously undeveloped and untested notion that different minority groups may serve as threats in different time periods. Using time series analysis of annual data on Chicago from 1893 to 1965, we find support for the theory.
Introduction
Conflict theory suggests that justice in society is distributed unequally and that groups in control have interests in constraining the ability of other groups to achieve equal justice (e.g., Blalock, 1967; Turk, 1969). The hypothesis tested most often by U.S. conflict theorists is that non-Whites will receive less justice than Whites. This hypothesis is tested on two levels. At the individual level, conflict theory posits that minority status enhances the probability that people will be investigated, arrested, convicted, and imprisoned, independent of offense severity. At the aggregate level, conflict theory, in particular, minority threat theory, posits that in areas where minorities pose an increasing threat to the status quo, formal social control efforts will focus more exclusively on minorities. This contrasts with public choice theory (see Bergstrom & Goodman, 1973; Borcherding & Deacon, 1972; Deacon, 1978; Hirsch, 1970), which argues that the nature and extent of formal social control exercised in a community is a product of democratic consensus based on rational considerations. The most common hypothesis generated from public choice theory is that places (or times) with more crime have more police. Although public choice theory is an intuitively appealing explanation, Loftin and McDowall (1982) conclude that it is “too simple to account for the relationship between crime and police strength” (p. 400).
One of the biggest weaknesses of existing research on minority threat theory is that the minority group chosen as the threatening group is most often Blacks (Stults & Swagar, 2018). Although it is true that Blacks have traditionally served as the most visible minority in American cities and politics, it is also likely that other minority groups have been conceived by the majority as threatening depending upon a number of factors, including region, historical era, and political dynamics (see Jackson, 1989).
To address this issue, we combine elements of minority threat theory and ethnic succession theory in this article because ethnic succession theory focuses on the patterns by which different racial and ethnic groups migrate and assimilate into urban areas. Specifically, drawing on both theories, we develop and test a successive threat explanation for police expenditures which suggests that different minority groups replace each other as threatening groups independent of the amount of their actual criminal behavior. As a result, police expenditures will be influenced by the relative size of whatever minority group is considered threatening at the time. Below, after discussing the overlap between ethnic succession and minority threat theories, we conduct a preliminary empirical test of successive threat theory. We examine the relative size of the German, Italian, and Black populations in Chicago from 1893 to 1965 and estimate their effects on police expenditures while controlling for several other potential explanatory factors.
Minority Threat Theory
Blalock’s Theoretical Arguments
Here, we focus on Blalock’s (1967) arguments because they have served as the major theoretical foundation for minority threat studies. Specifically, Blalock maintains that as the relative size of a minority group increases, members of the majority group will perceive a threat. Blalock further contends that the source of perceived minority threat can take on two different forms: economic threat and political threat. That is, members of the majority group may feel their economic interests are threatened due to increasing competition for limited economic resources from minorities and may feel that their political dominance is threatened as minorities enhance their political power and influence. Research on the minority threat perspective has later incorporated criminal threat, suggesting that large numbers of a minority group may pose a criminal threat to members of the majority group (Bontrager, Bales, & Chiricos, 2005; Quillian & Pager, 2001; Taylor, 1998).
As a result of perceived minority threat, members of the majority group may demand intensified social control, including increased police strength, to maintain their economic, political, and social dominance. In addition, Blalock (1967) argues that the relationship between perceived minority threat and social control may be nonlinear (p. 145; see also Stults & Baumer, 2007). Specifically, he predicts that as the minority population increases, fear of competition increases, then levels off (a decelerating threat effect), whereas fear of political threat increases slower, but then increases more rapidly (an accelerating threat effect). Other minority threat research has pointed to a different form of nonlinearity. Specifically, scholars have argued that when the minority population has reached a critical threshold of political influence, the positive relationship between minority population size and levels of social control may become negative (Jackson & Carroll, 1981; Jacobs, Carmichael, & Kent, 2005).
Minority Threat Theory and Police Strength: Prior Research
In the past several decades, minority threat theory has emerged as a prominent avenue of inquiry into crime control efforts, such as police strength. 1 Research has largely operationalized “minority threat” using aggregate-level measures (e.g., size of the minority population or concentrated disadvantage) and has examined their association with police strength using cross-sectional, panel, and time series data. 2 Cross-sectional analyses typically employ the city or Standard Metropolitan Statistical Area (SMSA) as the unit of analysis and measure all constructs in a single year. 3 With the exception of Jacobs (1979) test, these studies have found a significant linear and/or nonlinear 4 relationship between percent Black and police strength (e.g., D’Alessio, Eitle, & Stolzenberg, 2005; Holmes, Smith, Freng, & Munoz, 2008; Jackson, 1985; Jackson & Carroll, 1981; Sever, 2001; Stucky, 2005; Stults & Baumer, 2007). A few of these analyses also found a linear or nonlinear effect of percent Hispanic (e.g., D’Alessio et al., 2005; Jackson, 1985; Sever, 2001).
In contrast to cross-sectional studies, panel studies rely on data measured at more than one point in time, so that effects can be compared across time periods. In addition, cross-lag analyses can disentangle reciprocal effects, and some assessment of the extent to which the outcome variable is determined by its past level is possible. There are strong theoretical reasons to believe that crime rates and police strength affect each other. 5 Although cross-sectional analyses are forced to presume one causal structure or the other, cross-lag analyses can isolate these effects to some extent. 6 Because police strength may be best predicted by its past level, panel studies have the advantage of being able to control for “organizational inertia” (Nalla, Lynch, & Leiber, 1997). In particular, using data from U.S. cities and estimating models for 1952 to 1972, at 5-year intervals, Liska, Lawrence, and Benson (1981) found that percent non-White moderately affected police size in the South, especially over time, as civil rights activism was on the rise, but percent non-White did not affect police size until 1970 outside the South. Greenberg, Kessler, and Loftin (1985) estimated panel models for all U.S. cities with a population of more than 50,000 for 1950 to 1980, decennially, finding that in the South, percent non-White had significant linear and quadratic effects on police size from 1950 to 1960 and 1960 to 1970, but no effect from 1970 to 1980; outside the South, percent non-White had a small effect from 1950 to 1960 and no effect from 1970 to 1980. McCarty, Ren, and Zhao’s (2012) study of police size in the 1990s observed a significant effect of percent Black on sworn police personnel when both police budgets and minority populations were growing.
Furthermore, Kane (2003) used a panel design to examine the association between minority population size and police deployment rate in 74 New York City police precincts in 1975, 1982, and 1992. Although percent Black had no statistically significant impact, percent Hispanic had a positive effect on police deployment rate when Hispanics constituted more than 23% of the population in the precinct. Kent and Jacobs (2005) assessed the determinants of police strength in 1980, 1990, and 2000 in U.S. cities that had populations greater than 100,000 in 1980, reporting that the association between percent Black and the per capita number of police officers became stronger in 1990 and 2000, relative to 1980, and the percentage of Hispanics increased police strength when it reached 25.4% of the population.
In sum, a number of panel studies (e.g., Greenberg et al., 1985; Liska et al., 1981) have found that the most important predictor of current police strength is lagged police strength (but see Kane, 2003). Thus, cross-sectional studies may overestimate the effect size of minority population size because they fail to control for lagged police strength. That said, even panel studies may have this problem because determining the lag pattern is complex. In addition, because few time periods are used in panel studies, the effect size of the lagged dependent variable may be unstably measured. More importantly, panel studies suffer from some of the same weaknesses as cross-sectional studies. For instance, they pool together cities in which racial threat dynamics may differ.
To address some of the weaknesses of both cross-sectional and panel studies, some scholars have used time series analyses by focusing on data over time (typically annual data) from a single geographic area and employing statistical analyses that consider the many complex ways in which variables influence their own later values as well with other variables over time. In particular, some time series models include a lagged measure of police strength along with the other independent variables in a model (see Fox, 1981; Land & Felson, 1976). For example, McDowall and Loftin (1986) included lagged police size in their model of police size in Detroit from 1928 to 1976, finding that percent non-White had a nonsignificant and negative effect on police strength. Chamlin (1990) tested the effect of percent Black on police expenditures in Chicago from 1904 to 1958, finding that percent Black and city revenues were the largest determinants of police expenditures. Similarly, Nalla et al. (1997) included lagged police size or police expenditures when examining the predictors of police strength (measured as both size and expenditures) in Phoenix from 1948 to 1988, reporting that percent minority population had a statistically significant and negative effect on both measures of strength. 7 Other time series analyses, however, do not include lagged police strength. For example, Lizotte, Mercy, and Monkkonen (1982) found that percent Black had a strong effect on police size in Chicago from 1947 to 1970. Similarly, Brandl, Chamlin, and Frank (1995) did not include lagged police size (but did include lagged police expenditures) and found that percent Black had a significant, positive effect on total police size and the size of the patrol force in Milwaukee from 1934 to 1987. Likewise, Jacobs and Helms (1997) did not include lagged police size and found no significant effect of percent non-White on the per capita number of law enforcement employees from 1952 to 1991.
Notably, although tests of minority threat theory have relied on increasingly more sophisticated statistical methods, there is still a tendency to focus on Blacks as the only threatening group. That said, as discussed above, some studies have examined the effects of Hispanic population size and found that it had significant linear or nonlinear effects on police strength (e.g., D’Alessio et al., 2005; Jackson, 1985; Sever, 2001), whereas others have found no significant association between percent Hispanic and police size (Carmichael & Kent, 2014; McCarty et al., 2012; Stults & Baumer, 2007). 8 In addition to Blacks and Hispanics, several studies have extended threatening groups to other minority groups. For example, Sever (2001) tested the effects of other minority groups (Native Americans and Asians) on police strength, reporting that although Black representation was consistently and significantly associated with police size and police expenditures, other minority representations were not. In addition, Brown and Warner (1992, 1995) found a positive association between arrest rates for drunkenness in 1900 and the size and diversity of the foreign-born population. They also found that when confronted with a high level of diversity in the foreign-born population, the police made more arrests for drunkenness.
Overall, prior studies have significantly advanced scholarship on the relationship between minority population size and police strength, suggesting that time series analyses may be the most effective method to examine this relationship as they could address some of the weaknesses of both cross-sectional and panel studies and that threatening groups may be extended from race to ethnicity and other minority groups. However, prior studies have not tested the possibility that different ethnic groups are perceived as more threatening in different time periods, which is what we focus on in this study.
Ethnic Succession Theory
Stemming from work done by the Chicago School in the first half of the 20th century, ethnic succession “is the dynamic process by which the population composition of small areas (neighborhoods) within cities changes” (White, 1984, p. 165). New groups, defined typically by their race or ethnicity, take over territories occupied by established groups, which simultaneously move into new areas (typically from within the city toward the perimeters or suburbs). One elaboration of ethnic succession ideas is Cressey’s (1938) study in Chicago. Much ecological evidence has been found to support the classical Chicago model of succession (see Aldrich, 1975 for a review).
Ethnic succession has been related to criminality in two different ways. First, building on earlier work by Park, Burgess, and McKenzie (1925), Shaw and McKay (1942/1969) argue that as racial or ethnic groups migrate into a city, invading the central city and ghettos, they are likely to be involved in higher rates of delinquency and criminality than other groups. Part of this increase in deviance can be attributed to the social disorganization that results when an urban territory is in population flux. Also, involvement in deviant activities can be part of the process of adapting to a new territory, especially, when the territory includes many opportunities for such behavior. As the racial or ethnic group becomes more entrenched in its territory, however, it may begin to develop political power and assimilate with the mainstream culture. Ultimately, it is replaced by another group and moves into more stable neighborhoods, nurturing its cultural assimilation and engaging in more conventional activities.
Second, ethnic succession has also been used as a theory of organized crime (Bell, 1953; Ianni, 1974); ethnic groups become involved in organized criminal enterprises, transition into more legitimate enterprises, and are then replaced by other ethnic groups. 9 In the late 1800s and early 1900s, organized crime in many U.S. cities involved various sequences of Irish, Jewish, Italian, Black, and Puerto Rican participation. Although the ethnic succession perspective is popular, some critics argue that the notion of ethnic groups making orderly transitions into and out of organized crime is both simplistic and unrealistic (e.g., Lupsha, 1981).
Successive Threat Theory
If the classical model of ethnic succession is valid, then regardless of whether an entering group contributes disproportionately to crime or organized crime problems, it is likely that the new group will be seen as a threat to the power elite. First, as the group migrates to an urban area, there is an increase in its relative population size, making it a more visible group. Second, since the group is likely to settle first in the inner city, often in disorganized areas, it is even more visible, and its activities therefore magnified. Because conflict theory suggests that there will always be a need for “outsiders,” as previously threatening racial or ethnic groups become culturally assimilated and politically viable, new groups will emerge to fill the void as outsiders. The most likely candidate is a group that is just beginning to occupy the inner city as it migrates into the area. Patterns of migration may vary across locations. Chicago, in the time period of our study, followed the inner city–outward pattern, but in other places, minority groups may first locate in rural areas (see, for example, Lichter, 2012). Third, the newly threatening group generates fear among the majority, thus triggering the perceived need for greater social control in the form of a larger, more repressive law enforcement apparatus. Successive threat theory could also be expanded to allow for the possibility that idiosyncratic events may enhance the extent to which a group is seen as threatening. For instance, a group whose native country is currently at war with the country in which they live might be perceived as more threatening. 10 Other idiosyncratic circumstances may also influence the degree of perceived threat.
Successive threat theory represents a logical nexus of minority threat and ethnic succession. In particular, successive threat theory extends minority threat theory and constitutes an integrative framework between minority threat theory and ethnic succession theory by arguing that the perceived threat posed by a threatening racial or ethnic group is not static and may dissipate over time as this racial or ethnic group becomes culturally assimilated and politically viable; another minority group, as its relative size increases, may emerge as a newly threatening group that elicits perceived threat among the majority and in turn perceived need for greater levels of social control. Relative size is not the only possible representation of threat; measures such as concentrated advantage may also be theoretically relevant (see, for example, Parker, Stults, & Rice, 2005). As we will discuss in the next section, the successive groups perceived as threatening in Chicago in the late-19th and first two-thirds of the 20th century were Germans (1893-1910), Blacks (1911-1920), Italians (1921-1940), and Blacks again (1941-1965).
It is important to note that as with many attempts at theoretical or conceptual integration, certain thorny issues need to be addressed when we attempt to integrate minority threat theory with ethnic succession theory. First, most tests of minority threat theory treat the city as the unit of analysis (for an exception, see Kane, 2003), yet ethnic succession is usually conceptualized as a neighborhood-level phenomenon. Social control occurs (or is engineered) at multiple levels. For instance, decisions to spend more on policing, hire new police officers, establish specialized police enforcement units, or purchase new tools for using force, all tend to be centralized decisions that occur at the city level. Yet, research has also confirmed strong variations in police style—including enforcement aggressiveness and use of force—between neighborhoods (e.g., Herbert, 1997; Klinger, 1997). Thus, successive threat can operate at multiple levels; tests of the theory need to be sensitive in selecting measures that make sense for the selected units of analysis. Second, critics point out that ethnic succession presumes a clean and orderly break from one threatening group to the next (Lupsha, 1981). Yet, in the case of organized crime, some of the transitions from one ethnic group to another have come about as result of death, rivalry, prosecution, and other messy and disorderly circumstances. Thus, ethnic succession in communities may be similarly disorderly, and the greatest level of perceived threat may come during the transitions from one threatening group to the next. Third, implicit in the notion of ethnic succession is the idea that there is one dominant threatening group at a time, yet it may be possible for dominant threatening groups to overlap in time. If this were to occur, we might expect a higher level of perceived threat, perhaps even a nonadditive interaction effect as a result of two or more dominant threatening groups existing simultaneously.
One way to test successive threat theory is to examine the formal social reaction to increases in the relative population of different minority groups during time periods when they pose a threat to the powerful. Testing successive threat theory would mean examining multiple threatening groups during the time periods in which each is perceived as most threatening. In some ways, Jackson (1989) paved the way for the elaboration of successive threat theory. She identified shifting national priorities in the middle of the 1970s as indicated by the Community Relations Service’s increasing focus on other “emerging minorities,” including American Indians, Asian Americans, and Mexican Americans (cf. Jackson, 1989, p. 66). This shift was reflected in data on municipal police resource allocation as a response to the size of Black and Hispanic populations, with the relationship between percent Hispanic and police expenditures stronger in the later time, a time when Hispanics were increasingly perceived as a threat. However, Jackson’s study is limited to two minority groups in two time periods. In this article, we present an empirical test of successive threat theory by examining the influence of the relative size of Germans, Italians, and Blacks on police expenditures in Chicago from 1893 to 1965. We argue that different minority groups, namely, Germans (1893-1910), Blacks (1911-1920), Italians (1921-1940), and Blacks again (1941-1965) served as successive threats in Chicago from 1893 to 1965, and the relative size of each of these groups would positively affect police expenditures in Chicago during their respective threatening time periods. Because data constraints limit our ability to carry out a full test of the theory, the current study is only meant as a partial test that illuminates opportunities to advance further research and threat theory.
Testing Successive Threat Theory in Chicago
Threatening Groups
Chicago is well known as an urban melting pot. Large numbers of all types of ethnic groups migrated to Chicago throughout the 19th and early 20th centuries. Chicago is also well known for its large Black population and the turbulence that has often occurred between Whites, Blacks, and other racial and ethnic groups. In short, it is an excellent site for testing successive threat theory. Due to limitations in data availability (which will be discussed below), it is necessary to single out certain groups for analysis. By the first year for which we have relevant data (1893), many ethnic groups had already become well assimilated in Chicago culture and politics and had moved out of the inner-city areas to the suburbs.
By the early 1900s in Chicago, the Irish had already become well assimilated, but the Germans were still migrating to the city and were still living in inner-city areas. In 1900, there were 170,738 Germans in Chicago, and in 1910, there were 182,289. However, immediately following the first decade, there was a major decline in the German population, and in 1920, there were only 112,288 Germans in the city. Much of the decline may have resulted from deteriorating conditions in Europe and the impending World War.
Although Germans in the United States were unpopular in the second decade (see Tischauser, 1990, for an exposition of their plight), their relative size was decreasing so dramatically during this time period that they were probably not perceived as a serious threat to the majority. In addition, Germans were assimilating at a rapid pace during the second decade, in response to the reaction to anti-German sentiment (Miller, 1987). German language classes were no longer offered in public schools (Hofmeister, 1976), English language was introduced into Lutheran Sunday schools and services, and many Germans anglicized their names. Also, all German aliens were required to register with the police. This combination of assimilation and the surveillance and monitoring of Germans during the second decade likely lessened, considerably, the threat Germans posed to the majority. Thus, the German threat occurred in the late 1800s, and possibly the first decade of the 20th century, but is likely to have dissipated by the second decade. Figure 1 shows the relative size of each potentially threatening group in Chicago during their respective threatening time periods. The source of these figures is discussed below.

Relative size of threatening groups: Chicago, 1893-1965.
During the second decade of the 1900s, Blacks may have posed a serious threat as a result of the first large wave of Blacks migrating into the city from the South, looking for jobs, better schools, and freedom and personal safety. Called the Great Migration (see Spear, 1967), the influx of Blacks into urban ghettos alarmed Whites. Tuttle (1969), for instance, points out that many Chicago Democrats at the time “were blue-collar workers who lived in neighborhoods contiguous to the black belt and who felt threatened, politically and economically, by the ‘invading’ Negroes” (p. 409). Specifically, Blacks constituted only 2% of the city’s population in 1910, but between 1910 and 1920, while the White population increased only 21%, the Black population increased by 150% (Philpott, 1978). In addition to the economic effect they posed to working-class Whites, they were also seen a political threat, given their allegiance to the Republican Party (Robinson, 1993). As one response to the Black threat, White clubs and neighborhood societies threatened and bombed Black homes in predominantly White neighborhoods, and retaliated against real estate agents selling or renting to Blacks (Grossman, 1989). By 1919, tensions were so high that a race riot broke out, during which 38 were killed (23 Blacks and 15 Whites), and countless were injured (Frazier, 1966). By 1920, however, the dispersion of Blacks across neighborhoods had dissipated dramatically, and most Blacks lived in predominately Black neighborhoods (Spear, 1967). Instead, another threatening group, the Italians, took their place between 1920 and 1940, and Chicago would not see another large influx of Blacks until the early 1940s.
The Italians in Chicago were associated with prohibition-era crime (Candeloro, 1984). Many Italians migrating into the United States during this period were from Southern Italy. They were perceived by some Americans to have come from abject, filthy slums in Italy, and forming similar settlements in the United States (Nelli, 1970). There were 59,215 Italians in Chicago in 1920, 73,960 in 1930, and 80,368 in 1940. The population of Chicago was also increasing during this time, and there was not a dramatic increase in the relative size of the Italians in the city. However, there were small fluctuations in their size, both up and down, during this period. It is difficult to detect these in Figure 1 as the scale is adjusted to allow the overlay of the Black population trend, and Blacks far outnumbered Italians in Chicago. By the 1940s, Prohibition was over, reducing the association between Italians and criminal activity, and Italians began to capture attractive positions in urban politics and community organizations. They also moved rapidly out of inner-city areas and toward the suburbs.
The Italians were quickly replaced by a massive Black migration (Kleppner, 1985; Shaw & McKay, 1942/1969). From 1940 to 1965, the Black population in Chicago almost tripled (Kleppner, 1985). Their relative size during this period also almost tripled, from 8.2% in 1940 to 14.1% in 1950 and 23.01% in 1960 (Skogan, 1976). Blacks moved into largely Black inner-city areas, replacing many of the residual ethnic groups remaining there, such as the Italians. Blacks posed a threat to the power elite as well as working-class and middle-class Whites during this period (Robinson, 1993; Squires, Bennett, and McCourt, 1987). The value of inner-city real estate was diminished due to a fiscal crisis, and powerful business interests spurred urban renewal efforts, displacing many residents. Whites were frequently relocated within the inner city, whereas a much smaller proportion of Blacks were able to stay in their neighborhoods. This created a great deal of interracial tension in those areas. Black unemployment was also rising significantly, as was Black rates of violence (Robinson, 1993). This combination of rapid Black population increase, shifting neighborhood population concentrations, and unemployment and violence likely resulted in the representation of Blacks as a major threat during this time period.
Overall, the discussion above suggests that the groups perceived as threatening in Chicago during the period covered by our time series data were Germans (1893-1910), Blacks (1911-1920 and 1941-1965), and Italians (1921-1940). Although the exact years of the threatening period for each group may be hard to determine as the most accurate population figures for each group occur during decennial census years and the threatening time periods generally follow decade demarcations, it seems logical to use decades as an appropriate boundary.
Data and Methods
Data for this article come primarily from a time series handbook assembled by Skogan (1976) on social and economic conditions in Chicago. We built on Chamlin’s (1990) analysis of these data. Chamlin examined threat theory in Chicago using percent Black as a measure of threat. He modeled police expenditures from 1904 to 1958 using this time period because of data availability restrictions, and finding a large effect of percent Black on police expenditures. Percent Black was lagged 1 year, to allow some time for an increase in the perceived Black population to affect budgetary decision making. He also incorporated the following variables in the model: lagged police expenditures, lagged nontraffic arrest rate, lagged unemployment, city expenditures, and a dummy variable for years when Mayor William Hale “Big Bill” Thompson was in charge. Thompson had strong ties to organized crime in Chicago, including notorious mobster Al Capone, and may have used his influence to weaken the police department. 11 Police and city expenditures and city revenues were measured per capita (per 100,000 population) and were adjusted for inflation using the wholesale price index (WPI) for the United States. Chamlin did not have crime data, so he used arrest rates as a proxy. He included city expenditures as they represent a capacity on potential spending. He measured percent Black with decennial U.S. census data and linearly interpolated the values during intercensal years. Unemployment, measured at the national level, serves as a proxy for general macroeconomic conditions. Unemployment is known to concentrate most heavily among inner-city minorities and the uneducated (e.g., Hoynes, Miller, & Schaller, 2012; Mouw, 2000). Therefore, we include unemployment measure as a control variable representing lower class unrest. 12
To test successive threat theory, we added measures of the relative size of the German and Italian populations to Chamlin’s model. We obtained data on the number of foreign-born Italians and Germans in Chicago from the U.S. Bureau of the Census. Rather than using linear interpolation to fill the gaps between the censuses, we used U.S. immigration data from the Immigration and Naturalization Service (INS) as reported in the Statistical History of the United States, to “smartly interpolate.” 13 Our model also differs from Chamlin’s in the following ways: (a) we use homicide data instead of arrest data, (b) the time period is longer because we were able to track down additional years of data, and (3) we test the effect of the Consumer Price Index (CPI) instead of the WPI when adjusting for inflation.14,15
We tested successive threat theory using dynamic regression models with autoregressive integrated moving average (ARIMA) 16 errors, which are useful for testing the effect of exogenous variables on an outcome within a time series analysis (Cryer & Chan, 2008; Hyndman & Athanasopoulos, 2018). This approach is a blend of conventional multivariate regression analysis and univariate time series analysis. Standard regression modeling approaches such as ordinary least squares allow for multiple predictors but often perform poorly with time series data because they cannot account for issues like serial correlation in the residuals. Ignoring these issues can result in misestimation of coefficients and their standard errors. ARIMA models do a good job of handling serial correlation and other challenges posed by time series data. We carried out all analyses in R, with most of the time series analyses conducted using the Forecast package (Hyndman et al., 2018).
The first step in building a regression model with ARIMA errors is to ensure that the outcome is stationary, otherwise the regression estimates may be incorrect (Hyndman & Athanasopoulos, 2018). A plot of the police expenditures series (shown in Figure 1) revealed clearly that it was not stationary. We confirmed this conclusion with an augmented Dickey–Fuller test and a Phillips–Perron test (Dickey & Fuller, 1979; Phillips & Perron, 1988). In both tests, the null hypothesis is that the series is not stationary. For the augmented Dickey–Fuller test, we obtained a test statistic of −0.84 (p = .954) and for the Phillips–Perron test, we obtained a test statistic of −1.04 (p = .985). In both tests, we failed to reject the null hypothesis and concluded that the series was not stationary.
To test for the degree of differencing necessary to induce stationarity, we applied first-order differencing to the police expenditure series and ran the augmented Dickey–Fuller test again. It resulted in a t value of −3.41 (p = .061). Although not statistically significant at the .05 threshold, it is very close. We also ran a Phillips–Perron test on the first-differenced outcome, resulting in a test statistic of −62.5 (p < .01). Based on these findings, as well as a more general concern with overdifferencing, we specified first-order differencing when selecting the terms of the ARIMA errors. Just to be cautious, we also allowed for the possibility of second-order differencing when estimating the regression model with ARIMA errors. The Akaike information criterion (AIC) values for both models confirmed our decision to select the first-differenced model (AIC = 1,133.7) over the second-differenced model (AIC = 1,172.4).
Next, for diagnostic purposes, we used ordinary least squares regression to estimate the full model with first-order differencing on the outcome. We examined the residuals from this model to determine whether any additional ARIMA terms were necessary. The Ljung–Box and Breusch–Godfrey Lagrange multiplier (LM) tests were both nonsignificant at multiple lags, indicating no significant serial correlation (Breusch, 1979; Godfrey, 1978; Ljung & Box, 1978). The autocorrelation function (ACF) and partial autocorrelation function (PACF) plots also revealed that there was no need to include any autoregression (AR) or moving average (MA) terms in the model. Thus, our diagnoses led us to select an ARIMA (0,1,0) error specification. This indicates a time series with no autoregressive component, a first-order trend component and no moving average component.
With the ARIMA errors specified, we then added the exogenous variables into the model to test their effects on police expenditures. Subsequent review of the autocorrelation plots as well as additional diagnostics revealed that the residuals were white noise. We tested the residuals for serial correlation using lag values ranging from 1 to 20 using a Ljung–Box test. The resulting test statistics were all nonsignificant, indicating that serial correlation was no longer problematic. We also tested for stationarity using an augmented Dickey–Fuller test. The resulting test statistic of −3.56 (p = .043) revealed that the first-order differencing specification resulted in a stationary series. The results that follow are based on an ARIMA (0,1,0) error structure and maximum likelihood estimation (see Note 15).
Results
Table 1 presents the findings from the multivariate time series analysis. Consistent with successive threat theory, we found that all of the coefficients for the racial/ethnic threat variables had a positive and statistically significant effect on police expenditures. 17 These include the German threat from 1893 to 1910 (p = .028), the first Black threat from 1911 to 1920 (p = .008), the Italian threat from 1921 to 1940 (p = .002), and the second Black threat from 1941 to 1965 (p = .002). These findings provide initial support for successive threat theory and suggest that racial and ethnic threat dynamics in Chicago may have exerted a strong effect on the city’s investments in formal social control via the police. 18
Determinants of Police Expenditures in Chicago, 1893-1965.
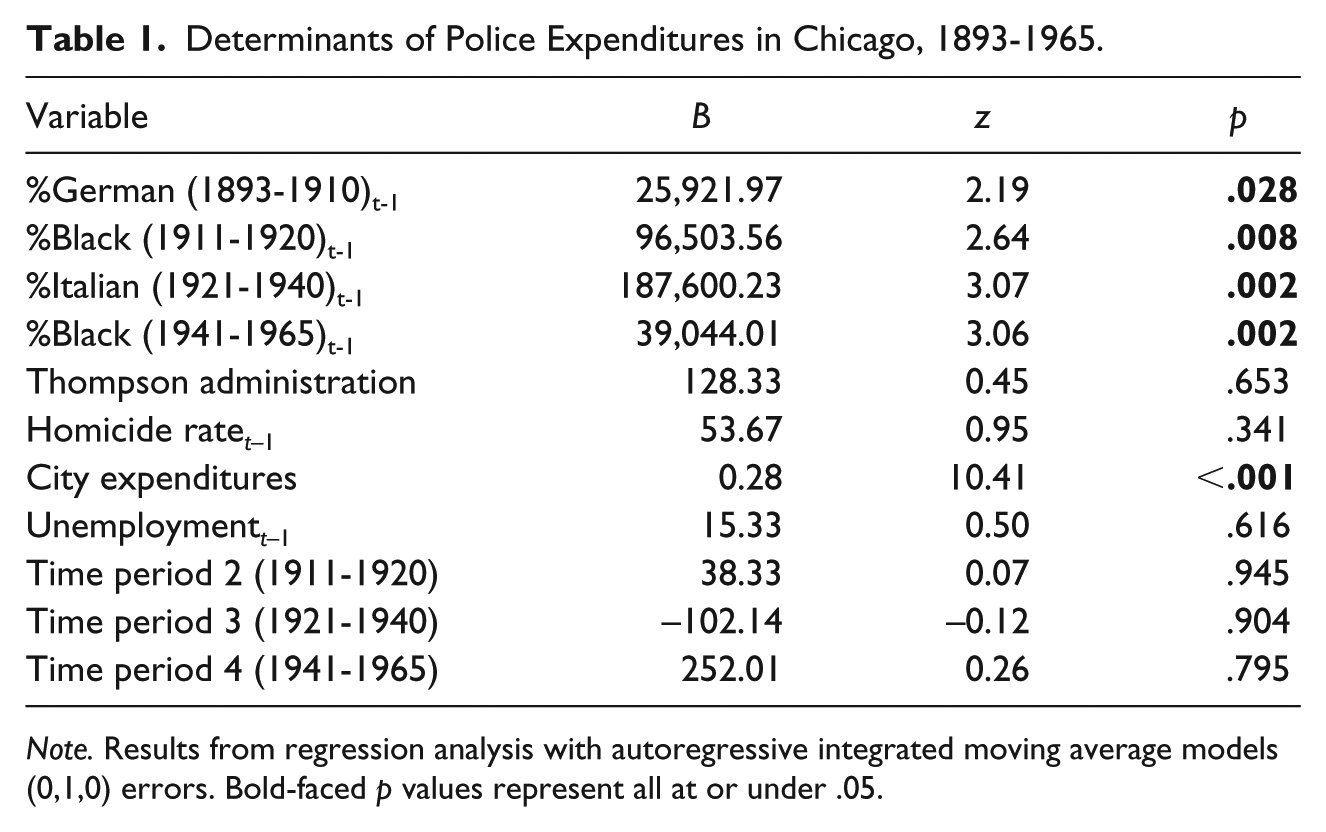
Note. Results from regression analysis with autoregressive integrated moving average models (0,1,0) errors. Bold-faced p values represent all at or under .05.
We also tested for effects of each group size on police expenditures during the periods it was not hypothesized to pose a threat. We first included all three groups during the entire time period (1893-1965). Germans and Italians dropped out, but Blacks stayed highly significant—not surprising as Blacks were seen as threatening in about half of the years. We then ran the model (both including and excluding the time period dummies) with each group during its nonthreatening periods (Blacks 1893-1910, 1921-1940; Germans 1911-1965; Italians 1893-1920, 1941-1965). No coefficient approached statistical significance for any of these models. Finally, we did the same, but including them all together simultaneously, in the model, and again, no coefficient was statistically significant.
As expected, city expenditures also had a significant positive influence on police expenditures (p < .001). This finding indicates that the City of Chicago was able to invest more heavily in policing during those years in which its General Fund expended more funds. Rational choice theory suggests that police expenditures will also rise in response to increases in crime and violence. Therefore, it is notable that the homicide rate did not have a statistically significant effect on police expenditures (p = .341). A dummy variable representing the years that William Thompson served as mayor of Chicago (1915-1922 and 1927-1930) also did not have a significant effect on police expenditures (p = .653). Consistent with Chamlin’s findings, unemployment had no effect as well (p = .616).
Discussion
In this article, we have argued that as different ethnic and racial groups begin settling in larger numbers within a city, they represent a growing threat to political decision makers and their majority constituents. The response to this threat is to increase law enforcement expenditures in an attempt to increase police strength. As each group becomes assimilated into a city’s social, economic, and political culture and begins to move outward from its first area of settlement, it becomes less of a threat. We tested successive threat theory in Chicago, looking at the influence of the relative size of Germans, Italians, and Blacks on police expenditures during several time periods in the late-19th and 20th centuries. All variables from successive threat theory were significant determinants of police expenditures. The decrease in the relative size of Germans from 1893 to 1910 was associated with decreased police expenditures. The increase in the Black population during both Great Migrations (1911-1920 and 1941-1965) resulted in greater expenditures. The percent Italians from 1921 to 1940 was positively associated with police expenditures. Furthermore, no group size during nonthreatening periods was associated with police expenditures. From the rational choice perspective, the homicide rate should influence expenditures, but our model did not find support for this. Unemployment had no effect. Finally, as we expected, city expenditures was a strong determinant of police expenditures.
Although these findings provide support for successive threat theory, this test was limited by the nature of the available data. Some of the measures may have reliability problems. For example, we used linear interpolation to estimate the relative size of the Black population between decennial censuses. Although the other ethnic population sizes were interpolated using annual immigration information, they probably contain some degree of measurement error. In addition, little is known about the length of time it takes or the causal processes through which decision makers respond to changes such as the size of a threatening population. Given that accurate statistical information is only available to decision makers at particular intervals (such as decennial censuses), they may rely more on anecdotes or impressions than hard data. It would be useful to know how well they are able to recognize such phenomena as increases in the size of a particular group and how long it takes for the recognition process to unfold. Finally, identifying the exact time periods during which each group was expected to be threatening was to some extent arbitrary. We relied on historical reasoning and patterns in the relative size of immigrant population to make these decisions as best as we could.
Other questions that remain to be addressed include which is more threatening, the size of a group, an increase in its size, or the rate of increase? In the current study, our findings supported the effects of relative size but not the increase in size. Furthermore, are all measures of governmental crime control capacity (e.g., police expenditures, police strength, uniformed patrol strength, the presence or absence of specialized enforcement units) influenced equally by the same factors (see Chamlin & Langworthy, 1996; Liska, 1992)? Moreover, what are the measurement properties of these alternative measures, and are they as interchangeable as one might conclude from reading the literature? One useful contribution to the research would be to develop composite measures that treat these various measures as indicators of an overall crime control capacity variable and explores the reliability and validity of the indicators and the overall measure. In addition, successive threat theory should also be tested using neighborhood-level data, though measuring municipal response to minority threat will become more complex as the unit of analysis decreases from cities to smaller units. One possibility would be to use data on police deployment to neighborhoods rather than police expenditures as an indicator of response to threat. Furthermore, because a group may be perceived as more of a threat as it concentrates in the city, detailed demographic data for units of analysis smaller than cities ought to be examined. The present study treats the migration patterns of racial and ethnic minorities into and out of Chicago neighborhoods as “black box” phenomena—assumed but not modeled. 19 Such detailed historical data are hard to come by. It would also be useful to control for the amount of crime engaged in by each potentially threatening group, but such data are rarely available over time.
It is important to note that this study focused on just one city, and a unique one at that. Chicago is a large city known for its rich history of immigration in the second half of the 19th century and early 20th century. Immigrants traditionally moved first to the inner city, and then migrated outward. In other cities, ethnic succession may follow different patterns (e.g., from rural areas inward). In addition, this study focused on a time period ending in the 1960s. It is not possible for us to extrapolate any findings to decades beyond this period. We also included threats from two different categories of minorities: foreign immigrants (Germans and Italians) and native racial minorities (Blacks). The processes and patterns of assimilation and modes of threat are likely different, given their different histories of relationships with the dominant White majority in Chicago and the United States, and further work should address the ways in which different groups assimilate over time. We also looked only at the relative size of minority populations as a source of threat, when other operationalized measures may be valuable to incorporate as well, such as concentrated disadvantage (see, for example, Parker, Stults, & Rice, 2005). Last, research of this nature assumes that the majority is able to perceive changes in measures such as size, to react to those changes, so much further research is necessary to explore the dynamics processes of these perceptions.
The purpose of this article has been to introduce successive threat theory as a blend of ethnic succession and minority threat theories. Our partial and preliminary test found support for successive threat theory, analyzing determinants of police expenditures in Chicago from 1893 to 1965. We encourage researchers and theorists to continue examining the nexus of minority threat and racial and ethnic succession in shaping the nature and size of the crime control apparatus. In the United States, the current sea change in immigration and the political and social response to it provide a new context in which to examine these notions. Researchers should test this theory not only in the United States but also in other nations—both developing and developed—where migration patterns and minority threat dynamics may operate differently. 20 There is also substantial room for improvement in both data and methods. As always, researchers should continue to refine models accounting for the factors that influence political decision makers, from the conflict and rational public choice perspectives, as well as other alternative approaches.
Footnotes
Declaration of Conflicting Interests
The author(s) declared no potential conflicts of interest with respect to the research, authorship, and/or publication of this article.
Funding
The author(s) received no financial support for the research, authorship, and/or publication of this article.