
Abstract
Rising crime in Central America and on-going emigration have reinvigorated concerns about the relationship between criminal victimization and international migration. Analyzing data from a crime prevention intervention in this region, we examine measures related to criminal victimization to assess corresponding changes in the propensity for international migration. We find that individuals who reported a crime victimization were more likely to express their intention to migrate, but this pattern was less consistent for those who perceived their neighborhood to be unsafe. These descriptive patterns are important on their own, but this paper also advances our methodological understanding of how to address the problem of item nonresponse using a partial identification framework.
Keywords
Introduction
Two trends have emerged in Central America which point to the possible relationship between criminal victimization and international migration. First, rising crime rates, drug trafficking and persistent poverty have reinvigorated concern about security, particularly in El Salvador, Guatemala and Honduras. These three countries have among the highest violent crime rates in the world. Data from the early 2000s suggests that the rates of victimization in this region were comparable to other parts of Latin America, but they have since risen sharply. From 2000 to 2014, the homicide rate increased by 25.8% in Guatemala, 46.5% in Honduras, and 59.3% in El Salvador (UNODC, 2015). Coinciding with escalating crime in the region is the second trend: growth in the number of immigrants from El Salvador, Guatemala, and Honduras to the United States (U.S.). From 2000 to 2015, for example, the number of Salvadoran immigrants in the U.S. increased by 137%, from 539,000 to nearly 1.28 million (Noe-Bustamente et al., 2019). There was similar growth in Guatemalan immigrants during this time period. Among these three Central American countries, Honduras had the greatest percentage increase: over 352,000 immigrants arrived during these 15 years, an increase of nearly 200% (2019).
This paper aims to provide additional empirical support for the relationship between criminal victimization and out-migration from Central America. Legal scholars have argued that Central Americans fleeing violence have international protection needs (Serna, 2016), and extensive research has documented violence and in Central America and out-migration trends from this region (Arana, 2005; Farah, 2012; Jütersonke et al., 2009; Pérez, 2013; Seelke, 2016), yet few studies have used large data sets to examine this relationship (although see Silva & Massey, 2015). Among those that have, most tend to use rather narrow definitions of victimization (e.g., homicide rates) (Alvarado & Massey, 2010; Basu & Pearlman, 2016) or to look broadly across Latin America in general (Wood et al., 2010) rather than El Salvador, Guatemala and Honduras in particular.
Addressing this gap is timely and relevant to U.S. policy. Despite evidence that these three countries are some of the most violent in the world, current anti-immigrant rhetoric in the U.S. calls into question the validity of asylum claims made by Central American migrants at the border (Coutin, 2011). According to national and international law, asylum claims are assessed based on the merits of each individual case (Rottman et al., 2009). However, general antipathy toward migrants has fueled speculation about the veracity of their claims. In addition, changes in how such claims are vetted have made it more difficult for individuals who are fleeing their country out of fear of persecution to receive the protection that is their right under law (Chishti & Bolter, 2020). According to the United States Citizenship and Immigration Service, more individuals sought asylum from these three countries from 2013 to 2015 than in the previous 15 years combined (Mossaad, 2016), yet their denial rates (75–80%) are among the highest of any nationality (TRAC, 2017). While the descriptive findings from this paper regarding the relationship between violence and migration will not likely shape the outcomes for individual Central American asylum-seekers in the U.S. immigration system, it is important to provide policymakers with additional evidence that victimization and the tendency to out-migrate are linked.
We examine measures of victimization (whether one has been the victim of a crime) and perceived safety (whether one feels at risk of becoming the victim of a crime) to assess whether changes in these variables correspond to changes in the intent to migrate. Our study draws on an impact evaluation of a large-scale crime prevention intervention called the Central American Regional Security Initiative (CARSI) based on 19,464 household surveys in 14 municipalities across El Salvador, Guatemala, and Honduras over three time points (from 2010 to 2014). 1 In addition to our descriptive findings on victimization and the intent to migrate—important on their own—this paper also advances the use of partial identification analysis (Manski, 2003), an approach that provides a parameter of interest rather than a point estimate. Our attention to the relatively small number of missing cases in our data indicates that they can significantly disrupt our ability to make binary inferences (i.e., either a parameter is point identified or it is not). Our framework for addressing this concern has implications for other studies where the problem of missing data is minimized rather than interrogated, and provides greater strength for the conclusions we can draw about the relationship between (perceived) safety and the intent to migrate.
Literature Review
Theories of international migration suggest that criminal victimization may be a “push” factor, part of a complex set of conditions which explain the decision to emigrate (Castles & Miller, 2009; Massey et al., 1993). From the perspective of neo-classical economic theory, for example, a prospective migrant who fears for her safety will make a rational choice to leave if she decides the future benefit of migration is greater than the risk of staying. In this view, “pull” factors include the promise of economic opportunities in the destination country, while push factors—such as violence or fear of violence—are conditions in the sending country which may inhibit economic advancement. By contrast, theories from the sociology of immigration account for a more diverse set of factors driving—and sustaining—migrations, countering the neo-classical perspective by arguing that migration is often a household-level decision which is best understood within the larger historical and geopolitical context (Massey et al., 1993; Sassen, 1996). For example, transnational social ties between prospective migrants and individuals who have already made the trip are valuable conduits for information and resources that make future migrations more possible (Boyd, 1989; Fussell, 2010; Massey et al., 2002). Others have summarized the divergent theories of international migration and migratory processes (Brettell & Hollifield, 2000; Castles & Miller, 2009; Massey et al., 1993, 1994), and we do not propose to do so here. However, without dismissing or challenging important differences between these theoretical frameworks, we focus on a concern that they have in common: factors in the sending country influence the decision to emigrate.
Although scholars continue to debate the social and economic conditions that facilitate international migration, the focus has generally been on state violence (Bohra-Mishra & Massey, 2011; Davenport et al., 2003)—such as during the transition of state regimes (Hiskey et al., 2014; Sanchez, 2006) or civil unrest (Donato & Massey, 2016)—rather than criminal violence as a push factor (Silva & Massey, 2015). Indeed, political oppression, military persecution, and other forms of state violence are often connected to forced migration, displaced people, and the growing number of refugees around the world, including in Latin America. Engel and Ibáñez (2007) found that Colombian households which have experienced some form of violence were much more likely to migrate, and awareness of violent acts in the community—what the authors call perceptions of insecurity—is also predictive of domestic migration. Similarly, in his study of political violence during Guatemala’s civil war, Morrison (1993) found that violence shapes migration trends, and that this effect grows as the level of violence increases. Shellman and Stewart (2007) found similar outcomes in Haiti, even when controlling for economic conditions.
More recently in Central America, gang-related violence and drug trafficking have largely replaced state violence as a primary concern (Arana, 2005; Farah, 2012; Pérez, 2013; Seelke, 2016). This “new violence” in Central America links structural violence, insecurity, and social struggle, and is expressed as “violent pluralities” of state and nonstate actors “through organized crime, corruption, gang violence, lynching, and paramilitarism” (Vogt, 2013, p. 768). Zilberg (2011) argues—and others agree (Arana, 2005; Farah, 2012; Jütersonke et al., 2009; Pérez, 2013; Seelke, 2016)—that this new form of violence in Central America reflects the transnational circulation of migrants and deported gang members, part of a long legacy of U.S. interventions in the region. Regardless of its form or source, the destabilizing impact of contemporary violence in Central America is far-reaching and indisputable. As we will discuss below, however, the best approach to measuring its impact in the form of criminal victimization and perceived safety is somewhat contested.
Measuring Criminal Victimization and Safety in Central America
Within the existing literature linking criminal victimization and perceived safety to migration there is inconsistency in how victimization is measured. Some studies in this field use homicide rates as a proxy to measure criminal victimization in Central America (Alvarado & Massey, 2010; Basu & Pearlman, 2016). Homicides may be more reliable than other crime data due to reporting issues, but relying on homicide rates alone does not account for other crimes that may impact one’s decision to emigrate. To address this concern, Wood et al. (2010) conceptualize victimization more broadly to include assault, burglary, and a range of other crimes. They argue that expanding the definition of victimization provides “a better measure of the more ordinary types of crime that threaten most people in their daily lives” (Wood et al., 2010, p. 4). That is, migration studies which rely on national homicide averages do not capture how crime and safety are more often associated with one’s personal experience and locality. This can generate uneven results. In their pooled sample (combining four Latin American countries), for example, Alvarado and Massey (2010) found that homicide has a significantly negative relationship to out-migration such that an increase in the murder rate is correlated with a decrease in international migration. However, when looking at the four countries separately they found that the effects of deadly violence varied across countries (2010). In Mexico and Costa Rica, there was a significantly negative relationship between violence and out-migration; in Nicaragua, the relationship was significantly positive; while in Guatemala the homicide rate was not a significant predictor of out-migration.
Perceptions of safety may also influence the decision to migrate. Living in a municipality with rising crime rates may push one to leave, even if one has not been a crime victim. The literature on neighborhood crime and housing mobility—domestic rather than international migration—provides some evidence to support this (Dugan, 1999). Xie and McDowall (2008) find that individuals who are the victims of neighborhood crime are more likely to move, but indirect property victimization (crimes experienced by close neighbors) also leads to moving, and with roughly equal effect sizes. By contrast, violent victimization in neighboring homes does not appear to affect mobility. The victim-offender relationship of these crimes tends to involve non-strangers—individuals known by local residents—and fear is primarily driven by violence perpetrated by strangers (2008). Similarly, McNeeley and Stutzenberger (2013) find that violent victimization is not related to the desire to move. In their study, however, property victimization (mediated by increased perception of danger) does affect the degree to which individuals considered moving. Therefore, the perceived risk of being a future victim of crime may be great enough on its own to contribute to international migration, but this has not been empirically tested to our knowledge.
Our goal is to advance the scholarship in this field by exploring the relationship between these variables in El Salvador, Guatemala, and Honduras. Like Wood et al. (2010), we use a broader measure of criminal victimization that includes perceived safety to better capture the empirical nature of this relationship. Based on our review of the relevant literature we make the following two predictions: (1) individuals who experience criminal victimization will be more likely to express their intention to emigrate; and (2) even if they have not been the victim of a crime, individuals will be more likely to have migration intentions if they perceive that it is unsafe to stay.
Data and Methods
The data for our study came from a large-scale evaluation of the Central American Regional Security Initiative (CARSI), a United States Government-funded security assistance intervention in Central America. CARSI is a multi-pronged initiative. From 2008 to 2014 Congress appropriated just over $800 million for CARSI to accomplish two goals: to improve security in the region through enhanced law enforcement and to support community development efforts to reduce community violence. The United States Agency for International Development (USAID) manages activities addressing the second goal. These interventions consist of a range of prevention programs “designed to address these issues by providing educational, recreational, and vocational opportunities for at-risk youth” (Meyer & Seelke, 2015, p. 21). Within the CARSI dataset, we focus on the three countries with the strongest pattern of out-migration to the U.S.: El Salvador, Guatemala, and Honduras.
Vanderbilt University’s Latin American Public Opinion Project (LAPOP) conducted an impact evaluation of CARSI from 2010 to 2014. LAPOP used a cluster randomized experiment to measure the impact of CARSI’s prevention programs. The evaluation’s design involved a stratified sample of similar high-violent neighborhoods within each of the countries receiving the intervention. The researchers then randomly selected neighborhoods in each country (apart from Honduras) for treatment or control, with the “treatment” being the array of CARSI-funded programs administered by USAID intended to reduce crime and violence (Berk-Seligson et al., 2014c). Pre- and post-treatment surveys were conducted with community members in sample neighborhoods from 2010 to 2014, totaling over 19,464 interviews across the three countries.
Municipality, Neighborhood, and Individual Selection Criteria
Within each country, municipalities were selected by the affiliated USAID country offices (e.g., USAID/El Salvador) if they were determined to be high-crime, at-risk areas (Berk-Seligson et al., 2014c). Following the selection of municipalities, LAPOP identified neighborhoods that were “at-risk,” but not completely under the control of gangs. Gang-controlled neighborhoods were identified as “hot spots” and excluded due to concerns for the safety of interviewers (Berk-Seligson et al., 2014c). Hot spots were identified based on consultations with groups such as municipal anti-violence committees and the implementing partners. Police reports were not used due to probable under-reporting and lower levels of police presence in higher-risk communities (Berk-Seligson et al., 2014c). Neighborhoods were selected based on a series of conditions that are associated with elevated crime and violence: population size and density; socio-economic vulnerability; poverty; the quality of neighborhood infrastructure; and the proportion of youth in the population due to the assumption that young people are the most likely to be recruited into gangs. (Berk-Seligson et al., 2014c).
Prior to conducting interviews, the researchers collected household-level data within each neighborhood. These data were then used to generate a sampling frame for the surveys (Berk-Seligson et al., 2014a). Individual street blocks were randomly selected from the sampling frame of street blocks within each city. Conditional on a street block being selected, interviewers approached individual residences on that block in a systematic manner until a quota of interviews was obtained. We asked whether the number of residences approached was maintained and were told that it was not. Given this procedure, it is not possible to calculate or report response rates for the surveys. 2
The street block interviewing method described above induces a certain degree of clustering into the survey responses since it is expected that people who lived in the same neighborhood or street block would not exhibit the same variability in their answers that would be expected if each household was independently sampled (Berk-Seligson et al., 2014c, p. 30). This could also be true when the same interviewer is conducting surveys in multiple households within the same area. We attempted to obtain reasonable estimates of survey design effects to account for this clustering but were told that such estimates and ranges were not available. 3 It is likely that standard errors and confidence intervals based on simple random sampling assumptions are too small (Lohr, 2014). Research examining variability in design effects for economic variables in several developing countries revealed variance-based design effects mostly in the 0 to 9 range; this implies standard error-based design effects in the 0 to 3 range (Pettersson & Silva, 2005). As a way of checking on the sensitivity of our results to different assumptions about the effects of clustering on sampling variability, we consider standard errors and confidence intervals based on simple random sampling and adjusted for the upper bound of these design effect ranges.
One voting-age adult per household was interviewed for the actual survey. These face-to-face interviews were conducted in participants’ households. While the same households or individuals could have been interviewed during the second and/or third rounds, LAPOP did not implement a panel design due to concerns of attrition, respondent conditioning, and contamination (Berk-Seligson et al., 2014c). Also, as an added measure of protection for respondents, LAPOP aggregated neighborhood data to the municipal level before making the dataset available for public use.
Sample and measures
The CARSI dataset is a repeated cross-sectional survey. The data used for this paper is comprised of 19,464 individual respondents distributed across the three countries of El Salvador (four cities at three different time points), Guatemala (three cities at three different time points), and Honduras (four cities at two different time points).
Intent to migrate
Rather than measuring whether individuals actually emigrate, our study measures whether an individual is contemplating migration. Our measure is based on the survey question “Do you have any intention of going to live or work in another country in the next 3 years?” Other studies have relied on similar questions to measure prospective migration (Hiskey et al., 2014; Wood et al., 2010). Considering the entire sample, we find that 16,583 respondents (85.2% of 19,464) had no intentions to emigrate while 2,669 respondents (13.7% of 19,464) reported that they intended to move to another county. A small percentage of respondents (N = 212; 1.1% of the sample) did not answer this question.
Victimization
As developed above, although homicide rates in several Central American countries are higher than many other parts of the world, these numbers may not capture other aspects of crime which affect individuals, whether directly or indirectly. Therefore, we measure criminal victimization more broadly than homicide rates alone. Our victimization measure is based on two questions from the survey. The first question measures personal victimization: “Have you been the victim of any type of crime in the past 12 months? That is, have you been the victim of robbery, burglary, assault, fraud, blackmail, extortion, violent threats or any other type of crime in the past 12 months?” The second assesses victimization experienced by other members of the respondent’s household: “Has any other person living in your household been the victim of any type of crime in the past 12 months? That is, has any other person living in your household been the victim of robbery, burglary, assault, fraud, blackmail, extortion, violent threats or any other type of crime in the past 12 months?” If a respondent answered yes to either question, then that respondent was considered to have experienced victimization. The majority of the respondents reported no crime victimization experience within the preceding 12 months (N = 14,938; 76.7% of the total sample of 19,464) while about a fifth of the sample did report a victimization experience (N = 4,266; 21.9% of the sample). A small number of respondents provided insufficient information to classify the household as having been victimized or not (N = 260; 1.3% of the entire sample of 19,464).
Perceived safety
It is quite possible that those who have not been personally impacted by crime may decide to emigrate because they perceive that their neighborhood is no longer a safe enough environment for them and their families. To assess this perception, we included a measure from the survey question, “In your opinion, is this community very safe, somewhat safe, somewhat unsafe, or very unsafe?” We constructed a binary variable based on these responses where “safe” (0) combines the “very safe” and “somewhat safe” responses (N = 14,064; 72.3%); and “unsafe” (1) combines the “somewhat unsafe” and “very unsafe” responses (N = 5,317; 27.3%). We also considered the possibility that people who answer “very unsafe” may be more motivated to move. Based on this idea, we created another binary variable that is coded (1) when the respondent answers “very unsafe” (N = 1,094; 5.6%); and (0) for all other responses (N = 18,287; 94.0%). For both of these variables, there were 83 missing responses (0.4% of the entire sample of 19,464).
Analysis Methods
It is useful to emphasize that our study is not designed to produce a causal model of emigration. Instead, we attempt to understand what the CARSI data are capable of telling us about the basic patterns of: (1) crime victimization and emigration intentions; and (2) perceived community safety and emigration intentions. Understanding these patterns can provide us with a strong foundation for future studies that are more causally rigorous, but our emphasis in this paper is purely descriptive.
As it turns out, there are some significant challenges for developing valid inferences about the basic descriptive quantities mentioned above. The first challenge pertains to our inability to calculate a response rate. We simply do not know how many people were approached to participate in the survey and declined to do so or were not available. Second, we have relatively small fractions of the sample experiencing crime victimization or reporting perceptions of being unsafe. In other words, the distributions of both key variables are quite skewed. This leads to small sample sizes for many of the relevant parameter estimates at the city and time period level. As a result, we will study the entire sample combined along with each of the three nations individually with data combined across the time periods. A third concern pertains to the missing information among those who did participate in the survey. Although the fractions of incomplete or missing observations for our key measures are relatively small, this does not necessarily translate into a small amount of uncertainty in the conclusions we draw. Our study brings this uncertainty to center stage.
As suggested by the structure of our variables, the analysis is mainly organized into 2 × 2 contingency tables (i.e., two rows and two columns). In each 2 × 2 contingency table, the focus is on estimating two conditional probabilities. Let y be the outcome variable (emigration intentions) and let x be either crime victimization or perceptions about unsafe community conditions. For each table, then, we estimate a parameter called Δ which is calculated by:

In words, this represents the proportion of people who intend to migrate among those who have been victimized, p(y = 1|x = 1), the proportion of people who intend to migrate among those who have not been victimized p(y = 1|x = 0), and the difference between the two proportions, Δ. We can create an equivalent set of expressions where emigration intentions are conditioned on perceptions about unsafe community conditions. In either case, it is possible to discard the observations in each table with missing information on either or both variables and calculate an estimate of Δ based only on the valid observations. This is equivalent to assuming the data are missing at random. The missing at random assumption might or might not be true but there is no way to test it (Little & Rubin, 1987).
A prominent feature of the CARSI data is the distinction between unit and item nonresponse. The unit nonresponse problem is the unknown number of persons who were targeted to participate in the survey but did not do so. The item nonresponse problem derives from the persons who participated in the survey but did not answer a particular survey question that is included in our study. The design and limitations of the dataset force us to accept the missing at random assumption for unit nonresponse, but we are still left with the question of how to confront the problem of item nonresponse (see Manski, 2003, p. 19 for a similar analysis problem). Our approach to this second problem is to conduct a partial identification analysis (as opposed to a point identification analysis) which allows us to measure the set of values that Δ could take on depending on the missing data patterns with which we are presented. So, our study will report estimates of Δ that assume item nonresponse is missing at random but we go beyond those estimates to also calculate upper and lower bounds of Δ conditional on the missing data patterns in each of our 2 × 2 contingency tables. Our bounds explicitly attend to the uncertainty created by the relatively small amounts of item nonresponse in the CARSI data. The partial identification framework we use was first developed by Cochran (1953, pp. 292–296) and first applied to crime victimization research by Saphire (1984, pp. 24–27). Robins (1989) and Manski (1989, 1995, 2003)—and extended by Horowitz and Manski (2000, 2003)—established the modern literature and statistical practice of partial identification which continues to evolve.
Analysis #1—Crime Victimization and Emigration
Based on our reading of the literature, we generally hypothesize that people who have been crime victims will be more likely to express emigration intentions. Table 1 presents a contingency table showing the joint distribution of crime victimization and intentions to emigrate for the entire sample of N = 19,464. If we ignore the missing observations, then the estimator for Δ is:

which indicates that respondents who report a victimization were about 10.5 percentage points more likely to express emigration intentions than people who did not report a victimization. We can calculate an approximate 95% confidence interval around this estimate using the normal approximation to the binomial which yields bounds of [0.093, 0.117] (assuming simple random sampling [SRS]) and [0.070, 0.141] (design effect (DEFT) adjusted). These bounds reflect uncertainty due to sampling error while making the assumption that the missing cases are missing at random.
Crime Victimization and Emigration Intentions.

We now turn to the issue of partial identification where we consider how Δ could vary depending on where the missing cases would be located in the 2 × 2 table if those cases had been observed. In other words, we ask how small or large could Δ possibly be given the missing data pattern we have. As Horowitz and Manski (2003, p. 23) observe, “the analysis is subtle because a missing covariate realization cannot be in A and B simultaneously” (where A and B refer to different categories of the independent variable). Horowitz and Manski (2000, p. 79, 2003, pp. 22–24) provide a linear programming algorithm for identifying the upper and lower bounds on Δ due to the general pattern of missing data (i.e., data missing on the independent variable, the dependent variable, or both). We developed an R script to implement the Horowitz-Manski algorithm and verified each of the results with a case shuffling algorithm that we wrote (see Appendix). A key feature of both algorithms is the treatment of cases who are missing on both the independent and outcome variables. These algorithms both allow for a gradual shifting of cases between the cells where Δ can be pushed toward extreme values since each of those cases can only be in one cell at a time. Using the Horowitz-Manski and case-shuffling algorithms, we obtain the following bounds on Δ: [0.082, 0.128]. Thus, the data in Table 1 are equally consistent with any Δ in this range. It is noteworthy that this range is larger than the SRS 95% confidence interval and smaller than the DEFT 95% confidence interval around the MAR point estimate of 0.105 described above.
Thus far, the bounds on Δ attend to uncertainty created by the missing data. We now turn to the issue of statistical inference and the construction of confidence limits around the bounds of Δ that attend to sampling error. For this exercise, it is important to note that the sample estimates of the lower and upper bounds correspond to population parameter values. Horowitz and Manski (2000, p. 80) proposed a bootstrap-based method of obtaining 95% confidence intervals for both the lower and upper bounds. We were able to implement the bootstrap-based method for the data in Table 1 and found that the results were virtually identical to what we obtained by calculating normal-approximation-to-the-binomial confidence limits on each bound with a 2.24 multiplier. This multiplier leads to a Bonferroni asymptotic joint confidence region (with ≥95% confidence) as discussed by Manski (2003, p. 20). This is a useful equality because in most of the later analyses, the data in some of the contingency table cells are too sparse to support the use of the bootstrap. Throughout the remainder of the paper, therefore, we will report the non-bootstrap confidence regions for the bounds. The lower and upper limits of the SRS confidence region for the data in Table 1 are [0.068, 0.141] while the DEFT-adjusted confidence interval is [0.041, 0.168].
It is striking to see intervals this wide when only 2.2% of the data in Table 1 are missing. Yet, even with these intervals, we now know that people who report a crime victimization are more likely to indicate emigration intentions than people who did not report a crime victimization—item nonresponse notwithstanding. While we cannot be certain about the pattern that would have emerged if we could calculate response rates for the survey, we can be certain that the item nonresponse within the CARSI sample cannot explain the result.
Our next step is to conduct parallel analyses for each of the three countries (El Salvador, Guatemala, and Honduras) that contribute data to Table 1. In each case, we calculate an estimate of Δ and its 95% confidence limits assuming the item nonresponse is random. We then calculate the partial identification bounds and their 95% confidence limits. The results of this analysis are presented in Table 2 and are largely aligned with the results from the combined sample discussed above. In each country, respondents who reported a crime victimization were more likely to express moving intentions than respondents who reported no crime victimization. In each case, the bounds due to missing data significantly expand the region of uncertainty in these estimates but all of the parameter estimates are strictly positive; only the lower limits of the DEFT adjusted confidence intervals fall slightly below zero. It is also worth noting that El Salvador experiences the greatest expansion of uncertainty; intuitively, this is because El Salvador has the largest fraction of cases with missing information.
Estimates of Δ for El Salvador, Guatemala, and Honduras.

Analysis #2—Perceptions of Community Safety and Emigration
We now turn to a comparison of emigration intentions among respondents with varying views of their communities’ safety. Based on the extant literature, we hypothesize that persons who view their current communities as unsafe will be more likely to express emigration intentions for the future. As noted above, we will consider this issue with two different coding approaches for safety perceptions: (1) the first group is comprised of people who view their communities as very safe or somewhat safe while the second group includes people who view their communities as somewhat unsafe or very unsafe; and (2) the first group includes people who view their communities as very safe, somewhat safe, and somewhat unsafe while the second group includes only people who view their communities as very unsafe. Table 3 provides a contingency table based on each coding approach for the entire sample of N = 19,464.
Perception of Community Safety and Emigration Intentions.
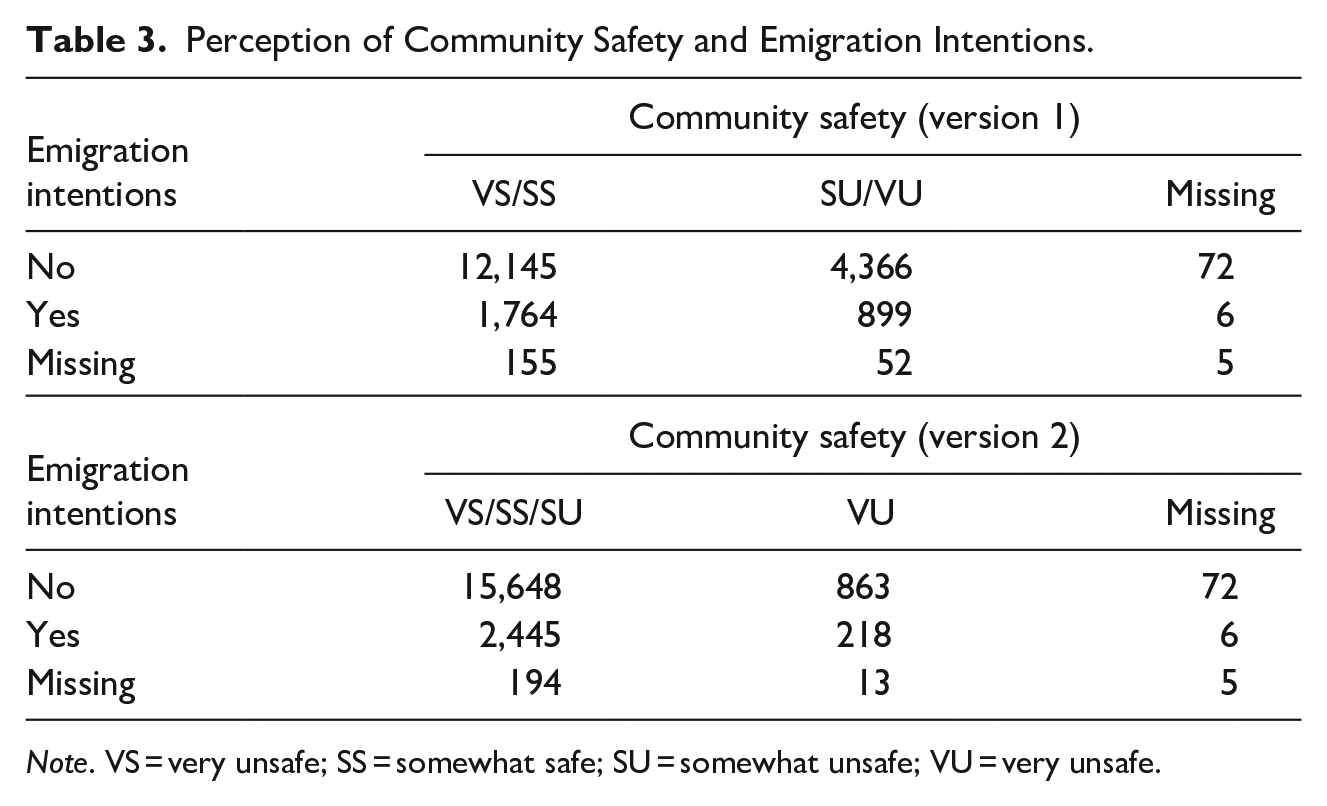
Note. VS = very unsafe; SS = somewhat safe; SU = somewhat unsafe; VU = very unsafe.
Considering both coding strategies for the measure of perceived community safety, the results in Table 3 suggest that people who view their communities as unsafe are more likely to express emigration intentions than people who view their communities as safe. In this section, we let Δ1 refer to the first coding strategy while Δ2 refers to the second coding strategy. For the missing-at-random analyses, our in-sample estimate of Δ2 (+0.067) is about 1.5 times greater than the estimate of Δ1 (+0.044). This suggests that the people at the extreme end of those who perceive their communities as unsafe are more motivated to move.
Judging the statistical significance of this result is not a trivial matter. The problem is that the two Δ values are not independent of each other, and we do not know their covariance. A solution to this problem when all cases are observed is to use the bootstrap (Wasserman 2004, pp. 107–118). For this implementation of the bootstrap, we draw repeated (B* = 10,000) random samples with replacement from the set of cases with valid measurements on both variables. Then, for each random sample, we use the outcome variable (emigration intentions) and both versions of community safety perceptions to calculate Δ1 and Δ2 as well as the difference between Δ1 and Δ2. As a final step, we calculate the 2.5th and 97.5th percentiles of the bootstrap distribution of differences between Δ1 and Δ2. This analysis suggests that a significance test for the difference between Δ1 and Δ2 is in a borderline situation (SRS 95% confidence interval = [−0.045, −0.001] while the DEFT adjusted 95% confidence interval crosses zero). A problem with this comparison is that it ignores the missing cases. Even though only 1.5% of the cases have missing data, the partial identification bounds overlap for Δ1 and Δ2, regardless of sampling error.
Table 4 presents a summary of the results for all of the community safety comparisons. All of the parameter estimates of Δ1 and Δ2 for the entire sample are strictly positive suggesting that people who view their communities as unsafe are more likely to express migration intentions. This result holds for both Guatemala and Honduras. Although the 95% confidence intervals do include zero for all analyses, the in-sample point and interval estimates are strictly positive. For El Salvador, the interval estimates for both Δ1 and Δ2 include zero. In other words, the missing data preclude identifying the sign of the difference in migration intentions conditional on safety perceptions.
Estimates of Community Safety Δ for All Cases, El Salvador, Guatemala, and Honduras.

Discussion
In this study we analyzed data from the Central American Regional Security Initiative to assess the relationship between criminal victimization and international migration. In our analysis, we measured some basic quantities pertaining to crime victimization, perceptions of community safety, and emigration motivations in El Salvador, Guatemala, and Honduras. Our in-sample estimates consistently showed that respondents who reported a crime victimization were more likely than those who did not to express emigration intentions. Not as consistently, our study also revealed a tendency for persons who believe their communities are unsafe to migrate. For example, we observed an inequality between our two difference estimates based on perceptions of community safety (Δ2 (=0.067) > Δ1 (=0.044)—a 1.5× difference—where Δ2 was based on a more extreme coding strategy for community safety)—ignoring missing data. Yet, when we conducted a partial identification analysis with what most scientists would consider to be a very small percentage of missing cases, we found a large degree of overlap between the identification regions of Δ1 and Δ2; in other words, the evidence for an inequality between Δ2 and Δ1 was much weaker. Our analysis was constrained by our inability to measure response rates based on persons who were targeted for inclusion in the survey but did not participate (unit nonresponse); on the other hand, we were able to document patterns that would not have been visible if we had invoked the missing-at-random assumption to justify dropping cases with item nonresponse.
We think the foregoing analysis makes several useful contributions. First, our definition of criminal victimization goes beyond an exclusive reliance on homicide data to measure criminal victimization. As with studies that rely on homicide data, our findings suggest that being the victim of crime means one is more likely to consider international migration (Silva & Massey, 2015), but the type of crime may include less violent offenses. At least one other study with a similarly broad definition of victimization has found similar results (Wood et al., 2010). Second, in addition to measuring victimization, we examine the relationship between perceptions of neighborhood safety and intentions to migrate. While we do not find that these perceptions are consistently linked to the intent to migrate, additional research should continue to assess such perceptions, beginning with the development of better measures to capture subjective assessments of safety in Central America.
Our findings should be considered in light of several limitations. We were forced to use municipal-level data, but a neighborhood-level study would better capture the relationship between violence and the tendency to migrate, assuming that there is neighborhood-level variation within a given municipality. While the CARSI study sampled similar neighborhoods within the same municipality, it is inaccurate to assume that they are representative of the municipalities themselves. Neighborhoods are commonly the unit of analysis used in studies of mobility within the fields of urban studies and criminology (Dugan, 1999; Sampson et al., 2002), and our analyses might have been different had we been able to access the CARSI dataset disaggregated to the neighborhood level. It is also possible that the inconsistent relationship at the municipal level between victimization and the tendency to migrate is a reflection of the high cost of leaving and the inadequate resources required to do so. These costs include the financial loss of abandoning property and possessions, the expense of travel, and the social dislocation that results from leaving friends and family. For those traveling without a visa, there are also physical risks associated with travel through various transit countries on the way to the U.S./Mexico border.
Conclusion
To the extent that international migration from Central America is motivated by violence and victimization, the on-going security problem in this region suggests that this trend will continue (Donato & Massey, 2016). The urgency to address this concern is even more heightened by the growing number of Central American unaccompanied minors and family units with young children who are fleeing their homes. Some reports and exploratory studies suggest that they are fleeing the region due to fear of gangs and violence (Goldberg, 2014; Kennedy, 2014). Although we did not address how age might condition the intent to migrate in this paper (only adults were surveyed for the CARSI study), it is possible that adolescents who experience criminal victimization are more likely than their adult counterparts to consider international migration as a safety valve. Gang recruitment in Central America tends to target young children, fueling the need to escape (Seelke, 2016). Therefore, a richer understanding of the “push” factors motivating thousands of youth and families to flee El Salvador, Guatemala, and Honduras can meaningfully inform a policy response to those seeking asylum at the border and a more effective approach to development and foreign policy in their countries of origin (Donato & Sisk, 2015; Musalo & Lee, 2017).
Supplemental Material
sj-pdf-1-cad-10.1177_0011128720978737 – Supplemental material for Too Afraid to Stay: Measuring the Relationship between Criminal Victimization in Central America and the Intent to Migrate
Supplemental material, sj-pdf-1-cad-10.1177_0011128720978737 for Too Afraid to Stay: Measuring the Relationship between Criminal Victimization in Central America and the Intent to Migrate by Benjamin Roth, Amanda Huffman and Robert Brame in Crime & Delinquency
Footnotes
Declaration of Conflicting Interests
The author(s) declared no potential conflicts of interest with respect to the research, authorship, and/or publication of this article.
Funding
The author(s) received no financial support for the research, authorship, and/or publication of this article.
Supplemental Material
Supplemental material for this article is available online.
Notes
Author Biographies
References
Supplementary Material
Please find the following supplemental material available below.
For Open Access articles published under a Creative Commons License, all supplemental material carries the same license as the article it is associated with.
For non-Open Access articles published, all supplemental material carries a non-exclusive license, and permission requests for re-use of supplemental material or any part of supplemental material shall be sent directly to the copyright owner as specified in the copyright notice associated with the article.