




Abstract
This article examines three frameworks utilized in assessing quality of life (QOL) and sustainability, namely, (1) the Millennium Development Goals (MDGs), (2) the United Nations Commission for Sustainable Development (UNCSD) framework for sustainable development, and the (3) Livable Cities Indicators (LCIs). The study assesses the efficiency, relevance/appropriateness, and effectiveness of these frameworks in assessing the quality of urban life in cities, with special reference to Metro Manila. What do these indicators really tell us about urban quality of life and whose quality of life is reflected or measured in these indicators? The article suggests that the understanding and assessment of the quality of life in cities can become broader and more relevant if we take into consideration that macro indicators may not reflect the socio-economic realities of different sub-groups, especially the politically and economically marginalized urban groups and classes. In short, these QOL frameworks and indicators are not sensitive to issues of social exclusion, inequality, and resource distribution among sub-groups, which have a great bearing on quality of life and sustainability, both in the cities of the North and the global South. To advance this goal, there is a need to contextualize, localize, and decentralize the production and utilization of the QOL knowledge systems.
Quality of life (QOL) frameworks and indicators have been used to assess progress in societal development for the past few decades. QOL measures are deemed better at measuring human welfare compared to the singularly popular measure used by economists and planners, the gross domestic product or GDP (Tan, 2007). Some countries and regions, therefore, have formulated their own QOL measures to make it more contextually relevant and meaningful to the users of the framework. For example, Bhutan uses the Gross Domestic Happiness (GNH) index to underscore its fundamental goal of societal development and human welfare.
This article examines three frameworks utilized in assessing QOL in general, namely, (1) the Millennium Development Goals (MDGs), (2) the United Nations Commission for Sustainable Development (UNCSD) framework for sustainable development, and the (3) Livable Cities Indicators (LCIs). What do these indicators really tell us about urban quality of life and sustainability? Whose quality of life is reflected here or measured by these indicators? Reflecting on their efficiency, relevance or appropriateness, and their effectiveness in assessing the quality of urban life in cities, this article argues that these indicators do not really reflect the socio-economic and political realities of the different income classes and other sub-groups in the metropolis. Understanding the quality of life in cities, especially those from developing societies, becomes broader and more relevant if we take into consideration that macro indicators do not reflect the particular living conditions of the politically and economically marginalized groups. In short, these indicators are not sensitive to issues of social exclusion, inequality, and resource distribution among sub-groups, which has a strong bearing on quality of life and sustainability. This article concludes that to advance this goal, there is a need to contextualize, localize, and decentralize the production and utilization of the QOL knowledge systems, their allied indicators, and measurements.
The first part of the article outlines the key arguments while the second part discusses the potential strength and weaknesses of the major frameworks (i.e., MDGs, UNCSD, and LCIs) utilized in assessing quality of life in cities. This section highlights the indicators of each framework and the issues involved in applying these frameworks to concrete, specific urban, municipal, and neighborhood areas. The third part suggests ways to enhance broad, macro-based QOL indicators by making them more contextualized, accessible, and utilizable in different contexts and by different users. In particular, it suggests ways to improve the current macro-based standards of QOL indicators by focusing on ways to apply more contextually the frameworks in third world cities and localities. Finally, the article concludes with suggestions and recommendations in contextualizing these frameworks.
The following section provides an inventory of different sets of indicators and rankings of quality of life in cities. It examines the indicators used in the MDGs and the UNCSD and assesses their relevance and applicability to third world cities, especially in the Philippines. Following these QOL indicators, the Livable Cities Indicators (LCIs) in Asia are presented with the individual city rankings, their meanings and implications. It then compares and contrasts these with other indicators like the MDGs promoted by the UNDP and other UN agencies.
Standard quality of life indicators: Design and dimensions covered
This section presents the standard quality of life indicators currently used by nation-states, cities, and some localities, namely, the Millennium Development Goals (MDGs) and UNCSD’s Sustainability Indicators of Sustainable Development, and the Livable Cities in Asia Indicators.
The Millennium Development Goals
As shown in Table 1, the MDGs cover eight goals to eradicate hunger and poverty, achieve universal primary education, promote gender equality, reduce child mortality, improve maternal health, combat HIV/AIDS, malaria, and other diseases, ensure environmental sustainability, and develop a global partnership for development.
Millennium Development Goals.

Source: UNDP (2003).
While the MDGs attempt to address gender hierarchies (goal 3), they are silent on other indicators of social locations and hierarchies (e.g., race, religion, ethnicity, class, age) that may generate inequities in the distribution of resources across cities and localities. For example, goal 1, which is to eradicate extreme poverty and hunger, measures the proportion of people whose incomes are less than US$1 per day. Given current standards of living, this indicator of poverty might be appropriate for those in peri-urban or rural areas but certainly not in national capital cities like Metro Manila, Hanoi, and other regional centers. Also, this measure will have different meanings and implications for urban areas in other parts of Asia, like the urban areas in the Central Vietnamese Highlands, where the cost of living is lower compared to those in the capital cities of Hanoi or Ho Chi Minh.
For relevance and more effective application, there is a need to contextualize the meanings and implications of these MDG indicators and performance targets. In terms of a poverty threshold, the US$1/day might make measurement of cost of living comparable across cities and municipalities. But certainly, the meanings and possibilities of US$1/day to those below the poverty line in Metro Manila, Hanoi, and Ho Chi Minh City are quite different. In the same manner, the meaning of the promotion of gender equality can take on different forms in Vietnam, the Philippines or in Indonesia. Or for that matter, the risks of HIV/AIDS and the strategies of risk reduction vary largely from urban to rural areas and from one national context to the other.
In general, the MDG targets and indicators are not very sensitive to issues of social differentiation, social/community cohesion, and overall urban sustainability. The attractiveness of MDGs, however, lies in their simplicity, brevity, and seemingly doable goals and targets. The set of indicators also allow space for recalibration and enrichment of the goals and targets for better contextualization and relevance of application to specific cities and localities.
While the potential for refining and contextualizing the MDGs is excellent, applying them to specific national contexts can also pose problems of data accessibility, availability, and applicability. This is seen in the assessment of the MDG targets in the Philippines. Of 48 MDG indicators, 29 have available and accessible data, eight are not available (e.g., proportion of population in malaria risk areas using effective prevention and treatment measures, proportion of tuberculosis cases detected and cured under directly observed treatment short course), while 11 are not applicable, such as those pertaining to global partnership for development, and do not have direct relevance to the Philippine context.
In assessing the MDGs in the Philippines, Metro Manila has a score of .70 in achieving the targets, not far from its Asian neighboring cities like Bangkok or Singapore. But since this score is an average of all the municipalities and cities in Metro Manila, it does not capture the social and spatial inequalities among the 17 cities and municipalities comprising the metropolis. Data from the National Statistics Coordinating Board show that urban poor segments or communities of the metropolis suffer from high levels of malnutrition, infant and maternal mortality and therefore will have lower scores than the .70 rating obtained for Metro Manila. Some NGO estimates put the score of these urban poor communities at .35 or half of the overall score for Metro Manila. This ranking, therefore, has serious implications with regard to the production and utilization of QOL databases. Assessing the progress of achieving the MDGs in the Philippines, Briones et al. (2011: 3) concluded: The Philippines has been progressing well in many of the Millennium Development Goals (MDGs). However, with barely three years left until the 2015 deadline, the challenges remain formidable: the goals for education, as well as maternal and reproductive health, remain elusive. Prospects for significant reduction in moderate poverty have dimmed over the past decade.
UNCSD framework
I would like now to move the discussion to the UNCSD sustainability framework (see Table 2). Here, I would like to argue that the dimensions of sustainability have to be integrated into existing QOL frameworks for it to be more meaningful and applicable. Moreover, aside from the usual indicators of sustainability, urban governance indicators to reflect the quality of governance are central to making the institutional aspects of sustainability work. As shown below, the institutional dimensions of sustainability do not seem to recognize the importance of this factor in promoting a sustainable quality of life in cities.
UNCSD theme indicator framework.

As shown in Table 2, the UNCSD framework for sustainability covers four major categories of themes, namely, social, environmental, economic, and institutional (which expand to 15 dimensions) and 38 sub-themes that expand to 58 indicators (UN, 2001).
In the UNCSD framework, the theme of equity is divided into the sub-themes of poverty and gender inequality and further broken into four indicators, namely, (1) percent of population living below the poverty line, (2) Gini index of income inequality, (3) unemployment rate, and (4) ratio of average female wage to male wage. Compared to the MDGs, the UNCSD takes into consideration issues of equity but the problem is that most of these data are not disaggregated by cities and localities, nor areas within cities that indicate social and spatial inequalities of distribution of income, employment, resources, services, and facilities. Or in the case of the sub-theme for gender equality, the equity indicator is the ratio of the average female wage to male wage. But in most third world cities, the urban poor men and women are dominant in the non-waged based sector, the informal sector. In fact, in Metro Manila, the underground economy (non-wage, irregular, etc.) or informal economy accounts for 70% of economic transactions, according to informally communicated estimates by officials of the National Economic Development Authority (NEDA). Also noticeably missing in this framework is a category regarding the cultural and built heritage, which is covered by other frameworks like the Livable Cities Indicators discussed later in this article.
Other QOL frameworks
Some cities have crafted sustainability indicators that are deemed more responsive to the needs of specific cities and urban areas/neighborhoods. These QOL indicators involve a wide range of variables ranging from population characteristics, to economic development and urban safety. Some have operationalized these indicators to make it more appropriate and applicable for their cities. Examples of innovations in developing specific QOL frameworks include: (1) the New Zealand QOL for Large Urban Areas, which covers 56 areas of assessment (see below for details), (2) Asian Development Bank (ADB) Urban Indicators for Managing Cities, (3) London Quality of Life Indicators, and (4) the Livable Cities in Asia Indicators.
The ADB has formulated indicators for managing cities that cover eight categories, namely (1) poverty, (2) improved quality and quantity of social life, (3) urban productivity and competition, (4) urban land and housing, (5) urban services, (6) environment, (7) urban transport, and (8) urban governance and management.
There are many other initiatives and innovations to formulate more appropriate, relevant, and meaningful sets of QOL indicators. The examples give us an idea of the wide range of applications and attempts to contextualize in different parts of the world. The next sections discuss some of the more notable initiatives.
Contextualizing QOL applications: New Zealand’s large urban areas
Table 3 shows how New Zealand has revised the usual QOL indicators and adapted it to large urban areas. Their framework introduced several variables in recognition of their different contexts of application such as: (1) ethnicity in consideration of New Zealand’s multicultural population and how this social category can reflect differential access and distribution among the different ethnic categories; (2) education broadened into a knowledge and skills category to reflect the human resource capabilities of the different sub-groups in the population; (3) social deprivation added into the economic standard of living, recognizing the subjective, perceptual dimensions of poverty; (4) built environment includes look and feel of the city; (5) social connectedness includes community spirit; (6) housing includes the dimension of security of tenure and crowding; (7) safety includes perceptions of safety; and (8) civil and political rights include involvement in decision-making.
Quality of Life Indicators in New Zealand’s large urban areas.
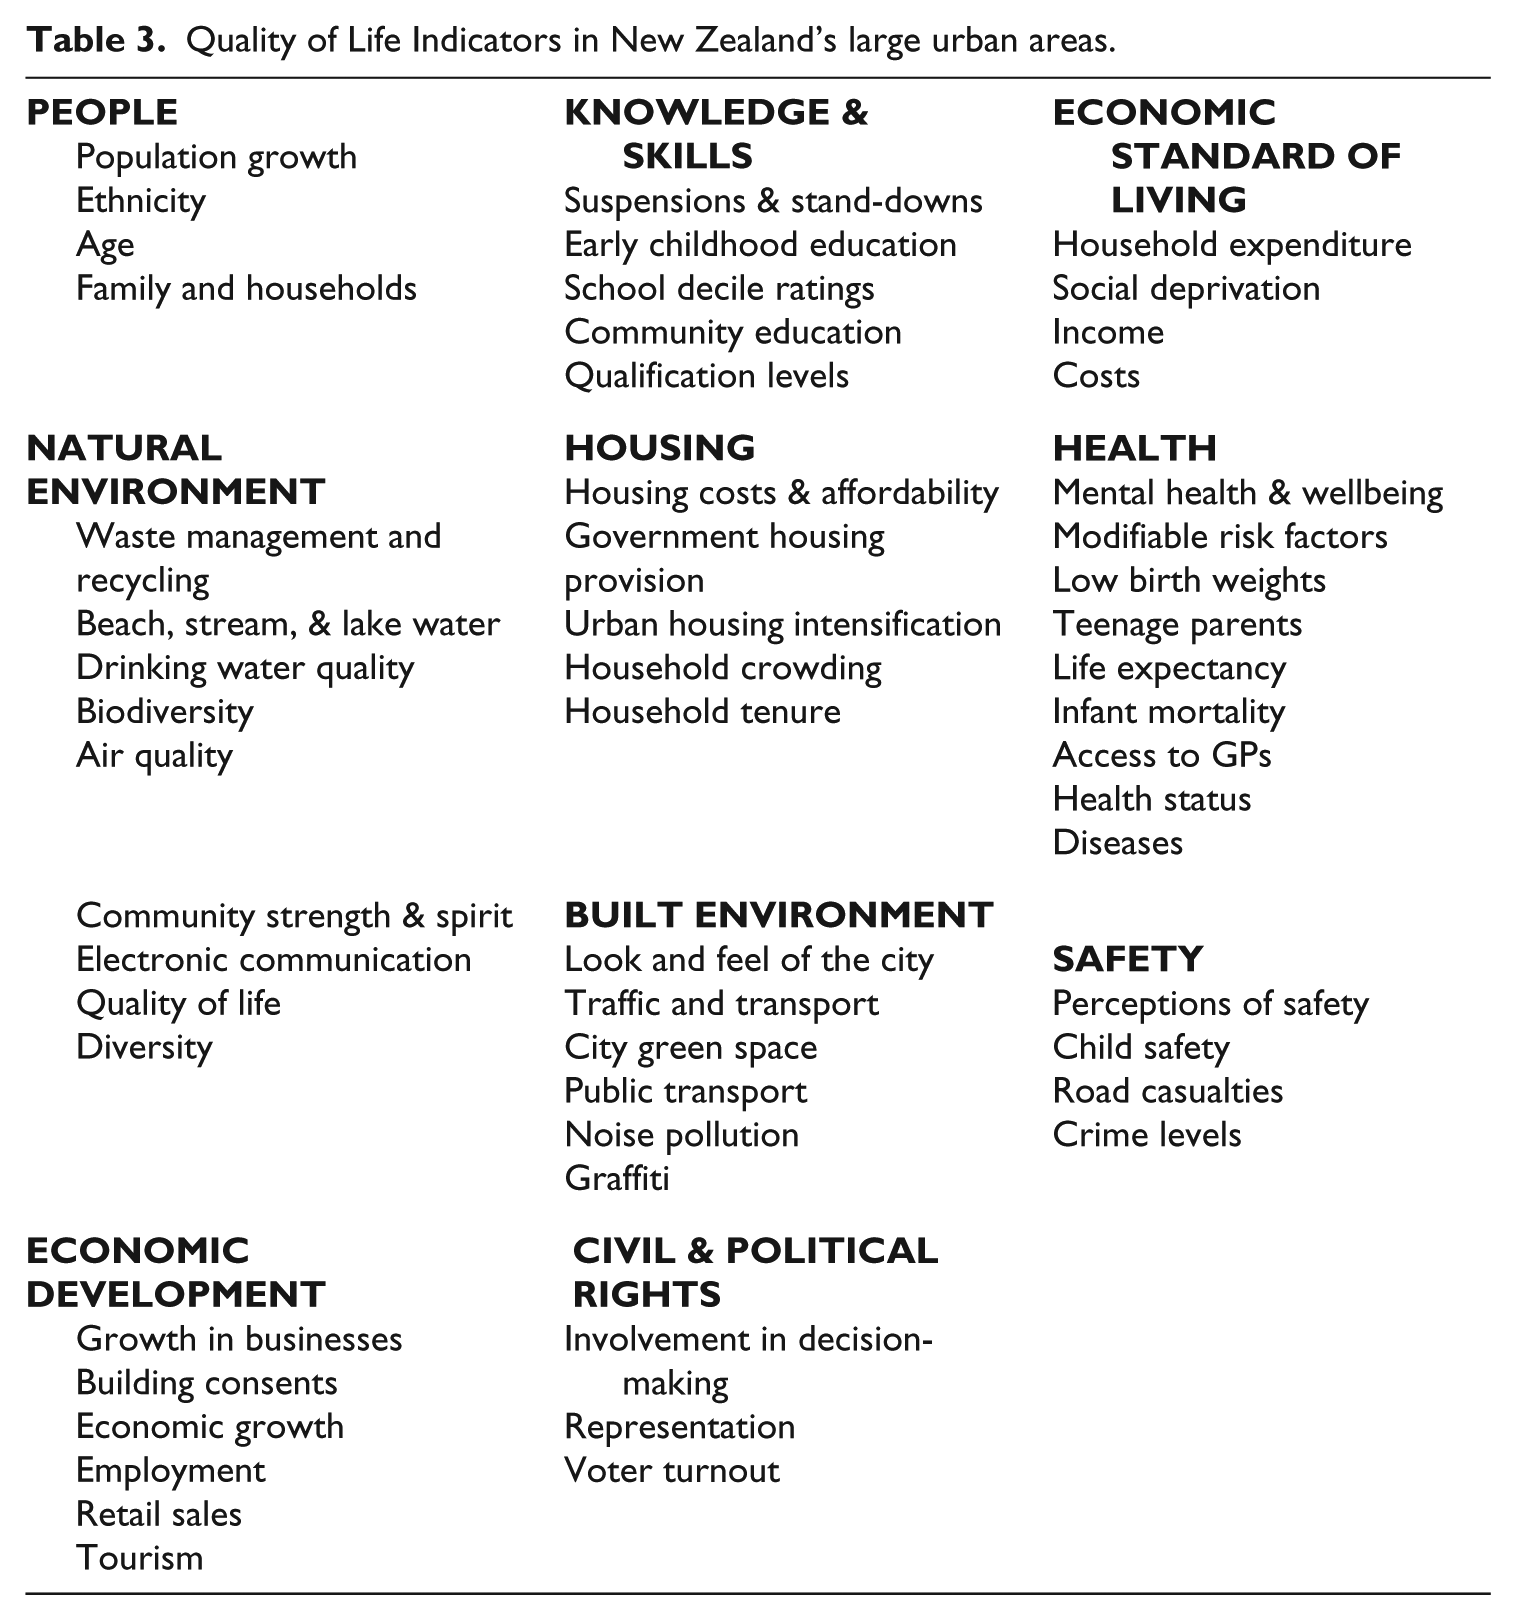
The indicators in Table 3 illustrate how contextualizing QOL indicators for increased relevance and adaptability is being done and continuously done by many cities. The New Zealand QOL for Large Urban Areas includes refining the indicators to address issues of poverty, equity, social cohesion, and sustainability among different subgroups (e.g., ethnic, gender, age, families/households of different social locations).
Contextualizing QOL in Asian cities: Livable Cities in Asia Indicators
Another initiative to contextualize QOL is the Livable Cities in Asia Indicators (see Table 4). This QOL framework puts a premium on health, education, environmental quality (e.g., indicators of carbon footprints, parks), housing, social services, economic capacities, safety, and access to communications technology. This set of indicators can also be compared to other ‘livable cities’ frameworks that put a high premium on parks, walkability, and accessibility of cities such as Dom’s ranking of New York, other American and European cities. Some of the promising innovations of the Livable Cities Indicators include: (1) environmental quality like sulfur dioxide in the air (ppm), nitrogen dioxide in the air (ppm), (2) ratio of housing price to income, and (3) average time to commute to work. I find the variable ratio of housing price to income quite promising because it gives us some sense of how accessible or inaccessible housing is to the lower income segments of the population. As I noted earlier, most QOL frameworks are not very sensitive to issues of resource distribution, a key aspect of urban sustainability. While the LCI seems to be sensitive to these issues, this accommodation is still quite lacking.
Livable Cities in Asia Indicators.
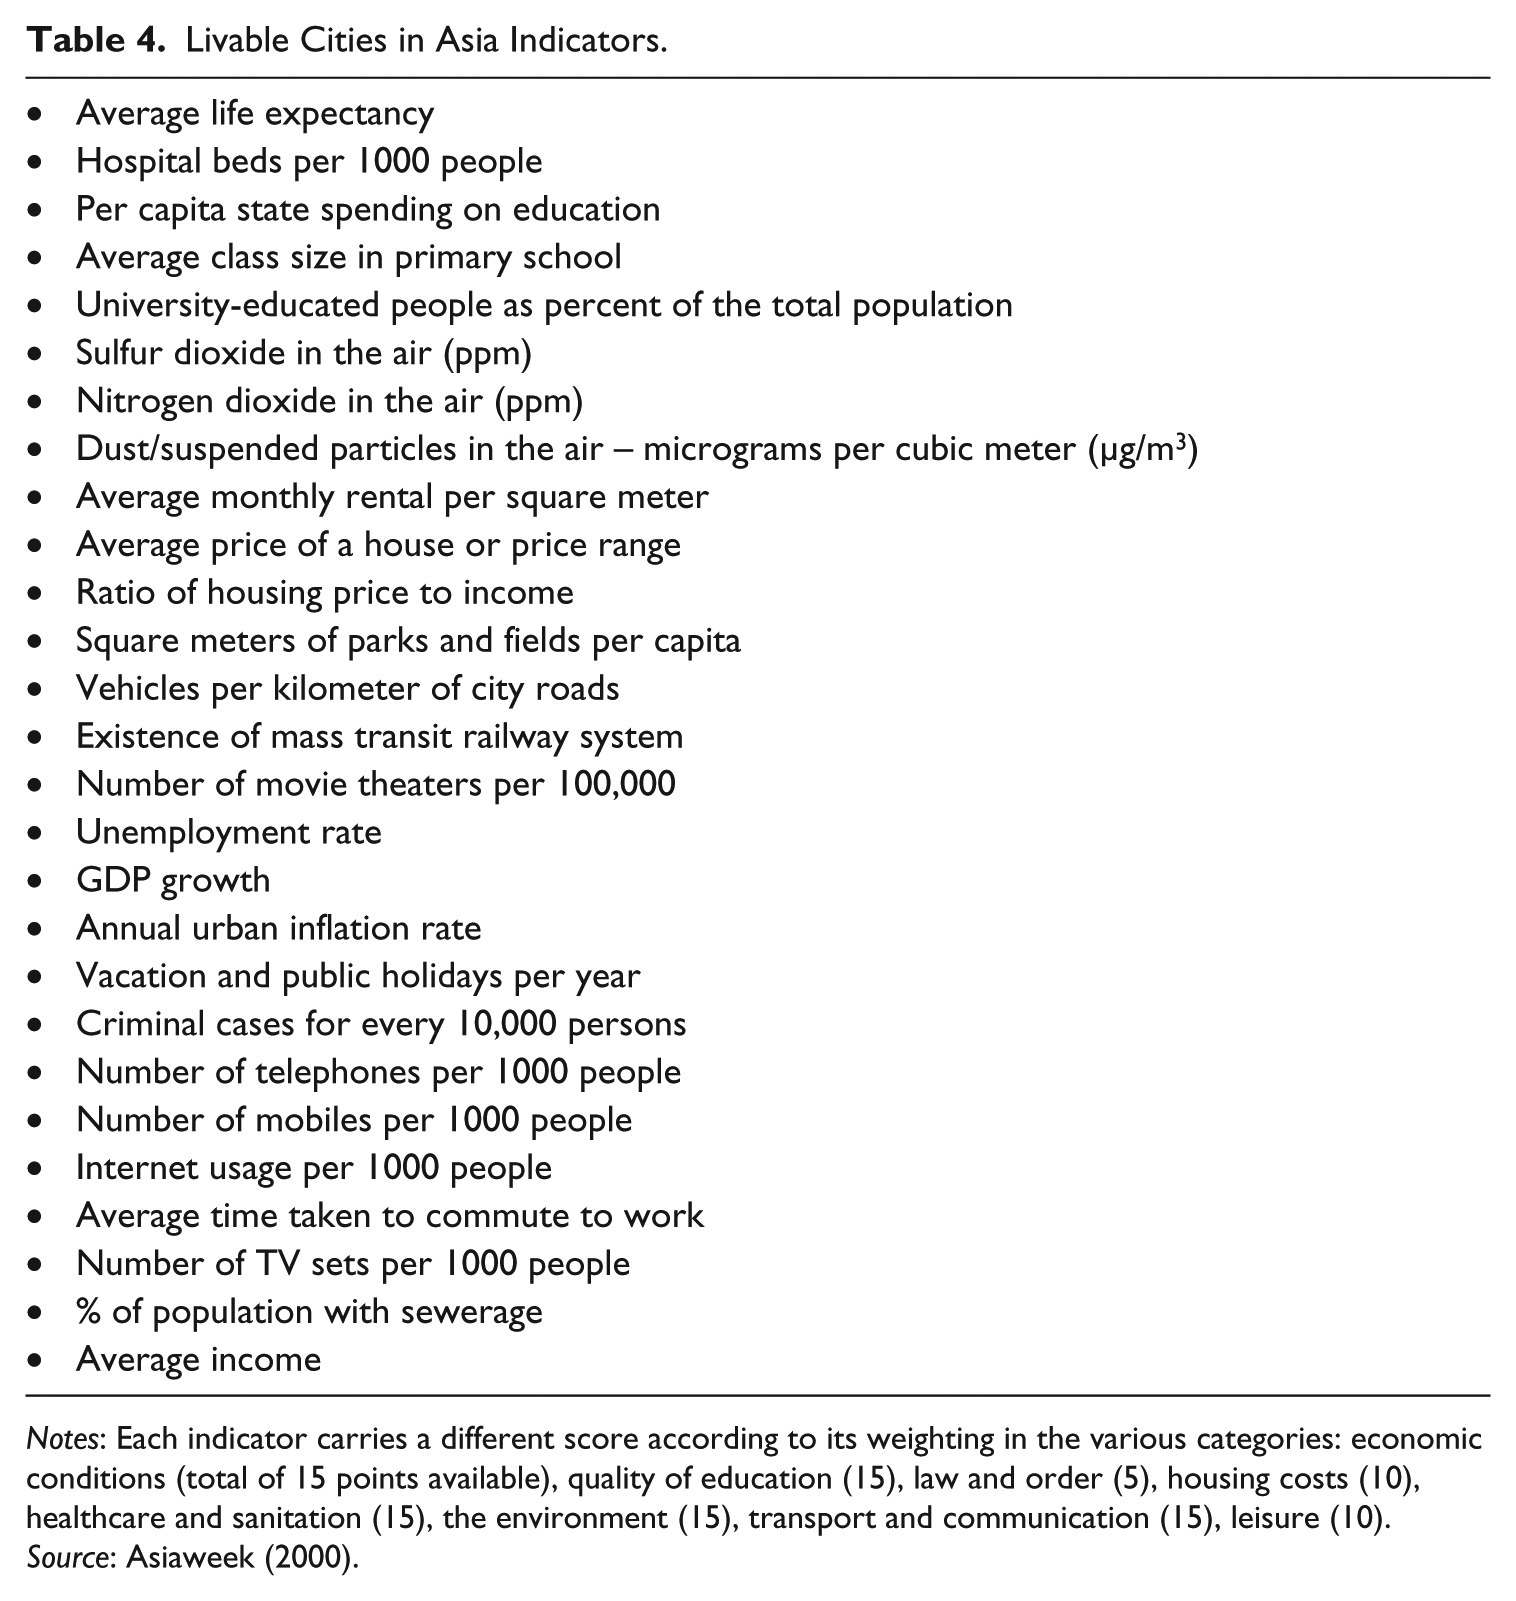
Notes: Each indicator carries a different score according to its weighting in the various categories: economic conditions (total of 15 points available), quality of education (15), law and order (5), housing costs (10), healthcare and sanitation (15), the environment (15), transport and communication (15), leisure (10).
Source: Asiaweek (2000).
The Neighborhood Sustainability Indicators
Another initiative to refine QOL indicators is the Neighborhood Sustainability Indicators developed by the Minneapolis-based Urban Ecology Coalition (2013). A set of practical tools for communities and neighborhoods, this was an attempt by community-based organizations and research professionals to define sustainability indicators for micro-level situations. This initiative formulated six types of neighborhood sustainability indicators, namely (1) data ‘poetry’ indicators which reflect the perceptions of local stakeholders of their neighborhood; (2) core indicators deemed useful by local residents, external funders, investors, and researchers; (3) background indicators or information about cities and neighborhoods that help define the context in which sustainability initiatives take place and are quite useful for both internal and external stakeholders; (4) deep sustainability indicators, variables which define the longer-term vision of community life for stakeholders; (5) friendly spaces indicator which measures over time through periodic survey gathering spaces in the neighborhood that invite people to meet each other or become better acquainted with other residents and their community; and (6) affordable housing indicators which assess whether local rental and ownership opportunities are affordable to residents of all income levels. As seen from this list, this set of indicators attempts to contextualize and localize the indicators to the appropriate level of use, that of community/neighborhood groups.
The affordable housing indicator above is comparable to the UNCSD framework which also has housing as a theme, with a sub-theme of living conditions, and indicated by floor area per person. This indicator is also similar to the concern of NGO networks like the Asian Coalition for Housing Rights (ACHR) for access to housing and security of tenure in urban areas as a key indicator of quality of life for the urban poor and other vulnerable groups in the city. Interestingly, the MDGs do not list housing and security of tenure as a key indicator; instead they allude to the improvement of lives of people in the slums through improved access to water and sanitation services. Significantly, the Neighborhood Sustainability Indicators put a premium on the stakeholders’ assessments of their cities and neighborhoods, a key dimension for the relevance and applicability of sustainability indicators.
Assessments of standard quality of life indicators and revisions
In examining these frameworks and applying them to assess the quality of life in Metro Manila and other cities, the following observations can be made:
These are macro indicators that assess the objective, quantitative, and structurally based indicators of urban life and neglect the subjective, perceptual, experientially based, and/or other qualitative dimensions of urban life. These assessment tools are functionally developed with enough detail to measure comprehensively the quality of life for general urban-based populations.
These indicators summarize (in average points) the conditions of urban life for the whole population and, therefore, are not sensitive to the quality of life of other segments of the urban population like the urban poor and other vulnerable populations.
Thus, these indicators are not sensitive to the social and spatial inequalities or the variable distribution of resources across areas and social classes/groups in cities. In short, they are not sensitive to issues of equity and distribution of resources, services, and facilities across income classes and socio-cultural groups, factors crucial to the sustainability of cities and urban areas.
Thus, the dimensions of urban ‘livability’ and sustainability is not highlighted or paid attention to in these quality of life frameworks.
To make these indicators more sensitive to the issues of poverty, equity, and sustainability, I propose that local assessments should disaggregate the data into meaningful units of analysis. Thus, data sets can be differentiated according to sub-groups (e.g., age, gender, occupation, education) and the levels of vulnerability among different groups like lower class men, women, children, and workers in the informal sectors. If assessments of QOL are disaggregated to meaningful units and the results are used to debate local investment planning and distribution of public goods, then perhaps sustainability of marginal communities can be attained.
We can also further examine the macro-based structural indicators (viewed as objective) indicators versus the qualitative and perceptual, subjective and experiential indicators of quality of life according to different social and political locations. I would also like to suggest that these QOL indicators do not highlight an important aspect of urban life, namely governance factors, which fundamentally shape resource distribution issues. As Leftwich (1993) strongly argued, urban politics determine distribution of power and resources and are crucial in distributing the fruits of development to various citizen groups.
Integrating quality of life indicators with the urban sustainability framework
First, assessments of the QOL of any country or city can be more efficient and effective if we bear in mind the following criteria: comparability, applicability or relevance, and accessibility of databases. This should be borne in mind as we apply the indicators to cities or urban areas with different historical-structural, political-economic, and cultural contexts. Second, these assessments can be improved by integrating issues of sustainability into the QOL indicators and targets like the MDGs. More importantly, integrating indicators of equity and distribution of resources (e.g., indications of level of poverty and marginality across groups) and social services across different segments of the population will improve the efforts at contextualizing the QOL framework.
Quality of life indicators: Sensitivity to applications and articulations in varying socio-cultural and political-economic contexts
There is a need to come up with several levels of articulation of QOL indicators. Data systems need to be collected and organized in such a manner that they can be disaggregated according to relevant political or administrative levels, different sub-groups of the population (e.g., age, gender, ethnicity, religion, income groups or classes, occupation or livelihood bases, and other variables that can indicate the group’s social location). If the databases can allow us to disaggregate data according to these variables, then we can get a sense of the social and spatial inequalities in a particular city or locality.
In the Philippines, the Minimum Basic Needs (MBN) and MDGs have been localized by local government units such as cities, municipalities, and barangays. In 2006, the Galing Pook Foundation examined the 215 local government units (LGUs) which have received awards for excellence in local governance to see if any of them had integrated the MDGs in their development programs. Sadly, only 10 LGUs (two provinces, four cities, and four municipalities) were found to have integrated the MDGs and were moving progressively towards achieving the targets.
Proposals and recommendations for assessing quality of life in cities
Based on the above analysis, it is evident that there is a need for QOL and sustainability frameworks to recognize the different socio-cultural and political-economic contexts of application/articulation. In doing so, we can have accessible, useful and meaningful bases for comparison and application. From the above initiatives, this article strongly argues for the integration of key QOL indicators with some of the dimensions of the urban sustainability framework.
Integrate dimensions of access and distribution
The proposed system must recognize issues of social and spatial inequality among different segments/classes of the population and different localities. The current macro-based indicators need to be disaggregated to reflect more effectively the material conditions of the not-so-average populations, i.e., at the ends of the social spectrum like the socially deprived groups.
Decentralizing/localizing production and utilization of database systems
While the production of and utilization of large database systems need to be done by central state agencies with legitimacy and proven institutional capacity, there is a need to decentralize and democratize this process.
Democratize the production and utilization of QOL indicators
For the databases to be meaningful and relevant, indicators must be able to capture the conditions of the different socio-economic groups of people. They must be responsive to the initiatives of conceptualization and utilization at the level of different institutions and communities that can use it in understanding and planning their communities. To respond to these needs, academic institutions and research institutes must work in collaborative ways in producing the data systems utilized in QOL assessments.
Conclusion, prospects, and challenges
The standard QOL frameworks and indicators are useful in comparing the QOL status of countries based on particular database systems. But the meanings and implications of these databases can vary from one historical, social, economic, and political-economic context to the other. The quality of life could vary among different subgroups in the city or different areas in the country.
The article closes with several preliminary conclusions. These existing QOL indicators are good as summative indicators of quality of life but miss out on important components of quality of life, namely the indicators of equity and sustainability as well as how people from different sub-groups experience urban life (e.g., security, safety) and how cities are governed, which affects the distribution of resources to those economically and politically marginal urban populations.
The following issues need to be addressed in making QOL frameworks and indicators in cities more relevant, applicable, and utilizable:
Accessibility/availability and relevance to particular socio-cultural and political-economic contexts. It is hard to compare QOL indicators from one context to the other because of varying levels of relevance, applicability and availability, and/or accessibility of the data needed for the indicators.
Limits of urban primacy and carrying capacity. QOL indicators do not also seem to address the limits of urban primacy, regional growth, and the carrying capacity of cities and localities.
Issues of distribution, poverty, and marginality. The current QOL frameworks need to be revised at the national, regional, and local levels so that issues of distribution, levels of poverty and marginality among various citizen groups can be better understood and highlighted in planning and implementation of policies and programs.
Lack of meaningful units of analysis. To be more meaningful most QOL indicators have to be further disaggregated to cities, municipalities, and other smaller administrative units like districts or wards. In this way, the data can also reflect spatial and social inequality across areas and population sub-groups. Thus, while HDI (Human Development Index) can potentially reflect social and spatial inequalities across areas/groups, currently existing database systems are not disaggregated to smaller administrative units.
Quality of life indicators and social differentiation. Standard, macro-based QOL frameworks and indicators are also not sensitive to issues of social differentiation within cities and across cities. Since these indicators are averages of total units, then, it does not indicate the distribution of resources (e.g., education, housing, infrastructural development) across national, regional, small town urban centers, and within cities.
Quality of life and integration of cities to the global system. The current QOL assessment frameworks are not also sensitive to how cities are integrated into the global political and economic system. For example, the increasing casualization (more and more workers are integrated into the labor force without tenure) of the labor force means that their work tenure and security are further threatened.
Issues regarding the structure of urban politics and power which shape the distribution of resources among different segments of the population are hardly reflected in these QOL frameworks and indicators. Governance and politics mediate strongly in the distribution of resources across several towns and cities in Metro Manila and across different classes. In the process, urban sustainability is seriously threatened when key governance indicators and distribution issues (resources including infrastructure development) are not paid much attention in urban politics and development.
Finally, most QOL indicators like the MDGs must be updated and revised to take into consideration two interrelated factors that threaten the sustainability of cities and communities – climate change and the increasing inequality across/within nations and communities. Any updating of MDGs after 2015 must take those factors into consideration if we are to adapt and sustain our life on earth.
Footnotes
Funding
This research received no specific grant from any funding agency in the public, commercial, or not-for-profit sectors.