



Abstract
Professional events that feature face-to-face interaction of social scientists from across the world are, next to publications and research, important forms of scientific knowledge production and dissemination. Thus, they are vital to the World Science System (WSS). Like other WSS elements, scholarly involvement in international social science events is characterized by unequal cross-national representation. This article focuses in-depth on the International Sociological Association (ISA), a major international social science professional association, to examine inequality in attendance at its flagship conferences. To what extent do countries differ with respect to the number of scholars attending ISA conferences? What factors drive attendance? The authors base their hypotheses on the economic, political and social dimensions that influence country representation. To test these hypotheses the authors use a dataset containing information on 212 countries and their participation in the eight ISA conferences – World Congresses and Forums – held from 1990 to 2012. Results show that a country’s GDP, level of democracy and social science research infrastructure (SSRI) substantially determine their level of representation. SSRI effects are significant above and beyond the effect of GDP and of other controls. Findings also show a meaningful over-time decrease in representation inequality according to countries’ GDP.
In general terms, the World Science System (WSS) refers to the economic, political and social factors involved in the production and distribution of, and access to, scientific knowledge on a global scale. The structure of this system is characterized by various kinds of inequalities (Alatas, 2003; Beigel, 2014; Caillods and Jeanpierre, 2010: 1; Leydesdorff and Wagner, 2009; Mosbah-Natanson and Gingras, 2014: 627–629; Patel, 2014) some of which last for decades (Martin, 2012: 833–836; Mosbah-Natanson and Gingras, 2014). Theoretically, the deep and persistent inequalities within the WSS manifest as a core–periphery system in which privileged, western countries dominate (Alatas, 2003). Some argue that core–periphery is too simplistic a model, rightly pointing out the production and consumption of the many regional and country-specific sociologies (Beigel, 2014; Keim, 2011). While the analogy can be debated, it is clear that scientific knowledge published outside of the West, due to differences in language, publication formats and electronic availability, is less visible to those who dominate the WSS (Wagner and Wong, 2011). The consequence of durable inequality is that western social science institutions grow in strength and outpace those of peripheral countries, which remain under-resourced and less known (World Social Science Report, 2010: 350).
Recognition of the unequal WSS has led to initiatives designed to call wider attention to this issue and promote inequality-reduction policies (Beigel, 2014: 619–621). An important part of this apparatus is the empirical studies on inequality across the WSS. Most of these tend to focus on publishing and cross-national scientific collaborations (Bentley, 2015; Mosbah-Natanson and Gingras, 2014; Wagner and Wong, 2011).
Next to publications and team research outputs as key forms of scientific knowledge production, professional events – conferences, world congresses, forums and similar meetings that feature face-to-face interaction of scholars from across the world – are vital to the WSS (Glänzel et al., 2006; Godin, 1998). Regarding sociology, attendance at international scientific events is important for three reasons. The first reason deals with production of knowledge. Sociological knowledge, as recorded in academic journals, builds on the presentation of papers at international scientific conferences (Glänzel et al., 2006; Godin, 1998; Lisee et al., 2008). The second reason pertains to the processes of scholarly learning and collaboration. Sociologists gain the opportunity to learn from, and connect to, scholars from different countries with whom they do not regularly interact; this spurs creativity and forms the foundation for new scientific collaborations. In addition, sociologists gain access to the personal networking that is intrinsic to professional development and status building. Attending international conferences is important in the building and evaluation of academic careers.
Empirical analyses of the WSS with regard to unequal attendance at major international science events are sparse, partly due to data constraints. The largest dataset on scientific meetings is the Conference Proceedings Citation Index, a landmark database, with some limitation regarding space, time and disciplinary coverage (Michaels and Fu, 2014). The few articles that use these data focus on a narrow selection of countries and time periods and show that western countries tend to dominate professional meetings in terms of published conference proceedings (Glänzel et al., 2006; Godin, 1998; Lisee et al., 2008; Schubert et al., 1983). Some find that countries formerly on the periphery, such as China, are increasing their presence at international scientific meetings (Glänzel et al., 2006; Leydesdorff and Wagner, 2009). Yet none of these studies analyzes inequality in attendance at international sociology meetings.
Our article makes this contribution. We ask: To what extent do countries differ with respect to the number of scholars attending international social scientific conferences? and What factors are associated with attendance? We focus in-depth on the International Sociological Association as one of the very few international social science professional associations whose existence spans decades, whose stated purpose is to attract sociologists everywhere to attend their conferences, and that has attendance data at the country level.
The International Sociological Association (ISA), established in 1949, is a large professional association for sociologists from over the world, and thus has taken a prominent role in the globalization of sociology. 1 According to the current Statutes, the purpose of ISA is to represent sociologists from everywhere. 2 Of the ways to achieve inclusion, worldwide representation at ISA conferences is the most visible, and also one that impacts the international community of sociologists directly.
The extent to which ISA’s flagship conferences – the quadrennial World Congress and the mid-term Forum – have successfully included sociologists from all over the world is an open empirical question. We examine economic, political and social factors associated with country representation at ISA World Congresses and Forums from 1990 to 2012, altogether eight events, on a database we constructed with information provided by ISA and from various public data sources. We are unaware of any other publicly available electronic data source on participation at ISA meetings with such broad time and country coverage as this one.
ISA uses the terms Congress and Forum. Since both events are, in all appearances, international conferences, we call them ‘conferences’. One can note that, for the eight conferences between 1990 and 2012, 10 countries lead in terms of total number of participants: USA (3678), UK (1952), Germany (1898), Spain (1811), Canada (1594), Brazil (1482), Australia (1293), France (1250), Italy (929) and Argentina (884). Figure 1 illustrates participation from 1990 to 2012 by world regions.
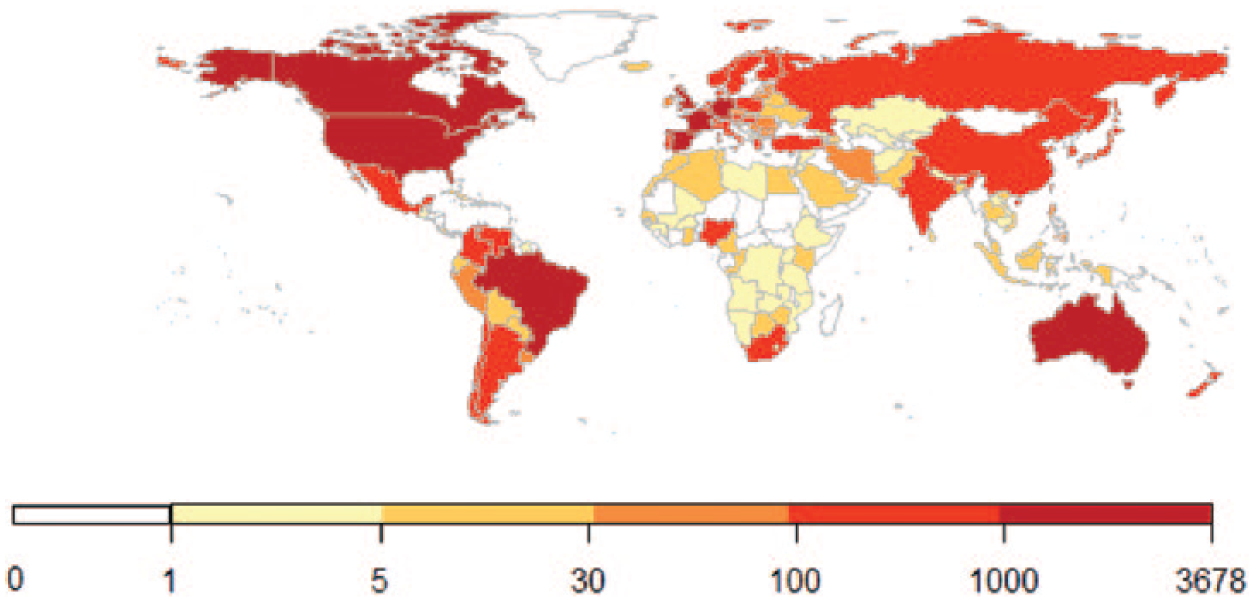
Number of participants at ISA events, 1990–2012.
Theoretical perspectives and hypotheses
Struggles over inclusion and equality have characterized the organization of ISA since its founding (see Platt, 1998). 3 The ISA’s Executive Committee and its membership past and present have been concerned about the inclusion of sociologists from all parts of the world. Originally, ISA was a UNESCO initiative, and as a United Nations organization all countries in ISA were to be treated equally (Platt, 1998: 13–16). In 1948, UNESCO wrote that the purpose of ISA is ‘to knit together social science scholars of the world’ (Platt, 1998: 13). In 2010, Michael Burawoy was elected President of ISA on his platform of the 3 Ms – media, membership and message: ‘Creative use of electronic media, to build a more inclusive and interactive membership, while advancing a global sociological message for all.’ 4
The ISA statutes make the role of ISA explicit: to represent ‘sociologists everywhere’ (Article 1) and ‘to advance sociological knowledge throughout the world’ (Article 2.1). 5 To achieve this purpose with regard to attendance at ISA conferences, the ISA established two policies: a sliding scale of membership and conference registration fees and ‘due attention to diversity’ in choosing the location of their conferences. 6
While inclusiveness has been the goal, ISA conferences seem to be dominated by richer, more democratic nations that have solid research infrastructures. In a report on the 2010 ISA World Congress in Gothenburg, Sweden, attended by close to 5000 sociologists from 103 countries, then Vice-President of ISA (and now, President), Margaret Abraham, noted the over-representation of sociologists from the US and the under-representation of other countries: ‘While the United States had the largest number of registrants (517), this number should be kept in perspective by underscoring the economic, political, and social factors that limit participation from poorer countries’ (Abraham, 2010).
A, B and C countries in ISA
In determining the amount that individuals and organizations need to pay for membership and conference registration, ISA focuses solely on the economic factor. Based on ‘the Gross National Income per capita’, ISA divides the world into three categories – A, B and C countries; the source of income data is the World Bank. 7 ISA presents this classification in the ‘Table of Economies by Category’. 8 In this scheme, ISA provides the fee structure for individual membership, wherein A, B and C are rank ordered. Specifically, individual sociologists in the poorest countries (category C) pay lower fees than their counterparts in A and B countries; people in A countries pay higher fees than those in B countries. 9 In all countries, membership fees for students are considerably lower than for the rest. 10
Location of ISA conferences
The ISA World Congress and, since 2008, the ISA Forum, are the two main international conferences of the ISA.
11
The ISA Statutes express the rationale for choosing the location of the Congress (Article 11):
12
The choice shall give due attention to the need for diversity of locations over time, as well as to local organisational resources and physical capacity; unlimited admission to the country of all participants, regardless of nationality, is essential.
Though Forums are not mentioned here, we assume that the ISA guiding principles for choice of location are similar to those for the World Congresses. In line with this assumption, the 2012 Forum was organized in Latin America, marking the first time since 1982 that a major ISA conference was held in this region.
Beyond the ABC scheme and location of ISA events
The ISA ABC scheme considers poor economic resources as a barrier to sociologists’ engagement in ISA, and tries to minimize their negative effect. It is certainly a welcome step toward broader inclusion, as is the consideration of location of events. However, this strategy is narrow in its scope since it misses the likely impact of other determinants, such as political and social conditions. To identify what drives attendance at ISA conferences, we first turn to the history of ISA (Platt, 1998) and Margaret Abraham’s statement. As Platt (1998: 47) suggests, ‘For general activities, numbers and funds weigh more heavily, and national representation in … World Congress attendance is accordingly skewed’. Abraham points to three broad factors that inhibit attendance at ISA conferences – economic, political and social (Abraham, 2010).
We derive hypotheses about the economic, political and social factors also using important insights from the few empirical studies on international conference attendance (Godin, 1998; Schubert et al., 1983), and from research on related issues, such as country inequality in inclusion in international survey projects (Slomczynski and Tomescu-Dubrow, 2006).
Interplay between economic and political factors
We start with the broader economic and political factors that influence work conditions and resources available to travel to international conferences. As Platt (1998: 36–37) put it, ‘Among available locations, the desire to encourage the sociology of the region has been relevant to the choice, but ease of access for the wider membership has been in conflict with that’. Ease of access is largely dependent on economic resources and the political environment. Economic and political factors not only influence where the conferences are held, but also the ability of sociologists to attend (see also Godin, 1998; Schubert et al., 1983).
We agree with ISA that country-level economic resources have a measureable impact on sociologists’ participation in ISA. However, instead of the tripartite division into A, B and C countries, we view economic development as a continuum on which countries are placed. In addition, we consider political factors, the level of democracy in particular. Greater civil liberties and political rights are usually accompanied by more academic freedom to carry out research and to travel abroad. Academic freedom is usefully viewed in terms of the relationship between academia and the state, and the extent to which researchers are free from government-initiated constraints on their research activities (Rostan, 2010: 73; see also Bryden and Mittenzwei, 2013: 314–315). The level of democracy also indirectly accounts for internal political problems, including internal fighting and civil war, that impact the functioning of society and the capacity of sociologists to travel to ISA conferences. Sociologists from countries with low levels of democracy also face difficulties with traveling abroad due to travel restrictions related to obtaining passports, official permits and visas. Of course, economic and political conditions are interrelated and the impact of each should be controlled for the other. Thus, two fundamental hypotheses are:
H1: Richer countries have stronger representation at ISA conferences than poorer countries, other things equal.
H2: More democratic countries have stronger representation at ISA conferences than less democratic ones, other things equal.
Social factors
The quality of a country’s science research infrastructure should be strongly related to researchers’ opportunity to attend professional events. We consider that countries’ participation in large-scale international research projects, such as the major cross-national public opinion surveys, is a reasonable indicator of the social science research infrastructure. Country representation in cross-national public opinion surveys is very uneven due to economic and political reasons and reflects the strength of national-level social science research infrastructure required for active participation in such projects (Slomczynski and Tomescu-Dubrow, 2006; see also Lynn et al., 2006: 12–13; on the importance of cross-national data for ISA internationalization, see Platt, 1998: 47). 13
We argue that adequacy of the social science research infrastructure is analytically distinct from economic and political dimensions, through clearly related to both, and is associated with participation at international conferences. We think here of a country’s pool of public and private survey organizations with experience and ability to partake in international projects, that is, to meet research design implementation standards, from sampling procedures to sufficient documentation and translation of the survey data into English for international consumption. We assume that countries that often and evenly participate in large-scale cross-national social science studies have strong support of private and public organizations that make up the social science research infrastructure. Sociologists from these countries seem to be more likely to attend ISA meetings because of stronger support on the national level and because of stronger networking with colleagues from abroad. Thus,
H3: Having an adequate social science research infrastructure strengthens countries’ representation at ISA conferences, ceteris paribus.
Important control variables
Countries differ with regard to the pool of potential participants at international scientific meetings. It is reasonable to expect that smaller population countries and countries with smaller rates of tertiary education will have fewer sociologists and thus send fewer sociologists to ISA conferences. The largest countries, and countries with high rates of enrollment in tertiary education, should have representation net of their levels of economic resources and democracy. Hence, we control for population size and enrollment in tertiary education.
As ISA recognized early on, the actual location of their conferences influences who attends. This should still be the case because of the time and financial costs that travel incurs, and due to cultural affinities. We expect that countries located within the same continent as the country hosting the ISA conference will send more representatives than countries outside the continent, other things equal.
Data, variables and methods
To test these hypotheses, we created a dataset with 212 countries included in the ISA Table of Economies. 14 Information for our dependent and independent variables comes from ISA, the World Values Survey websites and various public data sources.15,16
ISA lists the number of registered participants according to the nationality (country) that the participant declared. 17 Our dataset contains eight time points, from 1990 to 2012, corresponding to the eight ISA meetings within this interval. Six of the events are World Congresses; we also include the two Forums. 18 These data span important changes in the WSS, including the dismantling of the USSR, the creation of multiple new democracies and the rise of BRICs – Brazil, Russia, India and China. The locations of events between 1990 and 2012, with number of participants (N) are as follows:
Four in Europe: Madrid, 1990 (N = 4328); Bielefeld, 1994 (N = 3242); Barcelona, 2008 (Forum, N = 2289); Gothenburg, 2010 (N = 4944);
One in North America: Montreal, 1998 (N = 3832);
One in Australia: Brisbane, 2002 (N =2785);
One in Africa: Durban, 2006 (N = 3052);
One in Latin America: Buenos Aires, 2012 (Forum, N = 3592).
Part of our analysis deals with the distribution of all participants in these events among countries that are characterized by different levels of economic resources and democracy. To model attendance at conferences we use the logarithmic transformation of the number of participants at each event that ISA provides. Since many countries did not send any participants, and the distribution is right-side skewed (skeweness = 7.7; kurtosis = 78.17), the dependent variable is used in logarithmic form, log (number of participants + 1). 19 Adding one and then taking the natural logarithm deals with extreme values in the original (skeweness = 1.5; kurtosis = 4.4) distribution, while also allowing to retain the value of zero for countries with no representatives at ISA conferences. Under this specification, countries that sent no participants receive the value of zero, those sending one participant receive the value of 0.6, while countries with largest numbers (e.g. 717 participants, USA 1990) receive the value of 6.9.
Data format
Since countries have repeated measures over eight measurement occasions corresponding to the ISA conferences between 1990 and 2012, for most of the analyses we treat the data as repeated cross-sectional and analyze them within the framework of multilevel modeling, where the units of analysis are country-years. 20
Each measurement occasion (t = 0, 1, 2, …, 7) is nested within countries (i = 1, 2, …, 212). We take the year 1990 as reference point for the new socio-political and economic realities after the fall of the Iron Curtain. Thus, we code the first measurement occasion 0 and interpret the effect of period in further analyses in comparison to 1990. Our data yield 1696 country-years (212*8) as units of observation for the long-shaped data file.
Main independent variables
As indicator of a country’s economic resources, we take the Gross Domestic Product per capita in Purchasing Power Parity for the year prior to the ISA event (using World Bank data). An exception is our first measurement period, 1990, when GDP is measured in the year of the conference. To deal with extreme values in the original distribution, we logged the GDP variable.
We measure countries’ level of democracy using the indexes of Civil Liberties and of Political Rights (Freedom House) for the year prior to the ISA event; again, the exception is the 1990 conference, where we use 1990 data. Each of the two indexes ranges from 1 to 7, with higher scores indicating greater civil liberties and political rights, respectively (this is reversed coding of Freedom House scores). In our analyses, a country’s level of democracy is the mean of that country’s scores on the Civil Liberties and Political Rights indexes. We note that no comparable cross-national measures of academic freedom and freedom to travel are available. Level of democracy, as measured through the Civil Liberties and Political Rights indexes, is a useful proxy.
Theoretically, the social science research infrastructure can be operationalized by the number of working social scientists, but cross-nationally comparable data are not available. A recent World Social Science Report (2010) attempted to study the number of social scientists across the world, but concluded that ‘the state of accessible international data on social sciences’ is characterized by ‘the incomparability of data on the number of researchers between countries and regions, and over time’ (2010: 354).
We developed a meaningful measure of the social science research infrastructure as country participation in the World Values Survey (WVS) or the European Values Survey (EVS) programs. 21 WVS is the world’s largest academic and freely available cross-national project that has attempted to conduct social science surveys worldwide (see also Tomescu-Dubrow and Slomczynski, 2014: 106–107). Inclusion in WVS depends on social scientists’ ability to raise their own funds for conducting the survey in-country, and to adhere to WVS’s methodological requirements. As such, this measure is at once a meaningful measure and a conservative test of our hypothesis.
WVS and EVS cooperate on various methodological issues, including questionnaire design and timing of fieldwork. As a result of timing of fieldwork, overlap in country coverage within a single WVS/EVS wave is minimal: EVS typically includes most of Europe, while WVS covers other countries of the world. Our measure of the social science research infrastructure counts the instances a country participated in WVS/EVS in years prior to, or in the year of, a given ISA event. 22 The resulting measure is cumulative and time-varying.
The correlations of social science research infrastructure with GDP (r = 0.498) and with democracy (r = 0.370), while positive and significant, are of moderate strength. This supports our assertion that the infrastructure measure is analytically distinct from a country’s economic resources and level of democracy.
Control variables
We use World Bank data to construct the country measure for population (in millions), and UN data for enrollment in tertiary education per 100,000 people. Except for the first measurement occasion (1990), when the population and tertiary enrollment variables are for the same year as the ISA conference, the two independent variables are measured one year prior to an ISA event. Both measures correlate with the dependent variable on a level that supports our view that these characteristics should be controlled for when trying to understand country differences in participation at ISA conferences (see Appendix, Table A.2).
We consider six continents – Africa, Asia, Australia, Europe, North America and South America – and create an indicator of proximity (geographical and/or cultural) to conference location: for each ISA event, we construct a dichotomous variable that measures whether countries are located within the continent of the respective ISA conference =1, else = 0.
We provide descriptive statistics in the Appendix. Specifically, Table A.1 provides the maximum and minimum values, means and standard deviations for all variables used in this article. Table A.2 complements this information with the correlation coefficients for each pair of variables.
Analyses
Inequality of country representation at ISA conferences: Economic forces
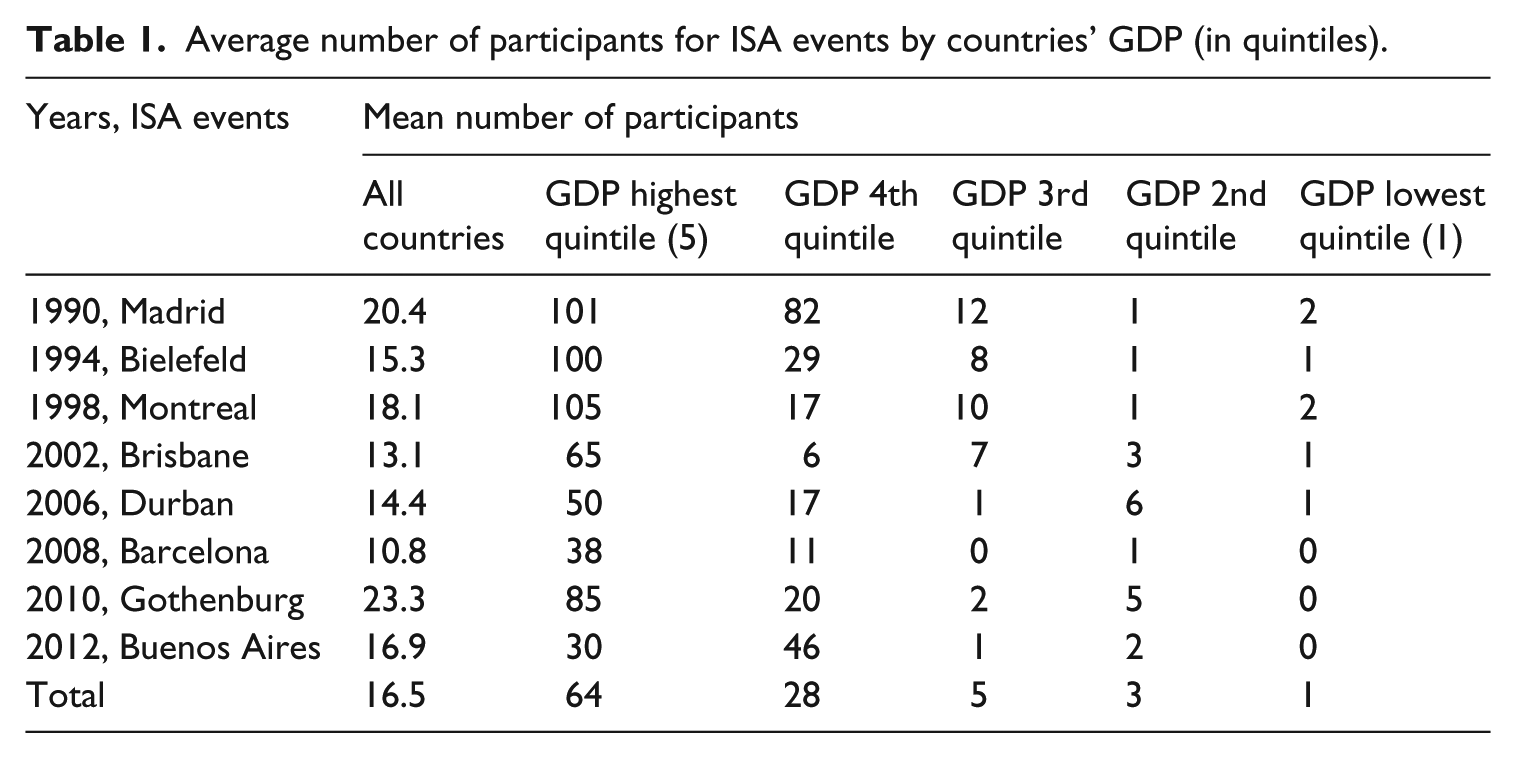
The basic insight about the economic dimension of inequality in ISA participation is evident from Table 1, which presents the average number of attendees at specific ISA events per country for countries with different levels of economic resources, measured by GDP per capita in Purchasing Power Parity for all conferences between 1990 and 2012. The differences between these averages are striking: for all events, the richest countries – that is, countries in the two top quintiles of GDP – sent the overwhelming number of participants to all ISA events. These results do not consider the inter-country differences in population size.
Average number of participants for ISA events by countries’ GDP (in quintiles).
In Figure 2 we present inequality of country representation at ISA conferences in the income dimension. The vertical axis provides the cumulative percentage of participants in ISA events from 1990 to 2012 (N = 28,069), while on the horizontal axis countries are ordered with respect to deciles of GDP per capita.
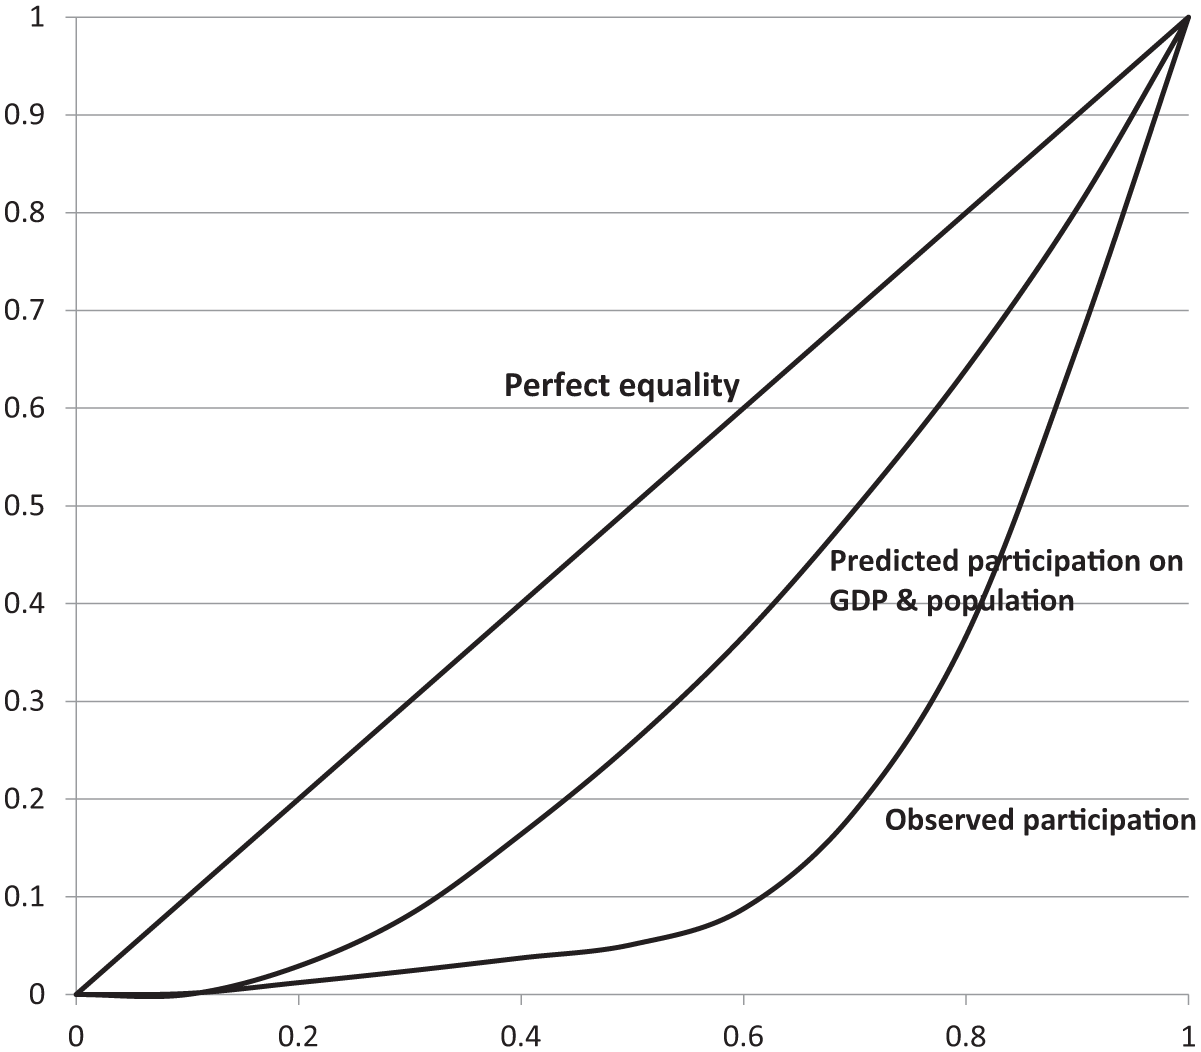
Inequality of country representation at ISA conferences.
Figure 2 displays two Lorenz curves. The lower curve, that is, the one further away from the line of perfect equality, shows that 5% of participants at all ISA events come from the countries whose GDP is below the median. The Gini coefficient corresponding to this curve is very high (Gini = 0.61). 23
The upper Lorenz curve is for the relationship between the same dependent variable – number of participants in all ISA events – but here the effect of GDP is estimated by controlling for countries’ population size. In this case, 26.3% of participants come from the countries whose GDP is at and below the median. The Gini coefficient (Gini = 0.33) is much lower, but still its size warrants concern.
To see whether inequality in representation at ISA conferences in the income dimension changed over time, we also calculated the Gini coefficient for the 1990 World Congress, in Madrid, and for the 2010 World Congress in Gothenburg. For these calculations we used predicted number of participants at the respective conferences; the effects of GDP in 1990 and 2009 are estimated controlling for countries’ population size in 1990 and 2009, respectively. The Gini coefficient for 1990 equals 0.51, while for 2010 it is 0.43.
We observe meaningful (significant) decrease in inequality in the income dimension. In 1990, the lowest number of participants (0 to 2 persons per country) occurred in one-third of the analyzed countries; for 2010, we find the same low number of participants for one-fifth of the countries. In 1990, the poorest 50% of countries sent around 10% of all participants of the Madrid Congress, while in 2010, they sent close to 20% of all Gothenburg participants.
Political and social forces of inequality
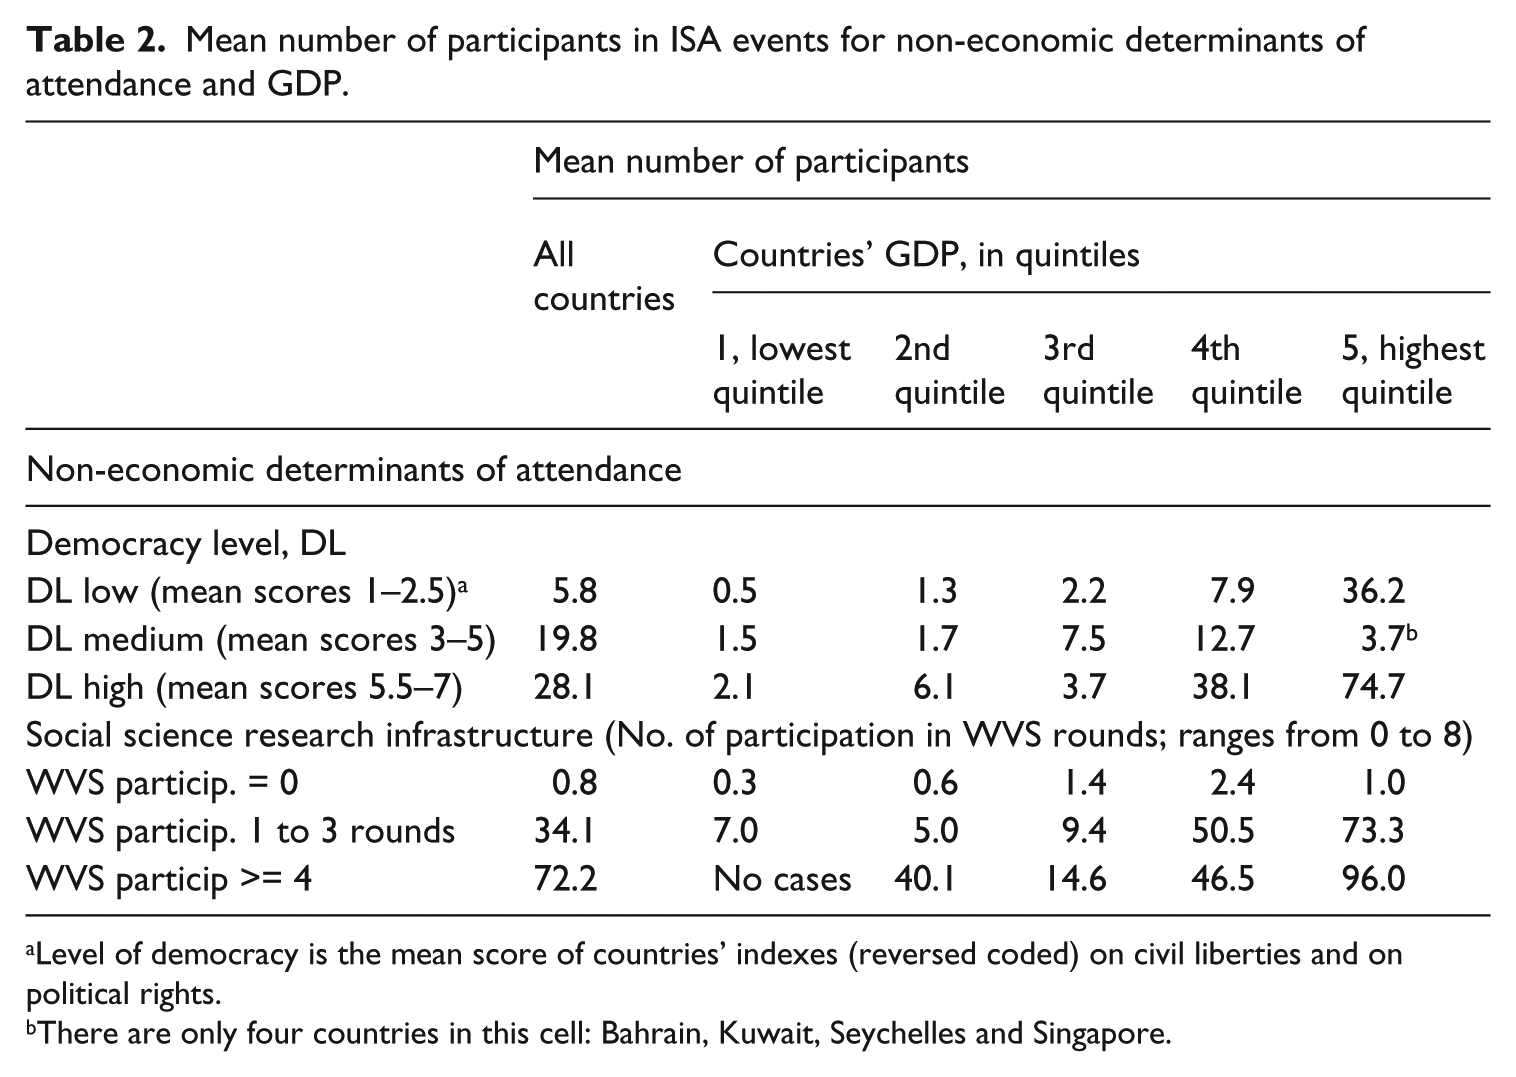
In Table 2, we group countries by their level of democracy – low, medium and high, respectively. This grouping is based on countries’ mean score on the Civil Liberties and Political Rights indexes and follows the Freedom House breakdown into non-free, partially free and free countries. We also distinguish three groups of countries with respect to their level of social science research infrastructure: countries that have never participated in any WVS/EVS rounds between 1990 and 2012; countries with medium infrastructure are those that participated in one to three rounds; and countries with high infrastructure are those who participated in four or more WVS/EVS rounds.
Mean number of participants in ISA events for non-economic determinants of attendance and GDP.
Level of democracy is the mean score of countries’ indexes (reversed coded) on civil liberties and on political rights.
There are only four countries in this cell: Bahrain, Kuwait, Seychelles and Singapore.
Results point to marked differences in averages of participation in ISA conferences for high-resource countries versus other, whether these resources are strictly economic (GDP), or not. The contrast is even starker when we compare different levels of non-economic resources accounting for countries’ economic standing. In the case of democracy, the monotonic relation is disrupted only in two situations: for countries with the highest level of democracy and in the third quintile of GDP, and for those with medium levels of democracy and highest GDP. In the first situation are diverse countries, including from post-communist Europe, Latin America, Africa and Asia. In the second situation are Bahrain, Kuwait, Seychelles and Singapore.
In their work on unequal representation of countries in cross-national projects, Slomczynski and Tomescu-Dubrow (2006) found that GDP and democracy are consequential for countries’ inclusion, which Table 2 also suggests. In Figure 3 we depict the interaction effect of GDP, in log form and centered at the median, and a dummy for democracy (countries are coded 1 if they score above the median score of 5 on democracy, and 0 if they score at or below the median). The dependent variable is number of participants at any of the ISA events between 1990 and 2012.
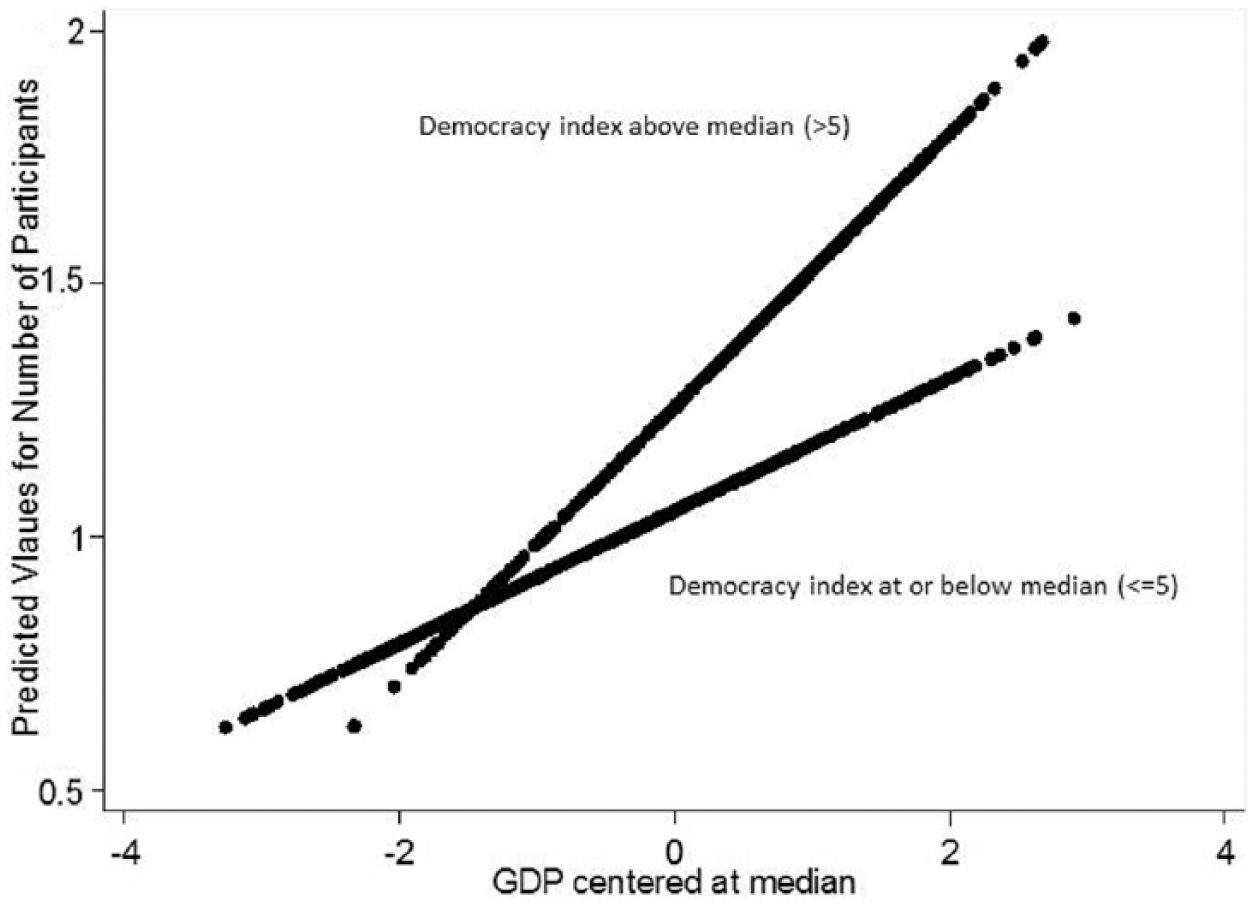
Predicted value of attendance in ISA events by economic resources (GDP per capita, log form) for different levels of democracy (dichotomized index).
Among relatively poor countries, the relevance of democracy level is very small. In the middle, the gap is already much larger, and for wealthy countries, it is impressive. Generally, for countries with above median levels of democracy, the impact of economic resources on the number of ISA conference attendees is much stronger than for less democratic countries, as indicated by the steeper slope of the ‘Democracy index above median’ line. Put differently, it is more advantageous to be wealthy and more democratic (i.e. score above the median) than to be wealthy and less democratic.
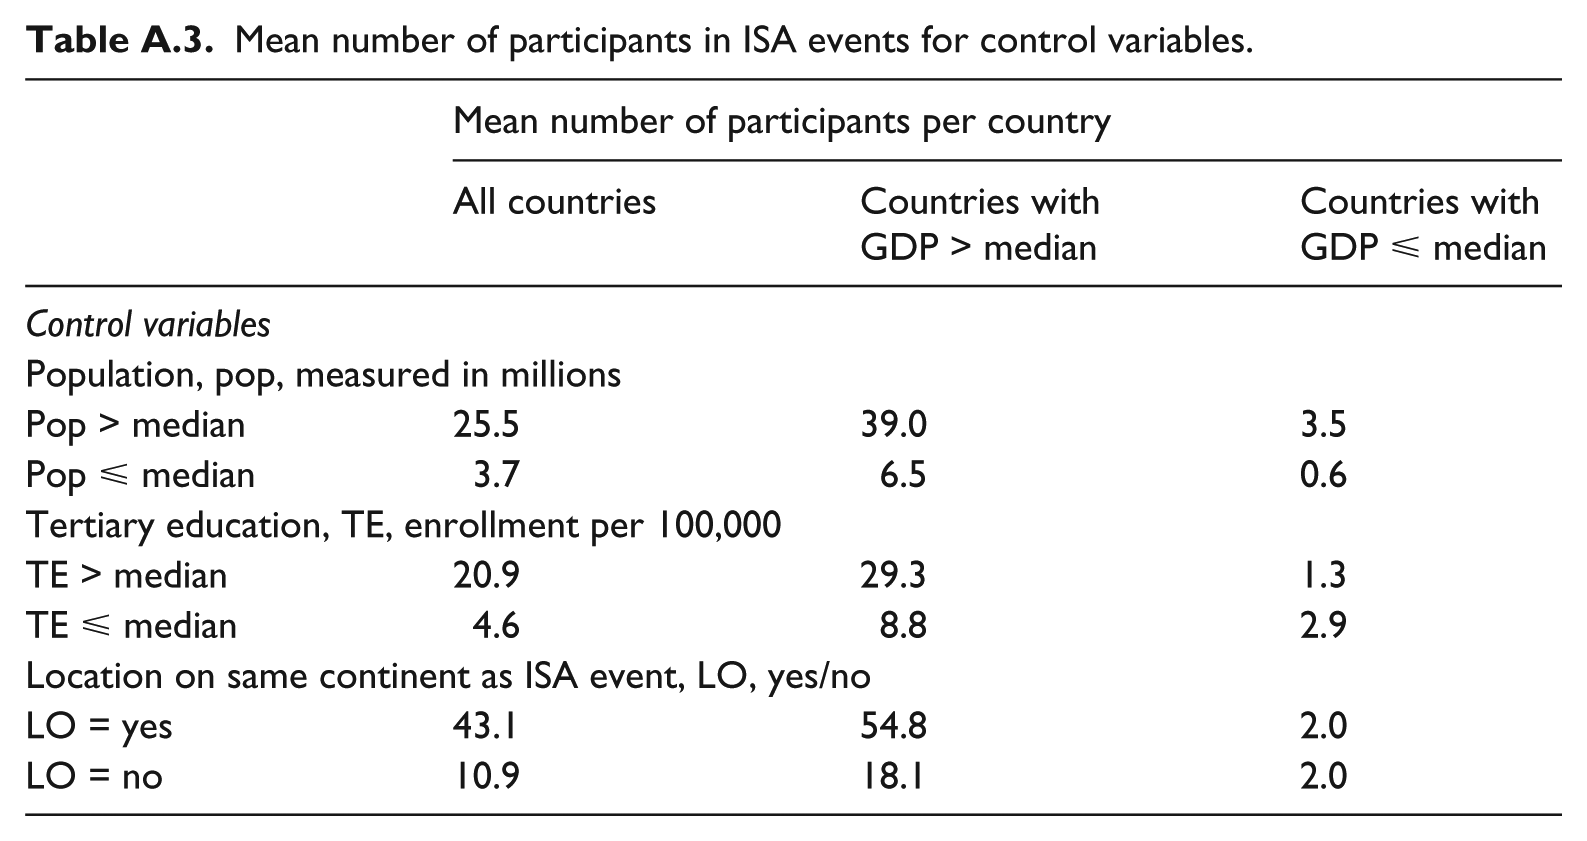
Returning to the second part of Table 2 – the social science research infrastructure – countries that participated between one and three times in WVS/EVS between 1990 and 2012, and whose GDP is in the top quintile anytime in this period, sent an average of 73 participants, compared to an average of one participant for countries with no WVS/EVS participation. The corresponding numbers for the lowest GDP quintile are 7.0 and 0.3. For mean number of participants in ISA events for control variables – population size, tertiary enrollment and location on same continent as ISA event, see Appendix, Table A.3.
Modeling determinants of attendance at ISA conferences
We estimate the effects of the proposed determinants of ISA attendance using two-level linear regression models, where the first level corresponds to measurement occasion (period), and the second level, to countries (for detailed discussion of multilevel models, see Hox, 2010; Rabe-Hesketh and Skrondal, 2008). Since the outcome of interest, number of participants from a given country, has a right-skewed distribution, in the following regressions we use it in logarithmic form, log (number of participants + 1). 24
From the intercept-only empty model (not presented), we obtain the intra-class correlation coefficient, rho, equal to 0.90. From this we know that 90% of the observed variation in the eight ISA participation measures is due to differences between countries, and 10% comes from variance within countries over time.
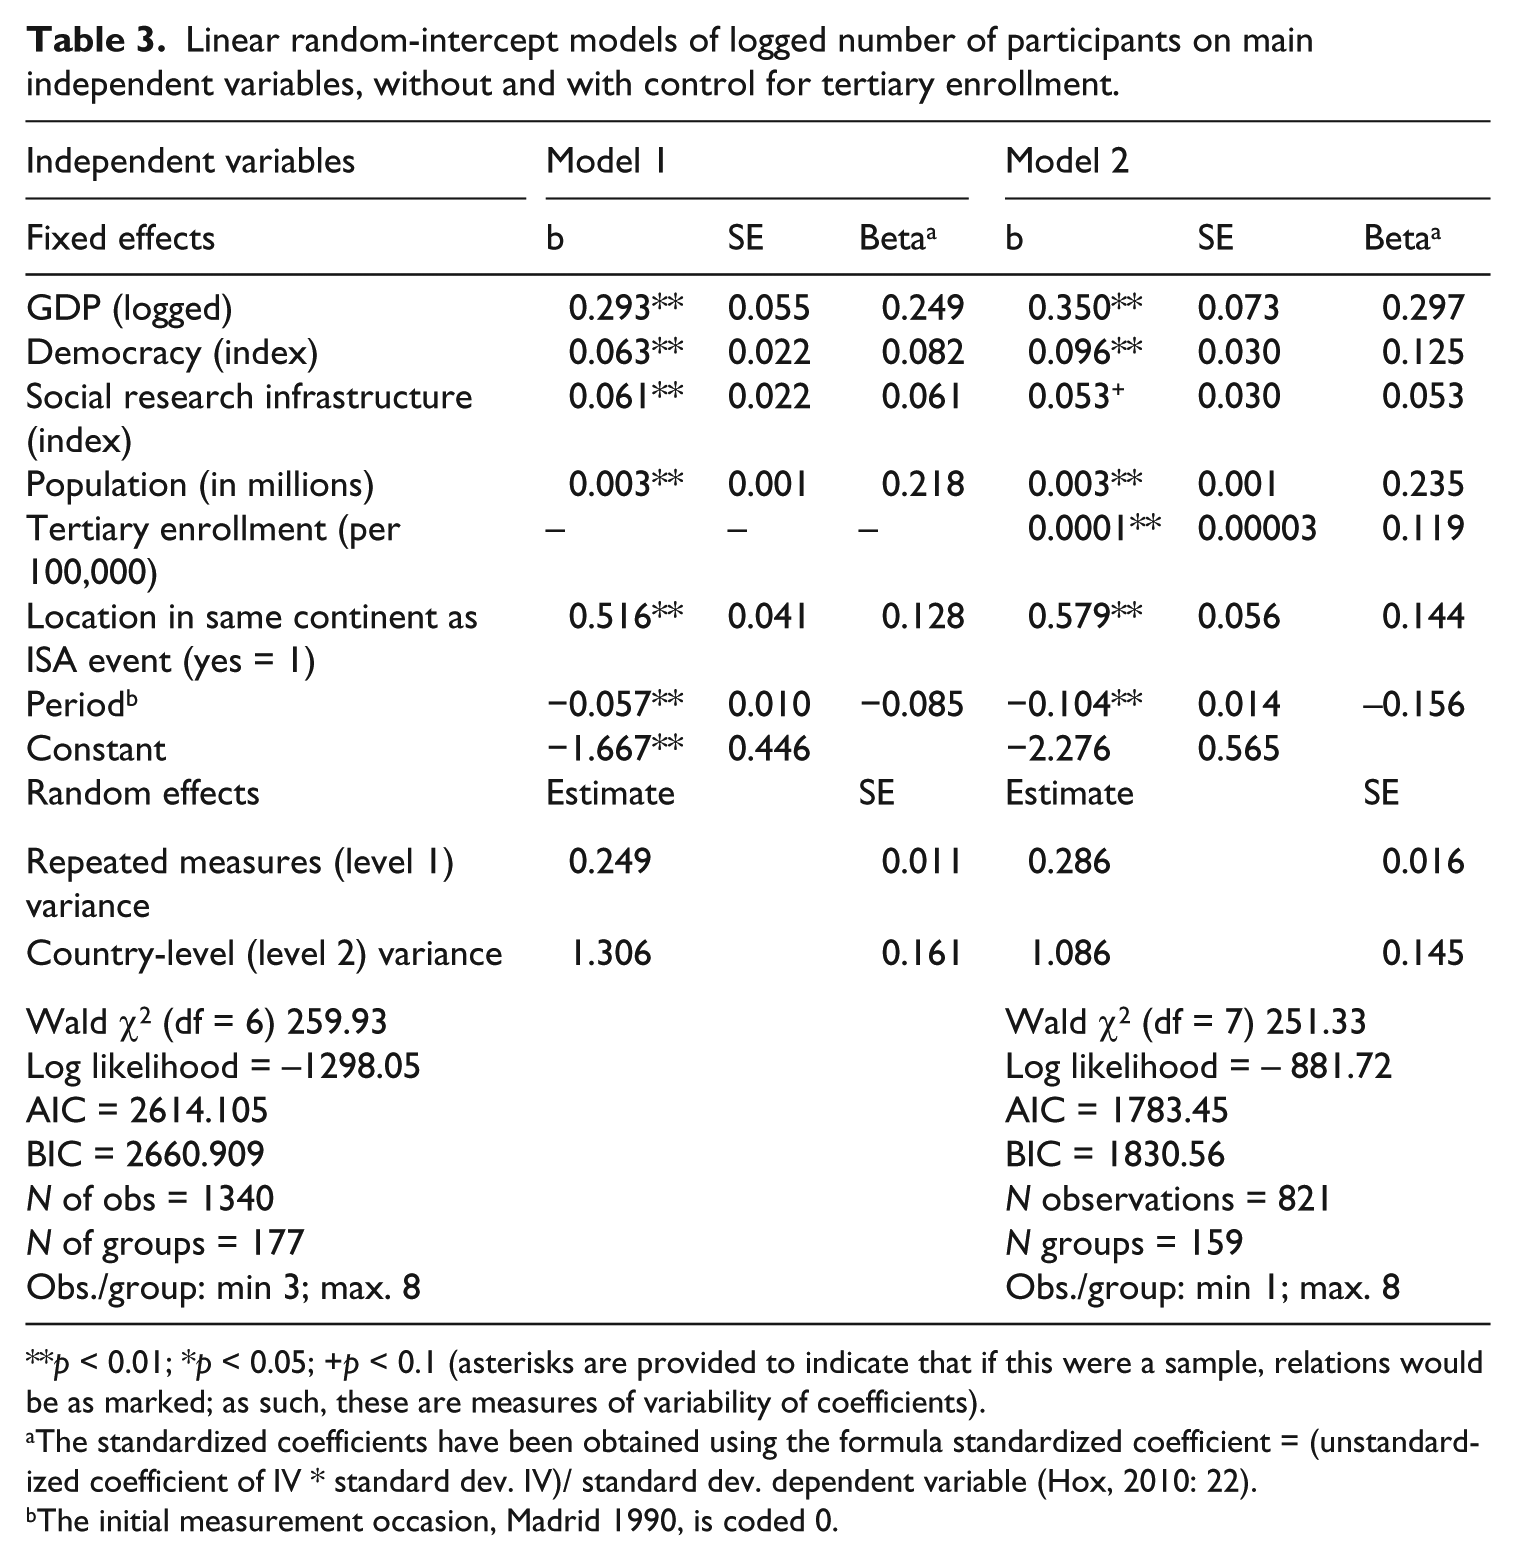
At this point, we want to add the covariates of interest and model the outcome. Since fixed parameters are usually estimated with greater precision than random parameters, we start with random-intercept models: the regression intercept is assumed to vary across groups (here, countries), but the regression slopes are assumed fixed (Hox, 2010: 57). 25 Knowing that social science research infrastructure correlates with enrollment in tertiary education at Pearson r = 0.62 (see Table 2), we estimate two random-intercept models, the first without control for enrollment in tertiary education, and the second with this control (see Table 3).
Linear random-intercept models of logged number of participants on main independent variables, without and with control for tertiary enrollment.
p < 0.01; *p < 0.05; +p < 0.1 (asterisks are provided to indicate that if this were a sample, relations would be as marked; as such, these are measures of variability of coefficients).
The standardized coefficients have been obtained using the formula standardized coefficient = (unstandardized coefficient of IV * standard dev. IV)/ standard dev. dependent variable (Hox, 2010: 22).
The initial measurement occasion, Madrid 1990, is coded 0.
Comparing results of models 1 and 2, we can say the following: country-level economic resources, measured by GDP per capita, have the strongest relative impact on attendance at ISA events. Level of democracy matters, net of other factors: stronger democracies are better represented at ISA. Having a stronger social science research infrastructure (SSRI) strengthens country representation at ISA conferences, ceteris paribus. This holds even after tertiary enrollment is controlled for, although the latter weakens the effect of SSRI. In both models, the impact of time is negative. This finding makes sense in light of initial descriptive results: the correlation of period (i.e. measurement occasion) and the dependent variable is zero, while period is positively related to economic resources, democracy, SSRI and enrollment in tertiary education (see Appendix, Table A.2).
Results in Table 3 also show that ISA policies on location of its events matter: compared to countries located on other continents, location within the same continent as the country hosting the ISA conference has a significant and substantive positive effect on number of participants, all other factors controlled for.
The variance for the intercept, var(cons), is statistically significant in both models 1 and 2, indicating that countries have different initial states of participation in ISA (here, initial means 1990, Madrid). Because we did not include a random slope for time, it is assumed that the rate of change is the same for all countries. This assumption may not hold. To check this assumption, we estimate a random coefficient model where the slope for measurement occasion varies across countries.
Table 4 presents the results. Indeed, the significant slope variance for period means that countries have different rates of change. The variance component of 0.006 for the slopes of the period variable seems small, but multilevel models assume a normal distribution for these slopes (Hox, 2010: 89), for which the standard deviation is 0.077 (square root of 0.006). If we compare this to the coefficient value of −0.11 for the average period slope, we see substantial variation among time slopes, which is not modeled well by the available country-level variables.
Linear random-coefficient model of logged number of participants on main independent variables and controls.

p < 0.01; *p < 0.05; +p < 0.1 (asterisks are provided to indicate that if this were a sample, relations would be as marked; as such, these are measures of variability of coefficients).
The standardized coefficients have been obtained using the formula standardized coefficient = (unstandardized coefficient of IV * standard dev. IV)/ standard dev. dependent variable (Hox, 2010: 22).
The initial measurement occasion, Madrid 1990, is coded 0.
In this random coefficient model, there is a small negative covariance between the initial status and the growth rate (covariance period, constant = −0.02), which can also be presented as the (partial) correlation between the intercept and slope residuals, equal to −0.25. It means that countries that in 1990 had relatively low values for their attendance increased their attendance faster than other countries.
The substantive results pertaining to the effects of the independent variables and of the controls do not change under the random-coefficient specification of the model. Since the likelihood ratio test comparing model 2 in Table 3 and model 1 in Table 4, which are nested models, yields a χ2 = 15.01 (df = 2), with a corresponding p-value of 0.000, we decide that the random coefficient model is the preferred estimation solution.
Summary and discussion
In this article we asked, To what extent do countries differ with respect to number of scholars attending ISA conferences? and What factors are associated with attendance? Cross-national inequality in ISA participation is a lasting problem that the organization itself has promised to address, and that sociologists often refer to anecdotally and without systematic analyses. Our contribution is to illustrate empirically the extent to which such inequality exists, and to analyze its economic, political and social dimensions. We show that countries that have a low GDP contribute a disproportionately low share of participants at ISA conferences; this holds for whether participation is counted cumulatively, or for specific events.
The economic resources of a country are not the sole determinant of how many participants attend ISA events. We find empirical support for the hypotheses that stronger democracies have stronger representation at ISA conferences, and that countries characterized by a stronger social science research infrastructure fare better with regard to attendance, ceteris paribus. We also find that countries within the same continent as the country where the conference is held send more representatives than countries outside the continent, net of other factors. Our interpretation is that the variable of events’ location captures aspects of both physical and cultural proximity.
The issue of location prompts a comment: research on individual motivations, inhibitors and facilitators of attending international conferences suggests that sightseeing motivates attendance (Rittichainuwat et al., 2001). This could well be the case for ISA events as well. Currently, there are no individual-level data to examine this aspect, nor other factors related to personal decision-making.
Through rigorous, cross-national quantitative analysis of country representation at ISA conferences, we seek to contribute to the ongoing debates on the inequalities that characterize the internationalization and globalization of the social sciences, and of inequalities in general within the WSS. Our article adds to the discussion of inequality in the WSS in general, and the ISA in particular, by revealing longstanding inequalities in a major form of scientific dissemination and of knowledge access, that of scholarly attendance of ISA conferences. We seek to expand knowledge and increase awareness of unequal country representation within the social sciences – such as the International Institute of Sociology and the International Political Science Association – and provide a template for analogous analyses of data pertaining to other disciplines than sociology.
We do not suggest that ISA purposively excludes sociologists from certain countries. On the contrary, the history of the organization shows clearly that ISA has always been aware of the unequal representation of scholars at ISA events and has sought ways to address this problem. Our analyses reveal a meaningful decrease of representation inequality according to the countries’ income over the 20 years spanning 1990 to 2010. Yet, a durable inequality remains, one that ISA and other key actors in the WSS of the social sciences should continue to acknowledge, and with which it must contend.
Footnotes
Appendix
Mean number of participants in ISA events for control variables.
| Mean number of participants per country |
|||
|---|---|---|---|
| All countries | Countries with GDP > median | Countries with GDP ⩽ median | |
| Control variables | |||
| Population, pop, measured in millions | |||
| Pop > median | 25.5 | 39.0 | 3.5 |
| Pop ⩽ median | 3.7 | 6.5 | 0.6 |
| Tertiary education, TE, enrollment per 100,000 | |||
| TE > median | 20.9 | 29.3 | 1.3 |
| TE ⩽ median | 4.6 | 8.8 | 2.9 |
| Location on same continent as ISA event, LO, yes/no | |||
| LO = yes | 43.1 | 54.8 | 2.0 |
| LO = no | 10.9 | 18.1 | 2.0 |
Acknowledgements
Authors are listed in alphabetical order: they have contributed equally to this article.
Most of the research was conducted at the Institute of Philosophy and Sociology, Polish Academy of Sciences, and CONSIRT, the Ohio State University and the Polish Academy of Sciences. We thank Izabela Barlinska, Executive Secretary of the International Sociological Association (ISA), for providing the data on ISA conference attendance and membership by country. We are grateful for the insightful comments of the members of both CONSIRT and the Laboratory for Comparative Social Research (LCSR), Higher School of Economics, Russia. LCSR provided resources for us to present this research there on two occasions and strongly encouraged its development. At LCSR, we are grateful for detailed comments from Ronald Inglehart, Chris Welzel, Peter Schmidt, Bogdan Voicu, Nicolas Griesshaber and Eduard Ponarin. We also thank Malgorzata Mikucka, Francesco Sarracino and Tadeusz K Krauze for their advice, and Margaret Abraham for her encouragement to pursue this study. Our thanks also go to three anonymous reviewers, whose comments strengthened this paper.
Funding
This research received no specific grant from any funding agency in the public, commercial, or not-for-profit sectors.
Notes
Author biographies
 ), funded by Poland’s National Science Center. His recent publications include articles published in Party Politics, Electoral Studies, International Journal of Sociology, Journal of Urban Affairs and Perspectives on European Politics and Societies.