
Abstract
Throughout the late 2000s and early 2010s most state and large local education agencies in the United States implemented next-generation teacher evaluation systems (National Council on Teacher Quality, 2019a; Steinberg & Donaldson, 2016), which introduced many changes to teacher observations and tended to incorporate revised teacher performance measures and student growth as a measure of teacher effectiveness (Steinberg & Donaldson, 2016; Walsh et al., 2017). Although some education agencies have moved away from measuring teacher effectiveness in terms of student outcomes, most retained changes to teacher observations including the (a) use of standard-based observation protocols, (b) assignment of more frequent teacher observations, and (c) implementation of structured feedback conferences as these observational processes are theoretically well-suited for improving teaching and student learning (Donaldson & Papay, 2014; Hill & Grossman, 2013; Steinberg & Donaldson, 2016).
Increasingly, education scholars are investigating the scope and degree of changes to evaluation and observations, and how educators implemented evaluation systems (Donaldson & Woulfin, 2018; Kraft & Gilmour, 2016; Lane, 2020; Marsh et al., 2017). This research was partially motivated by the need to better understand whether the implementation of next-generation systems ultimately improved student achievement (Lane, 2020; Lavigne & Olson, 2019; Reinhorn et al., 2017). Although links between the implementation of next-generation observations and student misbehavior have received much less attention, there is also reason to suspect that such links exist. Several of the rubrics used within next-generation systems (e.g., Danielson’s Framework for Teaching), including the rubric in this study, measured teaching behaviors related to classroom management. Teachers with low observation scores in the classroom management domain plausibly received feedback to improve this aspect of teaching. Exploring the associations between observations and the number of office referrals each student received, a proxy measure for student misbehavior, helps assess the links between teacher observations and student disciplinary offenses.
Despite the potential of next-generation observations to improve student outcomes, the many changes introduced by these systems, especially the administrative burdens introduced by changes to teacher observations, raised concerns among practitioners and policy makers about the extent to which school administrators could implement these systems effectively (Kraft & Gilmour, 2016; Reinhorn et al., 2017). Small-scale studies find that administrators devote more time to next-generation teacher evaluations than previous-generation systems and report that new systems are much more onerous (Neumerski, 2013; Rigby, 2015). Without additional time in administrators’ daily schedules, these new demands might have inhibited other schooling processes and increased administrator stress and burnout (Donaldson & Woulfin, 2018; Kraft & Gilmour, 2016; Neumerski, 2013; Rigby, 2015). Indeed, school administrators coped with the demands of next-generation systems by exercising discretion in the implementation of teacher evaluations (Donaldson & Woulfin, 2018; Kraft & Gilmour, 2016; Marsh et al., 2017; Rigby, 2015). Some school administrators conducted fewer observations than the number assigned by policy, while other administrators supplemented policy-assigned tasks with their own procedures (Donaldson & Woulfin, 2018; Kraft & Gilmour, 2016; Marsh et al., 2017).
Previous studies have implied that the discretionary reduction of observational duties impeded teacher and student development, while the discretionary supplementation of practices might have improved teacher and student outcomes (Donaldson & Woulfin, 2018; Kraft & Gilmour, 2016). Other scholars have hypothesized that, in general, the discretionary implementation of teacher evaluation by school administrators occurred for good reasons, otherwise school administrators would not exercise discretion (e.g., Darling-Hammond et al., 1983). However, we are unaware of any study linking school administrator discretion in the implementation of next-generation teacher evaluations or observations to teacher or student outcomes, although previous studies examining the implementation of next-generation teacher evaluation call for exploring these linkages (Donaldson & Woulfin, 2018; Lavigne & Olson, 2019; Marsh et al., 2017).
Our study was motivated by previous work. For example, Lavigne and Olson (2019) argue that “[r]esearch is just now turning to better understand the experiences of the individuals who are responsible for implementing these new teacher evaluation models—principals” (p. 575). They added that “principals make important adaptations to teacher evaluation policy which may be function of their capacity (time being a particularly salient variable), their beliefs and values (their preference for observational data), and context” (p. 590), but it is unclear how the adaptations influence teacher evaluation, professional development, and ultimately student achievement. Donaldson and Woulfin (2018) also stressed the need for research for linking discretion and student outcomes. Cohen et al. (2020) also argue that we do not fully understand how principals use discretion and how that discretion is linked to student outcomes. The primary purposes of the present study were to explore the determinants of one form of administrator discretion in the implementation of teacher observations and to link the examined type of discretion to subsequent student outcomes.
Our study contributed to the literature concerning the implementation of teacher evaluation systems in three ways. In our study context, policy assigned teachers some number of observations based on their prior-year performance and “certification” status, both of which we observed. However, some administrators applied discretion by issuing teachers more observations than assigned by policy, while other teachers received less. We characterized this form of administrator discretion as “discretionary observations.” An exploratory analysis linked several baseline student and teacher characteristics to the number of discretionary observations teachers received, revealing which characteristics predicted the number of discretionary observations teachers received. We also estimated associations between average student outcomes and discretionary observations. As a secondary contribution, we also examined the sensitivity of the latter associations to the control of student and teacher observable characteristics and school-by-year and teacher unobservable characteristics. Specifically, this study answered three research questions. Which predictors explained variation in the number of discretionary observations a teacher received? To what extent were there changes in the reading and math scores of students taught by teachers who received fewer or more observations than the number of observations assigned by policy? To what extent were there changes in the number of office referrals for students taught by teachers who received fewer or more observations than the number of observations assigned by policy?
Literature Review
Researchers have argued that employee evaluation serves two broad purposes: personnel decision making and employee development (Darling-Hammond et al., 1983; Donaldson & Papay, 2014), with prioritization on the latter from education agencies and school administrators (Almy, 2011; Donaldson & Woulfin, 2018). Furthermore, scholars have argued that teacher observations are well-suited for development (e.g., Kane et al., 2011), especially when post-observation performance feedback informs teacher professional learning plans, with the ultimate goal of improving student outcomes (Marsh et al., 2017; Odden & Kelly, 2008).
Next-Generation Teacher Observation Systems
In broad terms, the theory of action framing next-generation teacher observation systems asserted that the receipt of formal observations and post-observation feedback would improve teaching and ultimately student achievement (Putman et al., 2018; Steinberg & Donaldson, 2016). Organizational psychologists have argued that performance feedback allows employees to judge their performance against performance standards; when performance is below expectations, the employee would try to close the gap through more effort or professional development unless she believes the gap is too large to overcome (Carver & Scheier, 1982).
Findings from previous studies implied that observation systems needed to establish teacher performance standards and provide opportunities for teachers to close performance gaps (Carver & Scheier, 1982; Steinberg & Donaldson, 2016). Designers of next-generation teacher observation systems acted on this by (a) increasing the number of formal observations per year, (b) adopting standard-based observation rubrics, (c) including structured performance feedback conferences in the observation process, and (d) providing teachers with several opportunities for improvement and feedback via frequent observations (National Council on Teacher Quality, 2019a, 2019b; Putman et al., 2018; Steinberg & Donaldson, 2016).
Standard-based observation rubrics described teaching behaviors (e.g., questioning, student grouping) in terms of performance standards that research positively linked to higher student achievement (e.g., Daley & Kim, 2010; Danielson Group, n.d.; Kane et al., 2011). State and local education leaders expected school administrators to use standard-based rubrics to identify gaps between teacher performance and expectations (Odden & Kelly, 2008) and share performance-enhancing feedback with teachers in structured post-observation conferences (Kraft & Gilmour, 2016; National Council on Teacher Quality, 2019b; Steinberg & Donaldson, 2016). These rubrics tended to be longer and more complex than prior-generation rubrics, adding to the administrative burdens of teacher observations (Steinberg & Donaldson, 2016).
Although little, if any, research linked higher levels of teacher performance on standard-based rubrics to reductions in student disciplinary offenses, this relationship is plausible if the observation rubric includes teaching tasks that are conceptually related to student discipline, as did the observation rubric used in this study. Research on teacher professional development and student misbehavior suggests that specialized teacher training on classroom behavior management can reduce incidents of disciplinary offenses (Gregory et al., 2016). If more frequent and detailed teacher evaluations serve as opportunities for teacher professional learning, it is plausible that evaluators might reduce student disciplinary offenses. We assess this theoretical link using the number of office referrals received by each student. As prior work finds that office referrals are prone to reporting biases based on student race and other student and teacher characteristics, office referrals are imperfect measures of student misbehavior (Anderson et al., 2019; Gregory et al., 2016). Nonetheless, our measure helps assess the link between observations and student misbehavior.
Implementation of Next-Generation Teacher Observation Systems
Several studies have explored the implementation of next-generation teacher evaluation systems and found that observing teachers in these systems was a heavy administrative burden (Donaldson & Woulfin, 2018; Kraft & Gilmour, 2016; Marsh et al., 2017; Reinhorn et al., 2017; Rigby, 2015). Relative to the expectations set forth by these new systems, researchers found that administrators conducted fewer observations of shorter duration and held brief post-observation conferences (Kraft & Gilmour, 2016). Some researchers implied that student achievement would suffer when school administrators conducted fewer observations than assigned by policy (Donaldson & Woulfin, 2018; Kraft & Gilmour, 2016) and hypothesized that more observations than assigned by state policy might benefit students (e.g., Donaldson & Woulfin, 2018).
Other researchers have implied that strict compliance with teacher evaluation policies may hamper the effectiveness of observations as tools for teacher and student improvement (Murphy et al., 2013), because school administrators are more cognizant of teacher observational needs (Darling-Hammond et al., 1983; Odden & Kelly, 2008). For example, an administrator may have knowledge that a teacher’s prior-year poor performance was atypical or unreflective of current performance. In this case, the principal may exercise discretion and decide to reduce observations, anticipating that the teacher’s performance would not suffer.
Theoretical Correlates of Discretionary Observations
Little research documents the characteristics of teachers who receive discretionary observations, though some work implies that administrators may consider if discretionary observations would develop teaching and teacher performance as measured in next-generation evaluation systems (Donaldson & Woulfin, 2018; Reinhorn et al., 2017). We assumed that administrators considered teaching and teacher performance in terms of teacher observation scores and student achievement scores. Our analysis exploring the predictors of discretionary observations used predictors that prior work links to teacher observation scores: teacher (a) gender and (b) race/ethnicity; and student (c) gender, (d) race/ethnicity, and (e) prior achievement scores (Campbell & Ronfeldt, 2018; Steinberg & Garrett, 2016), (f) years of experience, (g) education levels, (h) measures of their prior-year performance (Jacob & Walsh, 2011; Kraft et al., 2020); and student (i) special education (SPED), (j) free or reduced-price lunch (FRPL), and (k) English as a second language (ESL) status (Campbell & Ronfeldt, 2018; Steinberg & Garrett, 2016).
When treating discretionary observations as an independent variable and student outcomes as dependent variables we applied (a) to (k) as control variables for two reasons. First, we wanted to use the same set of predictors across analyses, and associations detected during the exploratory analysis treating discretionary observations as a dependent variable underscored the need to control for these variables when treating discretionary observations as the independent variable. Second, models estimating relationships between student outcomes (i.e., achievement scores, office referrals) and some input (i.e., observations) fall within the family of education production functions, which conventionally control for characteristics like (a) to (k) to reduce standard errors and control for plausibly confounding variation (McCaffrey et al., 2003).
Study Context
Tennessee Observation System: A Next-Generation Teacher Observation System
This study used data from academic years 2012-13 through 2014-15 from more than 80% of Tennessee districts. In the early 2010s, Tennessee policy makers adopted a next-generation teacher observation system, the Tennessee Educator Acceleration Model (TEAM). 1 The TEAM theory of action resembled other next-generation systems in that observers were expected to use a standard-based rubric and share post-observation feedback in structured conferences following each formal observation (Steinberg & Donaldson, 2016; Teacher and Principal Evaluation Policy, 2013). All observers were (re)certified annually through a certification exam, which assessed the accuracy of performance ratings and observer knowledge of the broader evaluation system (Alexander, 2016; Teacher and Principal Evaluation Policy, 2013). New observers attended up to 4 days of summer training and were required to pass a certification exam (Alexander, 2016).
The Tennessee Department of Education (TDOE) asserted that observational processes would improve teacher performance and ultimately student achievement, provided that post-observation feedback was: (a) based on the standard-based rubric, (b) provided during structured post-observation conferences, and (c) received by the teacher within 1 week of the observation (Teacher and Principal Evaluation Policy, 2013).
The Determinants of Tennessee Teacher Observations
Each year, every Tennessee teacher was assigned at least one formal observation. The number of formal observations received was a function of two broad determinants: policy and school administrator discretion. At the beginning of each school year, state policy assigned teachers some number of observations based on the teacher’s prior-year “level of effectiveness” (LOE) and their current-year “certification” status (Teacher and Principal Evaluation Policy, 2013), which was effectively a function of years of experience. LOE was integer-scaled from 1 to 5 and determined by teacher observation, growth, and achievement scores. The growth score for all teachers of tested subjects was based on their Tennessee Value-Added Assessment System (TVAAS) score. Other student outcomes determined the growth scores for teachers of nontested subjects. Grade- or school- or district-wide student outcomes (e.g., ACT scores, high school graduation) determined achievement scores. State policy-assigned teachers with a prior-year LOE1 a minimum of four observations, and teachers with a prior-year LOE5 at least one. The number of observations assigned to teachers between LOE1 and LOE5 depended on their contemporaneous certification status. “Apprentices,” or early-career, teachers (i.e., fewer than 4 years of experience) with a prior-year LOE2 to LOE4 were assigned four observations by state policy. “Professionals,” or career, teachers (i.e., 4 or more years of experience) with a prior-year LOE2 to LOE4 were assigned two observations.
Collective Bargaining and Teacher Tenure
Tennessee state policy allows local education agencies to add to the number of observations assigned by state policies, but no district may assign less than the state-assigned number (Teacher and Principal Evaluation Policy, 2013). Local education agencies may add to the minima without consulting collective bargaining units (Teacher and Principal Evaluation Policy, 2013).
Tennessee’s TEAM system also introduced ostensibly meaningful teacher tenure reforms (Rodriguez et al., 2020). Under the TEAM system, teachers can lose tenure after receiving two consecutive years of LOE1 or LOE2 scores (Teacher and Principal Evaluation Policy, 2013). There is little empirical evidence that the average school administrator took advantage of TEAM tenure reforms to dismiss less-effective teachers; to the extent TEAM tenure reforms increased teacher dismissal, the effects were concentrated among urban districts (Rodriguez et al., 2020).
If collective bargaining units in some Tennessee districts find ways to influence teacher observation policy and student outcomes, or if between-district responses to tenure reforms correlated with between-district observation policy and the correlates we examined, this may introduce bias in models estimating relationships between discretionary observations and student outcomes. We address this between-district concern in the Analytic Strategy section.
Data and Sample
The TDOE collected student and teacher demographics and several measures of teacher human capital during the study period, which we obtained by submitting a research proposal and data request to the Tennessee Education Research Alliance. TDOE administrative data were well-suited for our analysis because the TEAM system had clear policy rules assigning teachers observations based on determinants observable in the data. Additionally, TDOE data included detailed information on teacher observations, linking teachers to their observation dates, 2 allowing for the calculation of formal observations received by each teacher. The ability to calculate the total number of observations received and identify the number of policy-assigned observations was critical as the difference between these two quantities represented the variable of primary interest, what we characterized as discretionary observations. TDOE collected information about teacher demographics, quality, and performance. We operationalized gender as female (female = 1; male = 0) and race as non-White (non-White = 1; White = 0). All in-sample teachers received observation, TVAAS, and LOE scores. Measures of teacher quality included years of experience and highest degree earned, which we operationalized as a BA+ (teacher held more than a bachelor’s degree = 1; bachelor’s only = 0).
Student demographic data included measures of race/ethnicity, gender, FRPL, and status as an ESL and SPED student. The TDOE collected end-of-year student achievement scores from students in grades 3 to 8, and end-of-course scores for students in Algebra 1 and 2, and English 1, 2, and 3. All achievement scores were standardized by grade/subject-by-year. Unique identifiers allowed for the linkage of students and teachers. Students in grades 4 to 12 were linked to their math and reading teachers, respectively, yielding an analytical sample of only math teachers and their students, and a separate sample of only reading teachers and their students.
TDOE also collected the number of office referrals for each student. Reported offenses included: profanity, property damage, truancy, and fighting. As prior work suggests that reported offenses are prone to different forms of bias, our measure is a proxy for the actual number of student disciplinary offenses (Anderson et al., 2019). Ideally, we would have linked the number of office referrals for each student to each reporting teacher, but the data did not allow such linkage. Instead, we observed the total number of reported offenses a student received in each school each year and, in one analysis, linked the student to their math teacher. In a second analysis, we linked students to their reading teacher. Linking students to their math or reading teacher, instead of the reporting teacher, may introduce measurement error, the implications of which we discuss in the Analytic Strategy section.
We converted all student-by-teacher-by-year data to teacher-by-year means or proportions, making teachers the unit of analysis. We found the proportion of a teachers’ total students by each student-race variable, and student FRPL, ESL, and SPED variables. Student achievement scores were converted to teacher-by-year means. We characterized all student-based measures in the analytical sample as representing a teacher’s “average student” as these measures were means or proportions. Variables were aggregated to the teacher-by-year level for two reasons. First, the outcome of interest in the first research question is at this level, and researchers have argued that predictors should be at the same level as the outcome, or higher (Snijders & Bosker, 1999). Second, our procedure avoided the need to cluster standard errors at the student level. 3
Sample and Population Descriptive Statistics
Table 1 presents the number of teachers who received some number of observations by prior-year effectiveness scores (LOE). Panels separate the distributions by career status because it was a determinant of policy-assigned observations. Most teachers (64% of early-career teachers and 67% of career teachers) received exactly the number of policy-assigned observations (see bold numbers). Table 1 also shows the number of teachers who received fewer or more observations than assigned by state policy, which we characterized as “reduced” and “supplementary” observations, respectively. The percentages of reduced and supplementary observations received varied by career status. Almost 20% of early-career teachers received a reduced number of observations (see italics). Among the early-career teachers who received reduced observations (see Panel A, Table 1), most received a prior-year LOE4, followed by teachers with LOE3, LOE2, and LOE1.
Number of Observations Received by Prior-Year Effectiveness.

Note. Teachers who received an italicized number of observations received fewer observations than assigned by state policy. Those teachers receiving a bold number of observations received exactly the number of observations assigned by state policy. Teachers who received a nonitalicized and nonbold number of observations received more observations than assigned by state policy. LOE = level of effectiveness.
Although 20% of early-career teachers received reduced observations, only 3% of career teachers received reduced observations. Relatively few career teachers might have received reduced observations because almost 100% of career teachers were assigned just one or two observations. 4 There was also a disparity between early-career and career teachers in their receipt of supplementary observations (see nonbold and nonitalics). Approximately 13% of early-career teachers and 30% of career teachers received supplementary observations. Among early-career teachers who received supplementary observations, most (44%) had an LOE5. Similarly, most (42%) career teachers with supplementary observations had a prior-year LOE5. However, the second largest concentrations of early-career teacher (22%) and career teachers (26%) who received supplementary observations had a prior-year LOE3 instead of LOE4. That the majority of supplementary observations were received by teachers with a prior-year LOE5 may have been a function of the observations assigned to these teachers. Administrators may have felt uneasy about basing the observation component of teacher effectiveness on a single observation. However, it is unclear why the second largest majority of teachers who received supplementary observations held a prior-year LOE3 instead of LOE4.
Subsequent regressions focus on reduced and supplementary observations, which we labeled as “discretionary observations.” We operationalized discretionary observations as the difference between the number of observations received by each teacher each year and the total number of observations assigned by state policy to each teacher each year. Teachers with zero discretionary observations received precisely the number of observations assigned by policy. However, all teachers receiving zero discretionary observations did not receive the same total number of observations. For example, the 997 early-career teachers with a prior-year LOE4 (see Panel A, Table 1) and the 7,790 career teachers with a prior-year LOE4 received zero discretionary observations, although the former was assigned four observations and the latter two. Teachers with negative discretionary observations received reduced observations, and teachers with positive discretionary observations received supplementary observations.
Table 2 displays information on the scope and quantity of our data, and sample and population descriptive statistics. The typical teacher in the Tennessee population was a White female in her early forties, held more than a bachelor’s degree, and taught just over 11 years. The mean observation and LOE scores were just below a score of 4 on integer scales ranging from 1 to 5. Most average students were White males eligible for FRPL. The last panel of Table 2 lists the average teacher prior-year measures of effectiveness and performance in a specific school in a specific year (i.e., school-by-year measures). Each school-by-year variable was measured on an integer scale ranging from 1 through 5. The typical teacher in the typical school scored between a 3 (meeting expectations) and a 4 (above expectations), with growth and observation scores at 3.5 and 3.9, respectively. There were no substantive differences between the sample and population regarding Tennessee teacher characteristics, but a higher proportion of students in the analytical sample were White, the typical average student in the analytical sample had approximately 0.07 more office referrals and math and reading scores that were 0.16 standard deviations lower.
Descriptive Statistics.

Note. Population characteristics. BA+ captures whether teachers holds more than a BA. LOE = level of effectiveness; FRPL = free or reduced-price lunch; ESL = English as a second language; SPED = special education; TVAAS = Tennessee Value-Added Assessment System.
Analytic Strategy
There were two broad sources of variation in the total number of observations teachers received: policy-assignment and school administrator discretion. As we were interested in the discretionary implementation of teacher observations, we removed state policy-induced variation by taking the difference between the total number of observations received and the number assigned by state policy. The variable
At this point,
Predictors of Discretionary Observations
We partially answered the first research question using the following equation:

where
We then explored if unobserved time-invariant teacher-level variation (π
i
) and unobserved school-by-year variation (
Unobserved school-by-year factors might also have influenced the number of discretionary observations teachers received. For example, average administrator observation skills and years of experience or school work norms may change over time and influence the provision of discretionary observations. School-by-year fixed effects captured all unobserved year-to-year variation at the school level. Equation 2 represented the teacher and school-by-year fixed effects model:

School-by-year fixed effects (
Linking Discretionary Observations to Average Student Outcomes
We used Equation 3 to answer Research Questions 2 and 3:
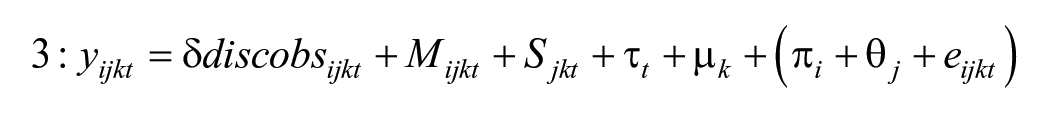
Where
As implied by previous discussions, when
δ represented the relationships of interest and captured the average change in
Findings
We begin with an overview of our major results. Out of the chosen discretionary observation predictors, prior-year observation scores, and prior-year LOE were the strongest. Although associations with prior-year LOE were nonlinear, we found that observers chose to observe teachers with higher prior-year observation scores more frequently among those sharing the same prior-year LOE score. Another key finding was that the evidence suggested unobserved teacher traits (i.e., teacher fixed effects) substantially explained why observers issued discretionary observations. When treating discretionary observations as the independent variable of interest, we found that the average student math and reading achievement scores increased when teachers received supplementary observations relative to years when they received the number assigned by policy. Importantly, we found no relationships between the receipt of reduced observations and average student achievement scores. Finally, the receipt of supplementary or reduced observations was not associated with average student office referrals.
Predictors of Discretionary Observations: Research Question 1
In Equation 1, two teacher demographic measures predicted discretionary observations (see Table 3). Teachers with more than a bachelor’s were predicted to receive 0.03 more discretionary observations, holding other observables constant. Similarly, an increase of 1 SD in years of experience (~ 9 years) was predicted to increase discretionary observations by 0.04 after controlling for the observables.
Predicting Discretionary Observations.
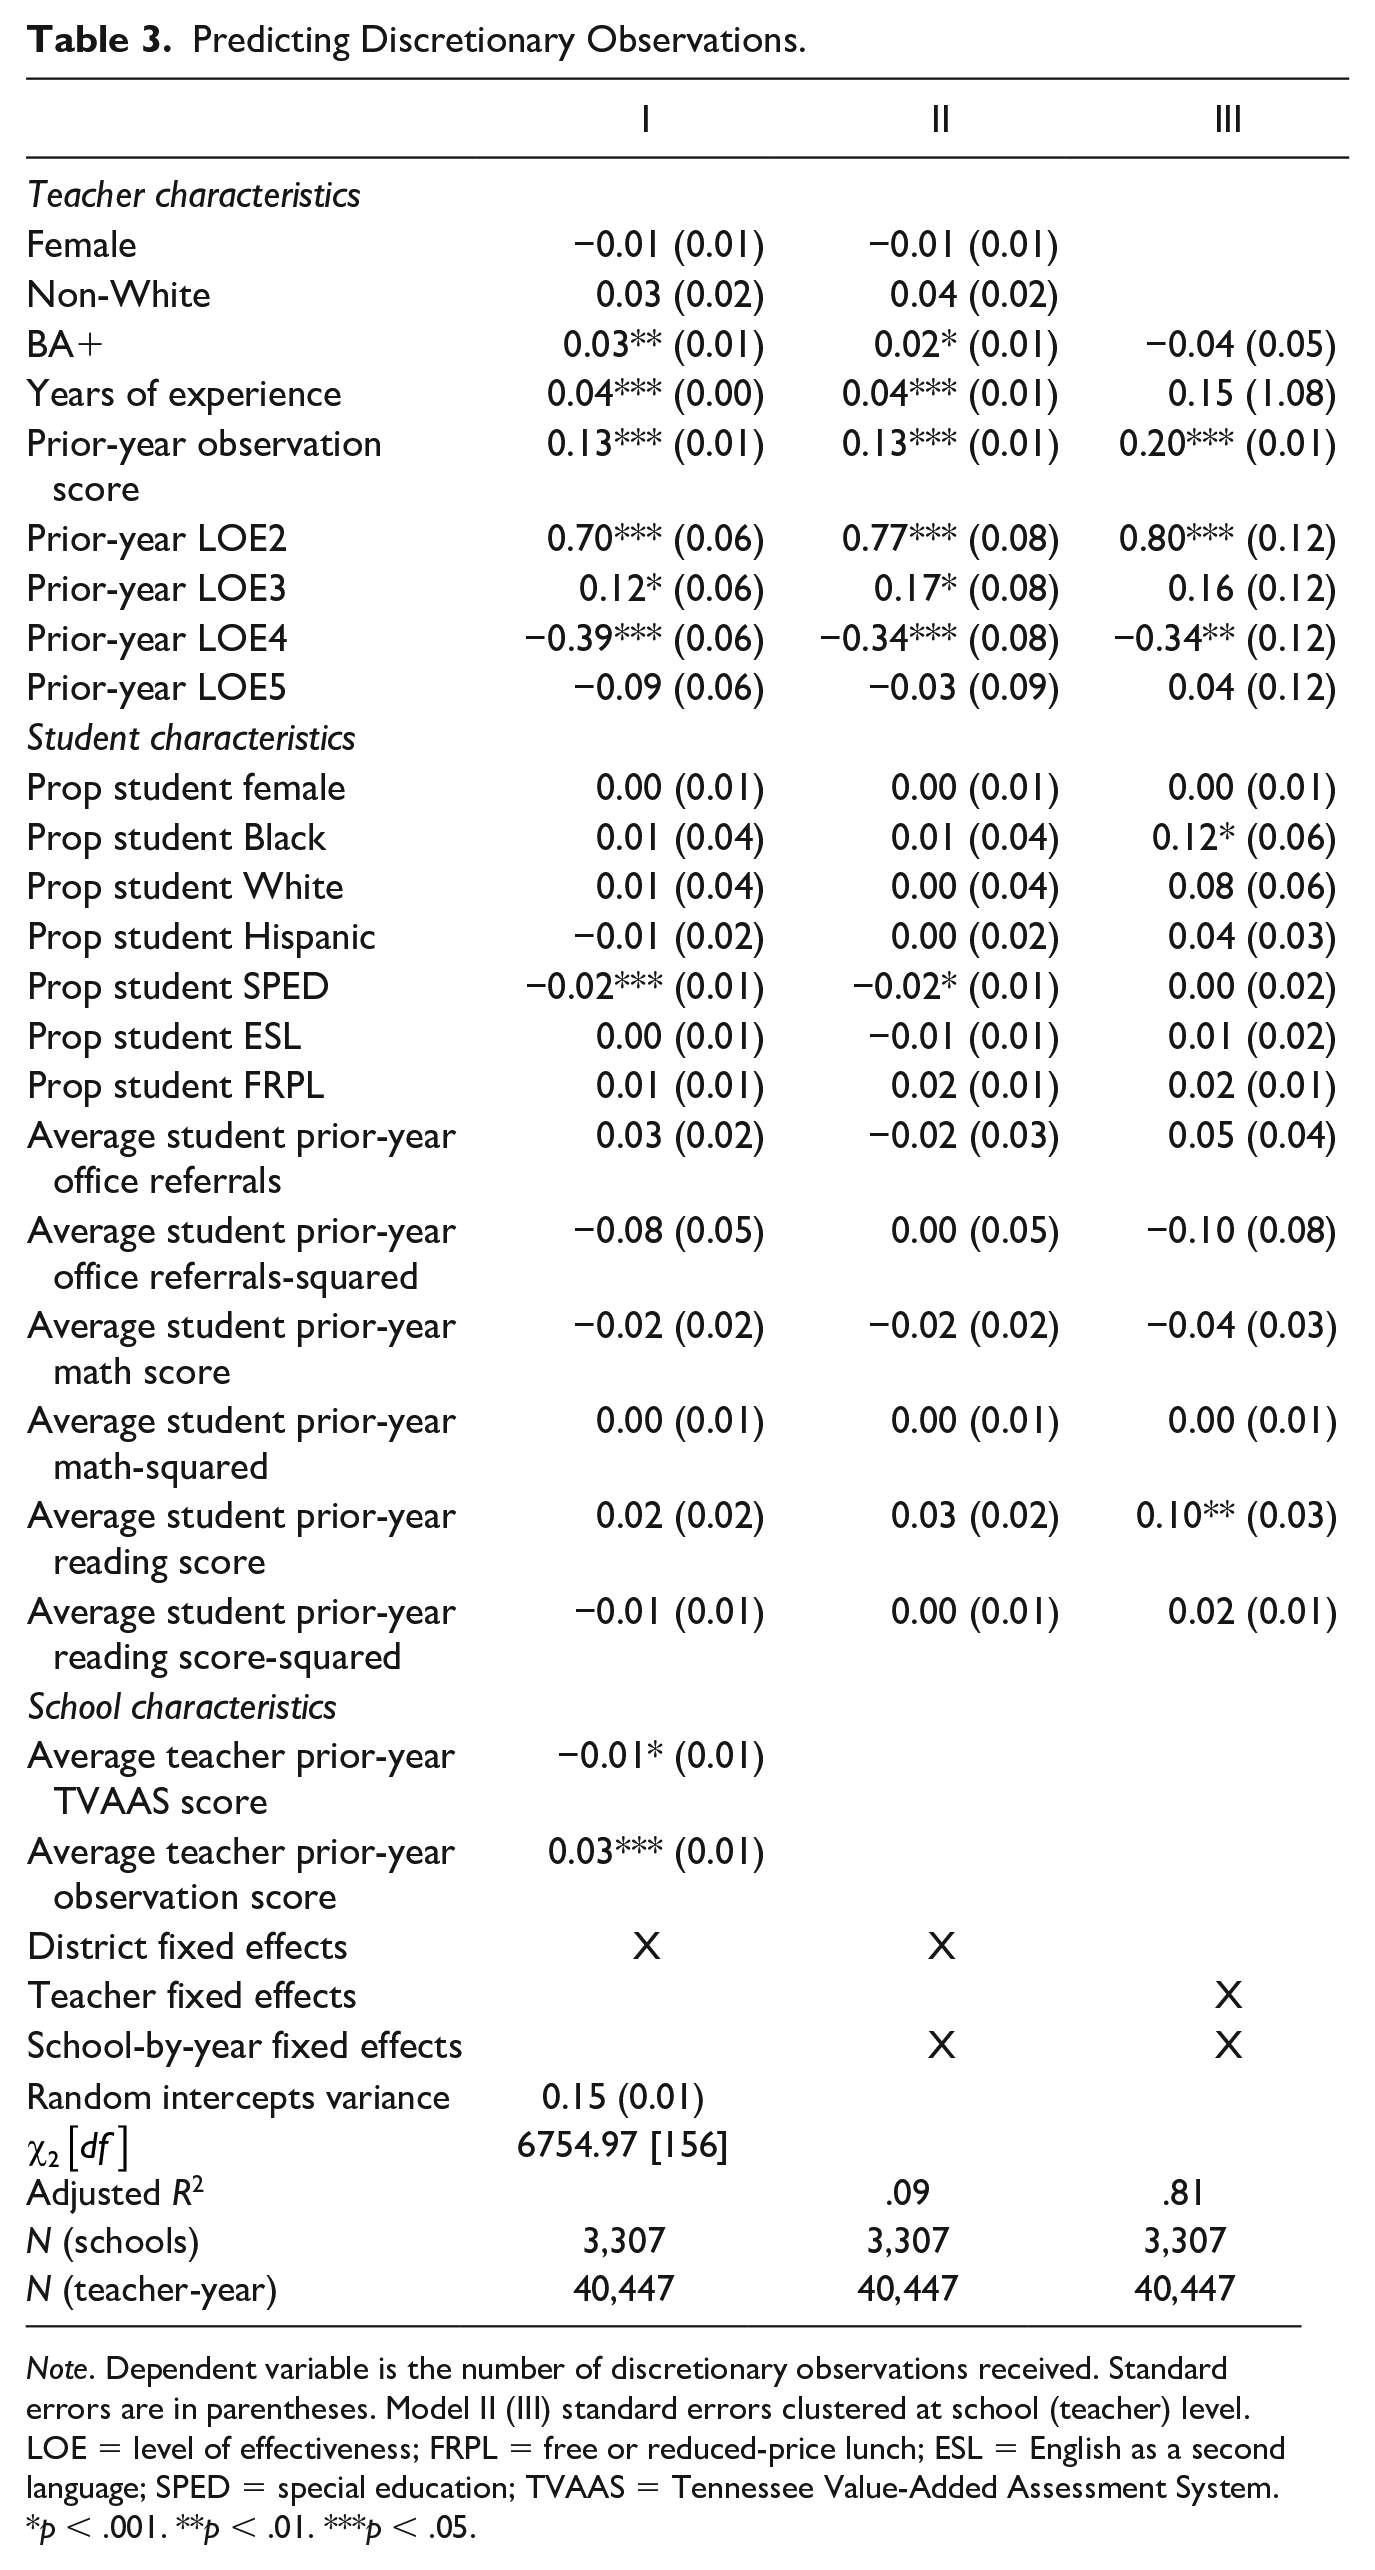
Note. Dependent variable is the number of discretionary observations received. Standard errors are in parentheses. Model II (III) standard errors clustered at school (teacher) level. LOE = level of effectiveness; FRPL = free or reduced-price lunch; ESL = English as a second language; SPED = special education; TVAAS = Tennessee Value-Added Assessment System.
p < .001. **p < .01. ***p < .05.
Out of the chosen discretionary observation predictors, measures of teacher performance and effectiveness were strongest (see column I). A 1 SD increase in teacher prior-year observation scores was associated with an increase of 0.13 discretionary observations, ceteris paribus. Figure 1 represented the relationships between all prior-year LOE and predicted discretionary observations after holding all other right-hand side variables at their means. Results in Figure 1 showed that the relationship between prior-year LOE and discretionary observations was not monotonic. LOE2 teachers were predicted to receive the most discretionary observations, while LOE4 teachers were predicted to receive the least, and the predicted number of discretionary observations associated with LOE1, LOE3, and LOE5 teachers were similar. Nonetheless, differences between adjacent LOE were among the most substantial relationships estimated by Equation 1. The differences between LOE2 − LOE1, LOE3 − LOE2, LOE4 − LOE3, and LOE5 − LOE4 were, respectively, 0.70, −0.58, −0.51, and 0.30.
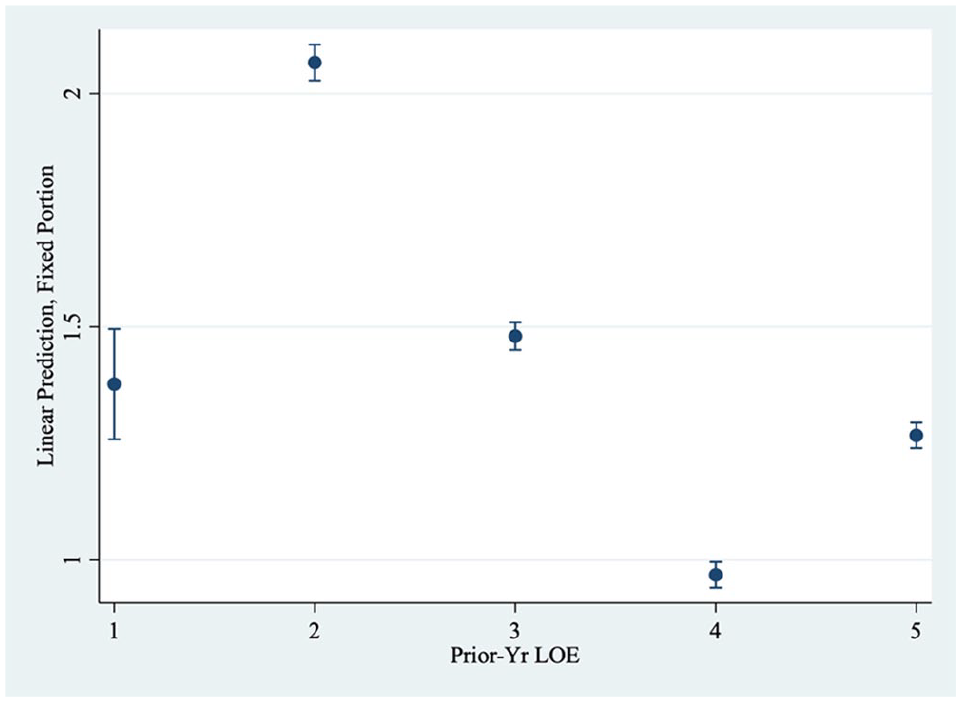
Note. Adjusted predictions of prior-year teacher LOE. DV = discretionary observations; LOE = level of effectiveness.
The only average student characteristic predicting discretionary observations was SPED status (see Table 3, column I). A 1 SD increase in the proportion of a teacher’s students who were SPED was predicted to decrease discretionary observations by 0.02, ceteris paribus.
Both average teacher prior-year TVAAS and observation scores predicted discretionary observations (see Table 3, column I). A 1 SD increase in average teacher prior-year TVAAS was predicted to decrease discretionary observations by 0.01, ceteris paribus. However, a 1 SD increase in teacher prior-year observation scores was predicted to increase discretionary observations by 0.03, holding other observables constant. The model in column I accounted for approximately 42% of the variation in

We found that differences between each school each year explained none of the associations in Equation 1 as adding school-by-year fixed effects to our model did not cause any substantial changes in the associations between columns I and II. Prior-year observation scores and LOE remained the two strongest determinants of discretionary observations (see column II), and the coefficients on these variables remained relatively stable from column I. The predicted values of
Teacher traits explained some of the previously discussed associations and controlling for teacher traits via teacher fixed effects introduced some new significant associations (column III, Table 3). Previous associations with teacher education level, years of experience, and average student SPED status disappeared after adding teacher fixed effects. The relationship with prior-year observation scores increased to 0.20 while the magnitude of most LOE coefficients remained relatively unchanged. Comparing a teacher with herself over time using teacher fixed effects revealed a positive association with the proportion of her students who were Black and that a rise of 1 SD in average student prior-year reading achievement scores was associated with a rise of 0.10 discretionary observations. Predicted values of
Changes in Average Student Achievement, Office Referrals: Research Questions 2 and 3
When treating discretionary observations as the independent variable of interest, findings from the naïve version of Equation 3 show that reduced observations negatively associated with average student math scores and supplementary observations had a near-zero null relationship with average student math scores (column I, Table 4). In this model, the average student math score of teachers receiving reduced observations was predicted to decline by 0.08 (p < .001) relative to teachers in the same district that received no discretionary observations. The receipt of supplementary observations relative to no discretionary observations was effectively unrelated to the outcome.
Discretionary Observations and Subsequent Average Student Achievement Scores.
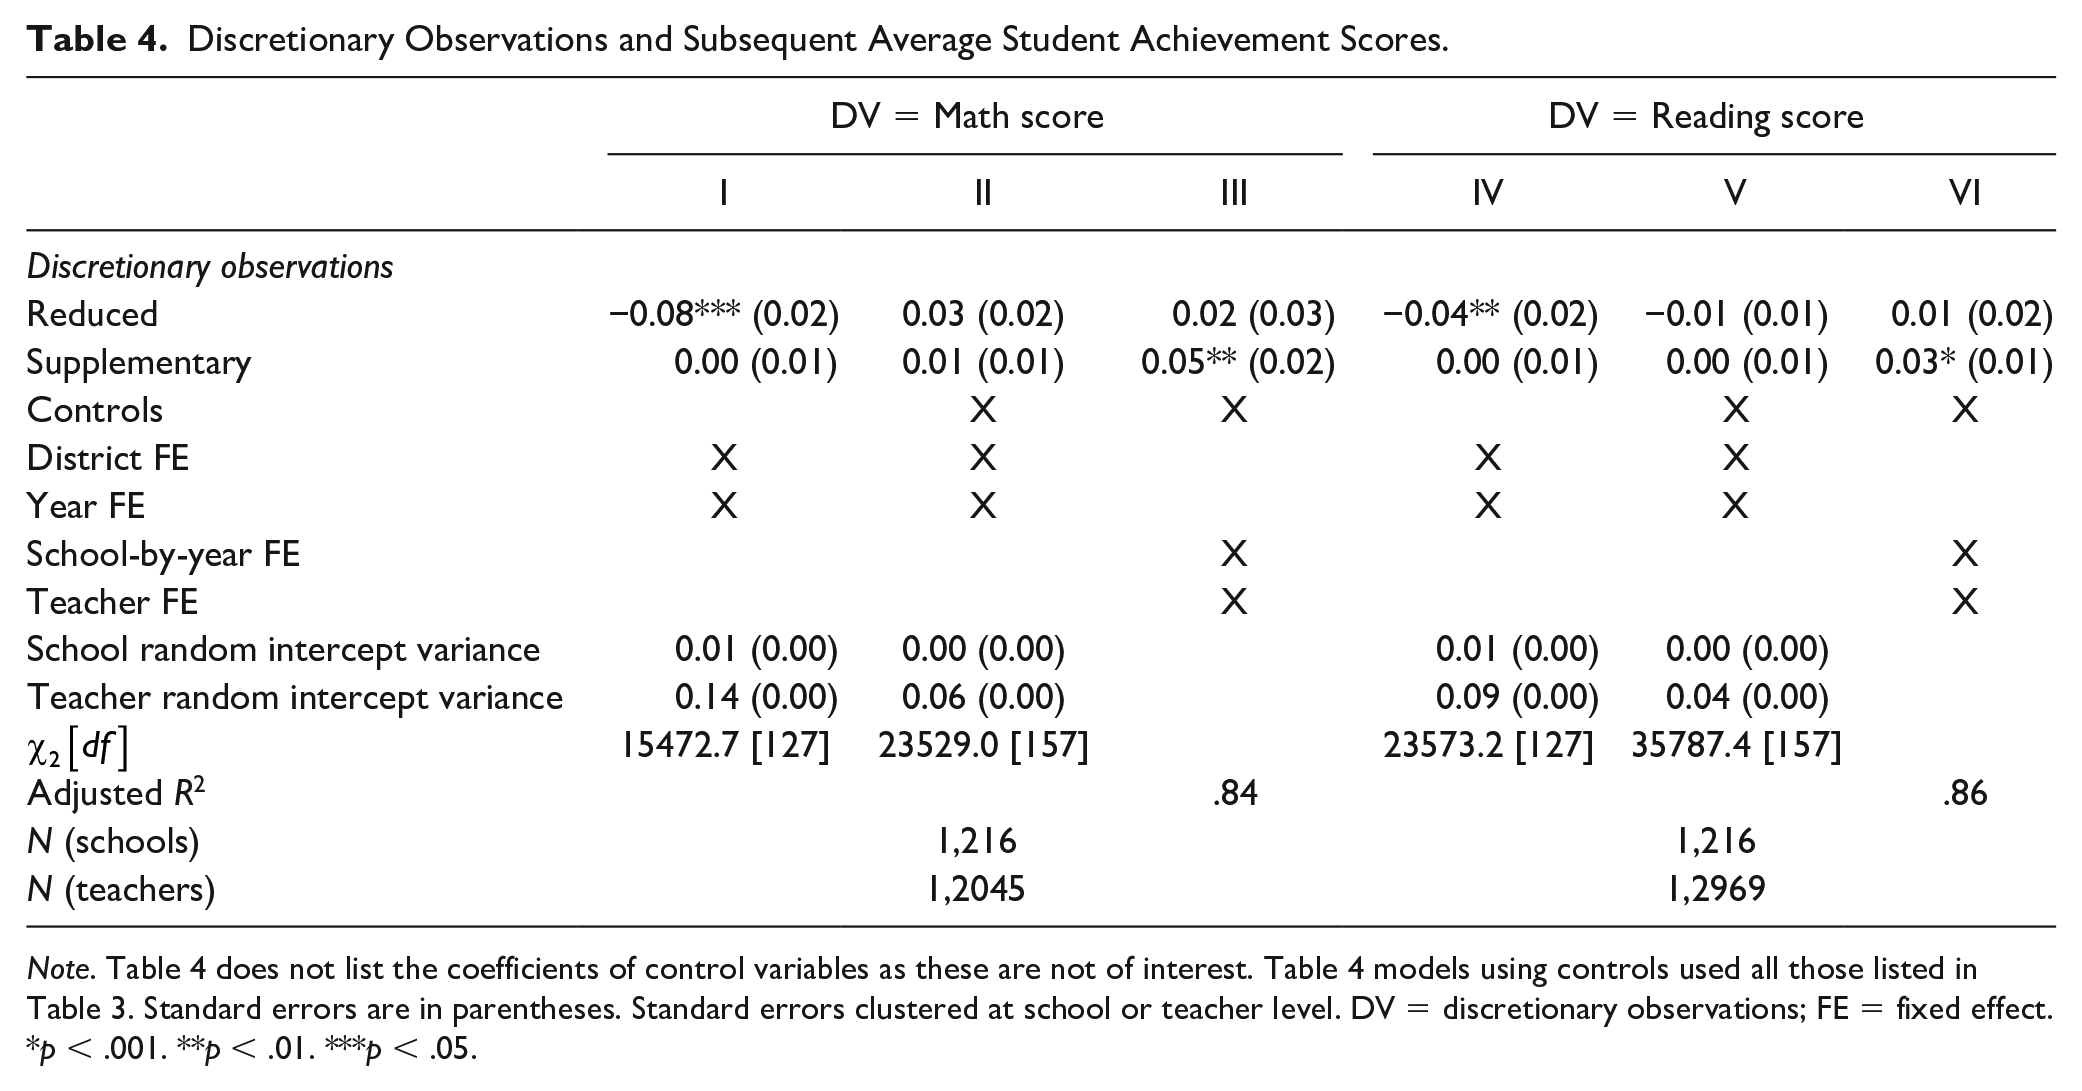
Note. Table 4 does not list the coefficients of control variables as these are not of interest. Table 4 models using controls used all those listed in Table 3. Standard errors are in parentheses. Standard errors clustered at school or teacher level. DV = discretionary observations; FE = fixed effect.
p < .001. **p < .01. ***p < .05.
Adding control variables to the equation changed the magnitude and direction of the original reduced-observation estimate substantially but left the original supplementary estimate relatively unchanged (column II, Table 4). Differences in the average student math achievement scores of teachers who received reduced or supplementary observations were both statistically insignificant and near-zero.
Comparing a teacher with herself while also controlling for differences between each school each year (i.e., teacher fixed effects and school-by-year fixed effects) revealed a new positive association with supplementary observations, but no relationship with reduced observations. The association between supplementary observations and average student math achievement scores went from 0.01 to 0.05 and the association became statistically significant (p < .01), while the null relationship with reduced observations from column II remained relatively unchanged.
Findings concerning average student reading scores resembled patterns with average student math scores. Column IV of Table 4 lists associations produced by the naïve model; the receipt of reduced observations relative to no discretionary observations was negatively associated with average student reading scores (−0.04, p < .01) among teachers in the same district, while supplementary observations were unrelated to the outcome. Column V lists associations produced by the version of Equation 3 controlling for observable characteristics. Control variables attenuated the negative estimate for reduced observations and left the association with supplementary observations unchanged as neither estimate in column V was statistically significant. Estimates in column VI were produced by the model controlling for school-by-year and teacher fixed effects, which increased the estimates further. Average student reading achievement scores did not significantly change with reduced observations relative to no discretionary observations, but the receipt of supplementary observations relative to no discretionary observations was positively associated with average student reading achievement scores (0.03, p < .05). None of the associations between average student office referrals and reduced or supplementary observations were statistically significant and most were near-zero (Table 5).
Discretionary Observations and Subsequent Average Student Office Referrals.

Note. Table 5 does not list the coefficients of control variables as these are not of interest. Table 5 models using controls used all those listed in Table 3. Standard errors in parentheses. Standard errors clustered at school or teacher level. FE = fixed effect.
p < .001. **p < .01. ***p < .05.
Discussion
We discuss our major findings concerning the strongest predictors of discretionary observations, overall explanatory variation in models describing discretionary observations, and associations between average student outcomes and supplementary or reduced observations.
Predictors of Discretionary Observations: Research Question 1
The number of discretionary observations teachers received was most affected by teacher prior-year observation scores and prior-year effectiveness. To our knowledge, no large-scale quantitative research has established these links, nor linked discretionary observations to any other predictors. As all models controlled for prior-year effectiveness scores, the positive associations with prior-year observation scores effectively meant that teachers with higher prior-year observation scores but the same prior-year effectiveness scores received more discretionary observations. The relationship between prior-year effectiveness and discretionary observations was complicated.
We speculate that school administrator preferences regarding the total number of observations a teacher should receive may explain why prior-year LOE1 and LOE5 teachers were predicted to receive about 1.4 and 1.25 discretionary observations, respectively. Teachers with a prior-year LOE5 were assigned only one observation by state policy. School administrators may have believed one formal observation would be insufficient for teacher development or personnel decision making and decided to conduct at least two formal observations of these teachers (i.e., 1 policy assigned + 1.25 discretionary). Presumably, school administrators also had preferences about the total number of observations a LOE1 teacher should receive. Prior-year LOE1 teachers were predicted to receive, on average, about 5.4 total observations (i.e., 4 policy assigned + 1.4 discretionary). If prior-year LOE1 teachers received anything more than two supplementary observations, this would bring the total to more than six observations for the typical LOE1 teacher, which might have been too burdensome for the typical school administrator. Although state policy assigns Tennessee teachers with lower prior-year effectiveness scores a relatively high number of observations, observers may believe that these teachers need even more observations for developmental purposes, a sentiment found in prior work (Donaldson & Woulfin, 2018). Alternatively, administrators wishing to dismiss the least effective teachers may conduct supplementary observations to gather more evidence to support dismissal.
The approximate opposite directions of the mostly negative prior-year effectiveness (LOE) association and positive prior-year observation score association is counterintuitive (see Table 3). At face value, one might expect school administrators to interpret measures of teacher effectiveness and performance similarly. However, school administrators may choose to observe teachers with higher observation scores more frequently because it is a productive use of their time; higher performing teachers may be more receptive to observations and administrator feedback. Indeed, research suggests that performance is influenced by a recipient’s receptivity to performance feedback (Ehrlich et al., 2020). School administrators may interpret higher prior observation scores as a marker that the teacher incorporates performance feedback into their practice, signaling that observing these teachers is a productive use of time.
Observable measures, those used by policy makers to assign observations, explained less than half the variance of unadjusted discretionary observations. Unobserved teacher (i.e., time-invariant differences between teachers) and unobserved school-by-year (i.e., differences between schools each year) fixed effects more than doubled the percentage of explained variance in discretionary observations, with fixed teacher intercepts responsible for most of the explanatory growth. Although the teacher and school-by-year fixed effects controlled for information (e.g., teacher motivation) that was unobservable to researchers and external decision makers, this information was likely available to school administrators. In some ways, these findings corroborate small-scale study findings and theoretical arguments from prior work suggesting that school administrators (i.e., observers) deviate from policy-prescribed observational processes using knowledge about their school or teachers that is only available to those working within schools (Darling-Hammond et al., 1983; Donaldson, 2021).
Changes in Average Student Achievement: Research Question 2
As the evidence suggested that estimates from the naïve models and models controlling for observable characteristics were negatively biased, the remainder of the article focuses on results from the school-by-year and teacher fixed effects models. The associations between average student achievement scores and supplementary or reduced observations, or lack thereof, represent important findings as ours is the first large-scale quantitative study to establish these links. The positive associations between supplementary discretionary observations and average student achievement scores in school-by-year and teacher fixed effects models may exist because school administrators believed that teachers receiving supplementary observations needed more than the policy-assigned number of observations before observations improved average student achievement scores. Alternatively, school administrators may have been compelled to supplement the policy-assigned number of observations for teachers who had an uncharacteristically bad prior year to closely monitor subsequent performance. In the year when the teacher received the supplementary observations, their uncharacteristically low prior-year performance is expected to returned to its normal levels due to “mean reversion” (Angrist & Pischke, 2009).
The change in average student achievement scores for teachers who received a reduced number of observations was statistically indistinguishable from the change in scores for teachers who received the policy-assigned number of observations. Administrators might have conducted less than the number of policy-assigned number of observations for teachers whom they believed were already on track to improve average student achievement scores. This pattern partially supports previous arguments suggesting that school administrators (e.g., observers) may deviate from policy-prescribed observational practices for good reason (Darling-Hammond et al., 1983; Donaldson, 2021).
Changes in Average Student Office Referrals: Research Question 3
Unlike the sensitivity of associations with average student achievement scores to observable control variables and fixed effects, associations with average student office referrals were relatively insensitive to model specification. Nonetheless, we focus on results from school-by-year and teacher fixed effect estimates as we did for models concerning achievement scores.
Relationships between discretionary observations and average student office referrals were negative or near-zero nulls. As the standard errors were small, we interpret the evidence to mean that average student office referrals are unrelated to reduced or supplementary observations. Despite the absence of statistically significant results, these still represent important findings as they represent the first evidence linking discretionary observations to student nonacademic outcomes.
Conclusions
To our knowledge, this is the first study linking discretionary observations to student outcomes, allowing us to explore the determinants of discretionary observations, and associations between discretionary observations and academic and behavioral student outcomes. Given our findings, we conclude that measures of teacher prior-year performance, teacher effectiveness, and unobserved teacher-level traits were important determinants of the number of discretionary observations received by Tennessee teachers. We hypothesized why discretionary observations tended to negatively associate with prior-year effectiveness scores but positively associated with prior-year observation scores. Despite its affordances, our quantitative data limited our ability to explain these associations definitively. Future qualitative research would be well-suited to exploring these explanations. We also found that discretionary observations were substantially determined by teacher-level variation that does not change over time, which we characterized as unobserved teacher traits such as the components of teacher motivation and ability that do not change over time. Again, we could not explore which specific traits accounted for the observed relationships; this may be another fruitful avenue for qualitative work.
Although the data did not permit us to make definitive conclusions about the net gains or losses of supplementary observations, the findings suggest that administrators’ supplementary-observation decisions benefit student achievement scores. Simultaneously, there was no evidence supplementary observations reduced average student office referrals. As supplementary observations necessarily required more administrator time than would have been spent conducting the policy-assigned number of observations, supplementary observations may take administrator time away from other schooling processes, potentially inhibiting nonevaluation processes and potentially offsetting gains in student achievement scores. If we knew the opportunity cost of administrator time and how much time administrators devoted to supplementary observations, we could definitively answer questions about the net benefits of supplementary observations.
We also concluded that administrators’ reduced-observation decisions plausibly represented net gains to schooling outcomes. First, there was no evidence that average student achievement scores or office referrals were worse for teachers in the years when they received reduced observations relative to the year when they received the precise number of policy-assigned observations. Second, reducing observations gives administrators more time to spend on other schooling processes. While reducing observations may harm student or teacher outcomes unmeasured in this analysis, our findings provided some evidence that administrators’ reduced-observation decisions may not represent a net detriment to schooling outcomes.
Finally, the data did not allow us to definitively understand why the receipt of discretionary observations was associated with improvements to average student achievement scores but no detectable changes in office referrals. Administrators may issue discretionary observations to improve student achievement scores more than reduce student misbehavior. While student achievement and misbehavior are intertwined, there is variation in achievement scores independent of student misbehavior (Anderson et al., 2019). School administrators may (un)consciously focus discretionary observations on teacher or student behaviors related to academics. Future survey or qualitative research would be well-suited to exploring the mechanisms explaining the heterogeneity in associations across student outcomes.
It is critically important to note that our inferences were based on administrator decisions and not externally mandated reductions or additions to policy-assigned observations. Our findings may not support inferences about what would happen if policy makers reduced or increased the number of observations assigned to teachers. Administrators did not issue discretionary observations randomly, nor did they issue discretionary observations based entirely on student and teacher observable characteristics, as corroborated by analyses of the determinants of discretionary observations. Instead, administrators plausibly used information only available to those working closely with teachers. To some extent, this corroborates findings from prior work: administrators adapt policy-assigned teacher evaluation procedures to meet their needs and their teachers’ needs (e.g., Donaldson & Woulfin, 2018).
Limitations
As the purpose of this study was to explore the extent to which discretionary observations were associated with student outcomes, we do not assert any causal effects. This study was also potentially limited in other ways. Our data was limited to only formal observations conducted for Tennessee teacher evaluation. Relationships between formal discretionary observations and student outcomes may not apply to relationships between informal observations and student achievement scores or student behavior. Future work might explore relationships between informal observations and student outcomes.
Reported associations captured the predicted change in an outcome for some number of reduced or supplementary observations received by the average teacher relative to the number of observations assigned to the average teacher by policy. These averages may not apply to teachers outside Tennessee. Future work might examine the extent to which our findings generalize.
Relatedly, the relationships between discretionary observations and student outcomes may depend on school administrator training or accountability mechanisms. Each year all Tennessee school administrators regained certification as formal teacher observers by demonstrating proficiency on recertification exams, and were accountable for their performance as teacher observers through administrator portfolio reviews 10 (Alexander, 2016; Teacher and Principal Evaluation Policy, 2013). It is plausible that the relationships between discretionary observations and student outcomes partially depended on observer certification or school administrator accountability mechanisms, underscoring the need for future research concerning discretionary observations in different contexts and observation systems.
Next, we could not identify which teachers wrote referrals. Future work capable of linking office referrals to the referring teacher might build on our findings.
Implications
Practice
Discretionary observations strongly depended on measures of teacher human capital (e.g., state-issued measures of teacher effectiveness), implying that these measures hold value for school administration. Although most school administrators in other settings have access to teacher observation scores, many cannot access the measures of teacher effectiveness generated by the Tennessee education agency (Walsh et al., 2017). This study suggests that school administrators might use measures of teacher effectiveness to make decisions about teacher observations associated with improvements in student achievement scores and behavior.
Research
Results from model-building implied that unadjusted associations (first-column results within each panel of Table 3) between discretionary observations and average student outcomes generated biased estimates. Models that did not control for observable differences between teachers (control variables) or unobservable differences between schools within an academic year (school-by-year fixed effects) and unobservable differences between teachers (teacher fixed effects) systematically produced more negative associations, which were explained away after controlling for the differences mentioned above. When considering whether discretionary observations are associated with improvements or impediments to student outcomes, our findings suggest that differences between teachers and between schools within a year introduce bias. Thus, researchers and practitioners interested in these associations might consider controlling for these differences by using teacher and school-by-year fixed effects.
Policy
After controlling for these previously mentioned differences, the evidence suggested that even when teachers received a reduced number of observations these reductions were not negatively associated with average student achievement and behavior. The absence of negative associations implies that district and state leaders in Tennessee may not need to be too concerned about discretionary observations, but this may not be the case in states where observation policy does not differentiate policy-assigned observations based on experience and prior-year effectiveness. This underscores the need for future research examining the extent to which the relationships presented in this study hold in settings assigning teachers different numbers of policy-assigned observations.
If the evidence implies any policy actions, Tennessee policy makers might encourage observers to issue supplementary observations to teachers with lower prior-year observation scores, who presumably are in more need of improvement. Otherwise, the evidence suggested that higher-performing teachers are more likely to receive supplementary observations.
Supplemental Material
sj-docx-1-eaq-10.1177_0013161X211003134 – Supplemental material for Linking Student Outcomes to School Administrator Discretion in the Implementation of Teacher Observations
Supplemental material, sj-docx-1-eaq-10.1177_0013161X211003134 for Linking Student Outcomes to School Administrator Discretion in the Implementation of Teacher Observations by Seth B. Hunter and April Ege in Educational Administration Quarterly
Footnotes
Declaration of Conflicting Interests
The author(s) declared no potential conflicts of interest with respect to the research, authorship, and/or publication of this article.
Funding
The author(s) received no financial support for the research, authorship, and/or publication of this article.
Supplemental Material
Supplemental material for this article is available online.
Notes
Author Biographies
References
Supplementary Material
Please find the following supplemental material available below.
For Open Access articles published under a Creative Commons License, all supplemental material carries the same license as the article it is associated with.
For non-Open Access articles published, all supplemental material carries a non-exclusive license, and permission requests for re-use of supplemental material or any part of supplemental material shall be sent directly to the copyright owner as specified in the copyright notice associated with the article.