
Abstract
Introduction
National data show that approximately 20% of public school principals in the United States leave their positions each year (Miller, 2013; Snodgrass Rangel, 2018). Policy makers are right to be concerned with principal turnover because it is disruptive to the school (Bartanen et al., 2019). Relatively little, however, is known about why principals leave and who chooses to leave (Tekleselassie & Choi, 2019). A recent literature review on principal turnover summarizes several studies that examine the demographic predictors of principal turnover (e.g., principals’ sex, race, age, experience, and education) as well as principals’ stated job satisfaction (Snodgrass Rangel, 2018), but did not find any studies that attempted to identify whether principal effectiveness predicts turnover. Important to our understanding of the full implications of principal turnover, however, is the relationship between principal effectiveness and the likelihood of principal departures. Specifically, are the principals who are most effective in their schools the most likely to leave their schools because they have more chances for better opportunities? Or, are the least effective principals more likely to leave their positions, either due to self-sorting or structural mechanisms in the profession, such as superintendent performance monitoring? As a third alternative, does principal effectiveness play no part in predicting a principal’s likelihood of departure? Understanding the interplay between principal quality and principal turnover is critical to our understanding of the effects of principal turnover. If the most effective principals are the ones leaving schools, then students, on average, are better off with less principal turnover, and states and districts should seek broad solutions to increase principal retention. On the other hand, if the principals leaving schools are relatively less effective than those who remain, then it may be that less-effective principals sort themselves out of schools in a way that is not as negative for students as it might first appear. If this is the case, efforts to increase principal retention without attention to improving effectiveness will have unintended negative consequences for the students in schools with less effective principals who now stay rather than exit. While any individual principal’s decision to leave a school is a function of many internal and external factors that are difficult to predict, gaining a better understanding of the patterns of principal turnover among more and less effective principals could help policy makers understand the extent to which policy solutions should prioritize stemming principal turnover.
One obvious challenge to this line of inquiry is that principal effectiveness is difficult to measure. A principal’s job is complex, and perhaps increasingly so in the age of enhanced accountability (Goldring et al., 2008; Grissom, Loeb, et al., 2015; Sebastian et al., 2018). Likewise, a principal’s effectiveness is context-specific and could depend on the match of principals with the characteristics of the schools in which they are placed (Brezicha & Fuller, 2019). Prior research also documents that principals are important drivers of school improvement (Clifford & Ross, 2012; Dhuey & Smith, 2018; Leithwood et al., 2004; Sebastian & Allensworth, 2012). Their behaviors and leadership practices are strongly correlated with student achievement (Waters et al., 2003). The same research also suggests that principals vary meaningfully in their effectiveness. Some have significant positive effects on student achievement, while others have significant negative effects. To date, research has failed to successfully identify observable characteristics that predict ex ante whether a principal will be effective. Researchers instead have only been able to determine effectiveness retrospectively; principals must be observed on the job, and then whether the principal had a positive impact can be assessed. Similarly, what is true for researchers might also be true for principals themselves; they might have difficulty predicting their own effectiveness beforehand and, instead, need some time on the job before their effectiveness is revealed. This limitation presents obvious difficulties in addressing the question we are interested in. For this study, we therefore rely on the perspectives of key constituents as a proxy measure of principal effectiveness: the perceptions of the teachers in their schools. Using data from survey questions that ask teachers about their perceptions of the school’s leadership, we create measures of principal quality. While not a perfect measure of the overall effectiveness of a principal, given the complex roles they play in schools, these measures nonetheless describe something important about the quality of the principal’s leadership. It is uncontroversial that effective teachers are essential to successful schools, and thus their perspectives of leadership quality are an important barometer for a key aspect of the principal’s overall effectiveness.
The purpose of this article is to estimate the relationship between principal quality, as captured by teachers’ ratings of their principal (which we view as a proxy measure of a principal’s overall effectiveness), and principal turnover. Specifically, we assess whether higher quality principals are more or less likely to leave their schools in New York City (NYC) as well as at the national level. Results show that lower quality principals are more likely to leave their schools than higher quality principals. This finding persists across school contexts and time, lending robustness to our results. We discuss how these results contribute to the literature around differential principal turnover, and how future work can further inform our understanding of principal mobility.
Background and Motivation
School leadership is considered the second most significant school-related factor impacting student outcomes, after teaching (Leithwood et al., 2004). While principals do not directly affect student achievement by instructing students as do teachers, they have a strong influence on student outcomes through teacher hiring, development, and retention, and influencing teachers’ job satisfaction and their perceptions of school culture (Glanz et al., 2007; Grissom & Loeb, 2011; Harris et al., 2010; Leithwood et al., 2004; Loeb et al., 2012). Moreover, principals can also influence teacher performance and satisfaction through shaping their school’s culture and climate (Burkhauser, 2017; Kraft et al., 2016; Sebastian & Allensworth, 2012). For instance, Grissom (2011) finds that principal effectiveness is associated with greater teacher satisfaction and lower teacher attrition, with larger positive effects in disadvantaged schools. Similarly, when examining avenues through which principals build teacher capacity, Doll (2010) argues that principals help foster strong relationships between teachers, celebrate teachers’ successes, and help teachers solve problems. Effective leaders are also individuals who strengthen support systems for teachers and allocate resources effectively, “to make teachers’ work less burdensome and more appealing” (Loeb & Reininger, 2004, p. 55).
Given the beneficial impact principals can have, it is not surprising that turnover among principals has negative consequences for teacher retention, student achievement gains, and school culture (Béteille et al., 2012; Griffith, 2004; Mascall & Leithwood, 2010). Using 12 years of administrative data from North Carolina, Miller (2013) finds that the years before and after a principal’s departure from a school are marked by increased teacher attrition and decreased student achievement. Most principals serve less than 5 years at a given school (Miller, 2013) which likely limits principals’ potential effects on school outcomes via their teachers. Branch et al. (2008) hypothesize that principals’ influence over the composition of the school staff increases with their tenure at the school as it enriches their knowledge of the school, its students, teachers, and community. Principal turnover evidently has consequences; those consequences, however, are not felt equally.
Principals are more likely to leave disadvantaged schools than they are more advantaged schools (Loeb et al., 2010; Tekleselassie & Choi, 2019). Unfavorable working conditions in these schools are likely a contributing factor (Yan, 2020). And, when principals move between schools, they are more likely to transfer from schools that have greater proportions of Black/Hispanic, low-income, and low-achieving students to schools that are relatively more advantaged (Béteille et al., 2012; Branch et al., 2008; DeAngelis & White, 2011; Fuller & Young, 2009; Gates et al., 2006; Loeb et al., 2010). Such patterns of turnover are especially problematic if the negative effects of principal turnover disproportionately harm high-poverty, low-achieving schools (Béteille et al., 2012). These studies, however, leave unanswered the question of whether all principal turnover is a net negative for schools and students. Depending on the effectiveness of the principal, it is possible that these schools would have seen even worse outcomes had the principal not departed.
While the importance of principals and the on-average negative outcomes correlated with principal turnover are well-established, little work examines whether more effective principals are more likely to leave schools. One reason for the lack of research on the topic is that measuring principal effectiveness is challenging (Clifford & Ross, 2012; Goldring et al., 2009). Race to the Top, a competitive federal grant program designed to encourage state-level innovation in public education, required states to design and implement rigorous evaluation systems for teachers and principals as a submission criterion (U.S. Department of Education, 2009). Approximately 40 states, as a result, tried to do as much (Chiang et al., 2016). Of the states and districts that did implement principal evaluation systems, many of them continue to struggle to effectively use these tools to assess principals—a problem that is exacerbated by the “scant evidence on the validity and reliability of current principal evaluation tools” (McCullough et al., 2016, p. 3). This is partly the case because principals’ responsibilities span multiple areas, including administration, organization management, day-to-day instruction, instructional program, internal relations, and external relations (Horng et al., 2010) as well as managing physical facilities and student behavior (Goldring et al., 2009). Accurately evaluating school leaders on all these dimensions proves incredibly hard.
The studies that attempt to measure principal effectiveness face certain challenges. Grissom, Kalogrides, et al. (2015) and Chiang et al. (2016) discuss the difficulties of disentangling principals’ contribution to student outcomes from other factors over which principals may not have control, such as teachers hired by prior principals. Additionally, estimating principal value-added to student achievement imposes substantial data requirements; namely, school observations over many years with the frequent turning over of the principal (Fuller & Hollingworth, 2014). And, without a measure of principal effectiveness, explorations of differential retention of effective and ineffective principals are stymied.
Present Study
Acknowledging these challenges, we leverage teacher perceptions of their principals as a proxy measure of principal effectiveness. This method to evaluate school leaders has face validity because principals primarily affect student outcomes through teachers (Hallinger & Heck, 1998; Hitt & Tucker, 2016). Teachers who are dissatisfied with their principals are more likely to leave schools (Allensworth et al., 2009; Boyd, Grossman et al., 2011; Branch et al., 2012; Grissom, 2011; Waddell, 2010), negatively affecting students (Ronfeldt et al., 2013). Using teacher ratings of principal quality is also supported by research that emphasizes the working relationship between principals and teachers, or, more generally, the leader and the followers (Clapp-Smith et al., 2009; Player et al., 2017; Walumbwa et al., 2008). A number of studies argue that effective principals are those who focus on interpersonal relationships to build trust with their teachers (e.g., Fox et al., 2015; Handford & Leithwood, 2013), and thereby realize positive outcomes (e.g., Beard, 2013; Bryk & Schneider, 2002; Dinham, 2005).
Our use of teacher perceptions is not novel. Other researchers have examined similar measures of principal quality included in many surveys of teachers. For instance, Seashore Louis et al. (2010) use teacher ratings of their principal’s quality to estimate the relationship between principal quality and student achievement. Similarly, Sebastian and Allensworth (2012) use multilevel structural equation modeling to explore how organizational factors mediate the relationship between a principal’s instructional leadership (as reported by teachers) and classroom instruction and student achievement. We are aware of only one other study, however, that uses this proxy measure of principal effectiveness to understand principal turnover. Focusing on Tennessee, Grissom and Bartanen (2019) find that, on average, less effective principals, as measured by teacher ratings, are more likely to leave their schools. The same is true of principal evaluation scores which are positively correlated with teacher ratings.
These findings lend support to the use of teacher ratings as a measure of principal quality. We add to this nascent literature by examining the relationship between principal quality and principal turnover in another jurisdiction, NYC, as well as at the national level. The exploration presented here speaks to the generalizability of findings while adding more nuance to the topic by understanding the relationship of interest across a number of principal characteristics and school contexts.
Using both nationally representative data and a richer set of longitudinal data from a large urban district (NYC), the current analyses answer two policy-relevant questions: How does a principal’s quality relate to that principal’s likelihood of leaving his or her school? Does the relationship between principal quality and principal turnover vary between principals with more versus less experience, across academic years, or between lower need and higher need schools? While the NYC data do give us important insights on a particular urban setting, the greater advantage is that the data span 4 consecutive years and enable us to explore these relationships across school contexts and time. The cross-sectional national-level data from the Schools and Staffing Survey (SASS) allow us to assess whether the general patterns from NYC replicate nationwide. While both data sets have advantages, the national-level analysis may mask heterogeneity in the relationship between principal quality and turnover, and the district-level findings may not be generalizable to other contexts.
In addition to exploring whether Grissom and Bartanen’s (2019) findings persist in the contexts we examine, we extend earlier work on the topic in meaningful ways. One contribution is the exploration of whether teacher ratings of their principals just reflect general teacher dissatisfaction with the school rather than specifically about the principal’s quality. We also assess whether principal quality is differentially associated with principal turnover by the number of years the principal has been at the school, given earlier studies showing that principal effectiveness improves with experience in the position (Branch et al., 2008). Another important contribution is the assessment of whether the pattern of principal turnover between schools that are often assumed to be lower need and higher need, based on eligibility for subsidized meals and Black and Hispanic enrollments of their student body, mirror the documented patterns of more effective teachers being more likely to leave high-Black/Hispanic and high-poverty schools (Goldhaber et al., 2011). Any negative effects of principal turnover will be exacerbated if more effective principals are also more likely to leave higher need schools.
While we, like most other researchers, are unable to distinguish between voluntary and involuntary turnover, a principal’s quality potentially impacts both types. Superintendents’ principal reappointment decisions most likely incorporate a variety of measures of principal quality such as teacher perceptions of their principal. Likewise, principals’ choices to remain or leave a school are likely influenced by their own perceptions of their effectiveness, which could be informed by feedback from their teachers. The relationship, therefore, that we measure between principal quality and turnover is an aggregate of voluntary and involuntary turnovers.
Similar to other measures of principal effectiveness, teacher ratings of principal quality based on teachers’ survey responses likely reflect biases. Despite teacher ratings being an imperfect method of evaluating principals, they are, nevertheless, an important measure in and of themselves. Teacher ratings of principal quality may be qualitatively different from the principal’s “true” quality, with some overstating and others understating the principal’s quality. Using average ratings across teachers within a school minimizes any such potential measurement error. Despite any remaining measurement error, however, teachers’ perceptions are a relevant measure, given that principals primarily affect students through teachers (Hallinger & Heck, 1998; Hitt & Tucker, 2016). This is especially true because teachers’ perceptions of their principals are inversely related to teachers’ likelihood of leaving the school (Grissom, 2011), and teacher turnover negatively affects student outcomes (Ronfeldt et al., 2013).
By understanding how principal quality relates to principal turnover across a number of school settings, principal characteristics, and time frames, we aim to provide a more comprehensive look at this important issue than has previously been presented.
Data and Measures
Data
New York City
The New York City Department of Education (NYCDOE) annually administers the NYC School Survey between February and April of the academic year to assess each school’s climate (NYC Departmentof Education, n.d.). We use data from the Teacher Survey component for the 2012-2013 to 2015-2016 academic years. Across these years, there are a total of about 266,000 teacher responses which we aggregate to the school level for the analyses. The NYC analytic sample contains between 1,700 and 1,900 schools in each of the 4 years. We augment these survey data with student-, teacher-, school-, and principal-level administrative data provided by the NYCDOE. The administrative data include information on principal age, experience, gender, race, and salary; teacher experience, gender, race, and salary; student race and free and reduced-price lunch eligibility; and school level and adequate yearly progress (AYP) achievement.
Schools and Staffing Survey
We also use the Teacher Surveys from the 2007-2008 and 2011-2012 waves of SASS, and the corresponding Principal Follow-up Surveys from 2008-2009 and 2012-2013. The SASS is a nationally representative data set collected by the National Center for Education Statistics (NCES). The 2007-2008 SASS was administered between September 2007 and June 2008, and the 2011-2012 SASS was administered in October 2011 (Cox et al., 2017). Across the two waves 76,740 teachers are surveyed. 1 Similar to the NYC sample, we aggregate teachers’ responses to the school level for each wave and combine this with data from the Principal Follow-up Surveys. The SASS analytic sample consists of 7,110 schools in 2008-2009 and 7,080 schools in 2012-2013. The SASS also provides information on student, teacher, and principal demographics for each school including principal age, experience, gender, race, and salary, teacher race, student race, school level, AYP achievement, and rurality indicators.
Sample
The final sample consists of 5,894 NYC principal-by-school year records and 14,120 SASS principal-by-wave observations after dropping cases with missing data. There are minimal missing data in both samples so as not to trigger bias concerns from dropping cases with missing data. The final NYC sample excludes the roughly 2% of total school-by-year observations that identify more than one principal for the school (meaning we could not disentangle which principal the teachers were evaluating in these cases) and one principal with missing salary information. The final SASS sample excludes 0.5% of the principal-by-wave observations that lack information on the principal’s following-year employment status.
Unsurprisingly, characteristics of the two samples differ—NYC is not representative of the entire United States (Table 1). For instance, NYC schools serve 87.6% Black/Hispanic students on average, compared with the SASS average of 36.6%. Similarly, the NYC sample has more Black/Hispanic principals than the SASS sample (51.6% compared with 13.3%) and more female principals (67.8% compared with 41.5%). Last, NYC public schools employ a teacher workforce that is 44.9% Black/Hispanic compared with 13.0% in the SASS sample. These differences support our interest in exploring whether the relationship between principal quality and principal turnover differs in the two contexts.
Variable Means and Standard Deviations, NYC and SASS Samples.

Note. The NYC sample includes 5,894 schools and the SASS sample includes 14,190 schools. NYC = New York City; SASS = Schools and Staffing Survey; AYP = adequate yearly progress.
Measures
The NYC and SASS data capture principal turnover in different ways. In NYC, we identify principal turnover when a principal is not observed as a principal in the school the following year. For principals in the SASS sample, NCES follows up with principals in the following year to determine whether they are still the principal in the same school. If not, the principal is identified as having exited the school (i.e., turned over). NYC principals exit at a considerably higher rate than in the SASS sample (20.4 vs. 12.0%; Table 1).
Both the NYC School Surveys and the SASS surveys ask teachers to express their degree of agreement or disagreement with a series of statements about their school’s principal such as “The principal at my school communicates a clear vision for our school” and “I trust the principal at his or her word” (see online supplemental material for the exact wording of all survey questions). We collapse teachers’ responses to these statements into measures of principal quality via factor analysis. We employ principal component factor analysis to confirm the factor structure separately by each year (wave) of each survey due to differences in the survey questions. Each survey question uses a 4-point Likert-type scale (1 = strongly disagree to 4 = strongly agree) with the exception of the NYC 2014-2015 survey that uses a 6-point scale which we convert to a 4-point scale.
Teachers rate principals highly on both the SASS and the NYC surveys. In the NYC surveys, across all years, 45% of responses indicate a “strongly agree” rating and 37% of responses indicate an “agree” rating. Across the two SASS waves, 43% of responses fall into the “strongly agree” category, and 38% of responses fall into the “somewhat agree” category. The relatively high percentages of ratings for both categories and the sharp right skew in overall ratings likely reflect a tendency for socially desirable responses that differ from teachers’ “true” answers (Callegaro, 2008). Specifically, teachers may have a general hesitance to be critical of their principals and therefore may be more likely to select “agree” when they actually disagree with a statement. When they truly agree with something, however, they may be more likely to select “strongly agree” instead of “agree” to differentiate their responses from those that they rated affirmative even though they had ambivalent or somewhat negative responses. Another reason for the large percentage of positive statements for NYC could be because NYC School Surveys are used for accountability and school improvement purposes. 2 To increase the chance that we capture teachers’ true agreement with a statement and not the pressure to inflate answers, we convert the NYC and SASS survey scales into a binary indicator (1 = strongly agree; 0 = otherwise; Claro et al., 2018; Liu et al., 2011). 3
Reliability analysis for questions on the NYC surveys, by year, yield Cronbach’s alphas that are greater than .97. A similar exercise for questions on the SASS surveys by wave produces Cronbach’s alphas that are greater than .86. With the factor structure confirmed, we create a school-by-year (wave) measure of teachers’ perceptions of their principal’s quality by simply aggregating each question to the school and averaging across the questions.
On average, principals receive similar ratings from their teachers across the two samples. Although the questions vary across the samples and waves (the importance of which we examine later), the average principal has a 45.0% “strongly agree” rating in NYC and a 43.9% “strongly agree” rating in the SASS. We standardize these measures within a year (wave) for interpretational ease in the analyses.
Analytic Strategy
To understand how teachers’ ratings of their principal’s quality relate to principal exits, we estimate linear probability regressions of principal exits on the measure of principal quality. 4 For all analyses using the NYC data, we use a statistical adjustment to correct the standard errors to reflect the fact that the data are clustered across years within the same schools. The main model specification is given in Equation 1 which we estimate separately for the NYC and SASS samples.
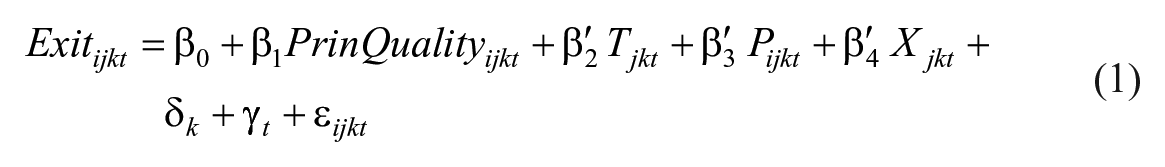
The model predicts whether principal i at school j located in NYC community district or SASS state k exits at the end of year t as a function of the teachers’ aggregated and standardized ratings of the principal’s quality (
The control variables vary somewhat across the NYC and SASS samples due to differences in the data collected in each setting. In both samples, we control for principal race, gender, salary, and years of experience (in their current school and at other schools) and teacher race. The NYC data provide additional teacher characteristics which we include in the models: teacher gender, salary, and years of experience. As for the student characteristics, we capture, for both the NYC and SASS samples, differences across principals in the proportion of Black/Hispanic students, whether the school met AYP, and the grade level of the school. In the NYC models, we also include the proportion of students eligible for free or reduced-price lunch (as a proxy for socioeconomic status), while in the SASS models we include the school’s rurality status. The inclusion of these variables as controls in the analytic model is motivated by prior literature that shows that personnel, job, and work environment characteristics influence school leaders’ decisions to turn over (Baker et al., 2010; Boyce & Bowers, 2016; Grissom & Andersen, 2012; Grissom & Mitani, 2016; Tekleselassie & Villarreal, 2011). Accounting for these factors help the models better isolate the relationship between principal quality and turnover.
The models also included jurisdiction and year fixed effects to help account for unobservable differences between principals and their schools. NYC, as the largest district in the country, organizes its schools into smaller community and high school districts, each of which has its own superintendent. Including district fixed effects in the model allows us to compare schools within a district, as well as control for any unobservable characteristics of the district that may offer competing hypotheses to the relationship of interest. In a similar vein, including state fixed effects in the SASS model accounts for unobservable state-specific characteristics that may similarly influence both the dependent variable and the main independent variable, while also ensuring that the model is conducting within-state comparisons. Finally, because we examine the relationship of interest over 4 years for NYC and across two waves of the SASS data, the models include year fixed effects to conduct within-year comparisons and to control for any year-specific unobservable influences. As discussed previously, within the NYC sample, questions relating to the principal as well as the scale of ratings change over time. The inclusion of year fixed effects therefore also accounts for any resulting variation in the principal quality measure across years.
In the absence of experimental data, our analyses do not permit us to make definitive claims about whether principal quality caused principal turnover. It could be that the relationship we measure reflects other differences between higher and lower quality principals that drives principal turnover patterns. We do, however, rule out many of the most likely competing hypotheses with both the rich set of covariates included in the model and the numerous robustness checks carried out. Even without the ability to make definitive causal claims, the analyses offer a way to describe the relationship between principal quality and turnover and, in doing so, presents novel insights by examining the research question across principal characteristics, school contexts, and time.
Results
We begin by showing results for the main model and then a series of alternate specifications that assess whether findings from the main model can be explained by other relationships and whether they are robust to a variety of contexts.
Main Model
The main results for both the NYC and SASS samples consistently show that principal quality is negatively correlated with principal exits; higher quality principals are less likely to turn over (Table 2). The relationship is remarkably robust for both samples as we include additional control variables, moving from the simple correlation between principal quality and principal turnover (column 1) to adding year fixed effects (column 2), principal characteristics (column 3), teacher characteristics (column 4), school characteristics (column 5), and, finally, district fixed effects (column 6), enabling us to rule out numerous competing hypotheses. The results from the preferred model specification (column 6) show that, after controlling for the full set of covariates, a 1 standard deviation increase in principal quality corresponds to a statistically significant 2.1 percentage point decrease in the likelihood of a NYC principal leaving. With the average principal turnover rate for NYC at 12.0%, a 1 standard deviation change in principal quality represents 17.5% of the total turnover, making the results substantively meaningful as well. On the national level, a 1 standard deviation increase in principal quality predicts a 3.4 percentage point decrease in principal exits or 16.7% of the average turnover among principals in the SASS sample.
Selected Coefficients From Models Predicting Principal Exit, NYC and SASS Samples.

Note. Where applicable, robust standard errors in parentheses are clustered at the school level. Teacher ratings have been standardized. See Table 1 for a description of the control variables. NYC = New York City; SASS = Schools and Staffing Survey.
p < .001.
Robustness Checks
Even though our preferred specifications yield very similar and consistent results for both the local and national samples, readers might be concerned that despite the rich set of covariates, we are detecting spurious associations between principal quality and principal turnover. To address this concern, we estimate a series of models with alternative specifications as robustness checks.
Construction of principal quality variable
It may be that the results are unique to the specific way in which we create the principal quality measures. We use the full set of questions from each survey so as to get as comprehensive a rating as possible despite the questions differing between the surveys and across waves in NYC. To ascertain whether this decision influences results, we identify a set of questions in the NYC surveys that closely resemble those from the SASS surveys (see asterisked questions in the list in online supplemental material). These alternate NYC principal quality measures are created following the same process as before. The association between principal quality and principal turnover remains unchanged: a 1 standard deviation increase in principal quality correlates to a 2.1 percentage point decrease in the likelihood of principals exiting (Table 3, column 1). The NYC finding is not driven by differences in the composition of the principal quality measure.
Selected Coefficients From Models With Alternative Specifications Predicting Principal Exit, NYC Sample.

Note. Where applicable, robust standard errors in parentheses are clustered at the school level. All models include the full set of control variables described in Table 1. NYC = New York City; SASS = Schools and Staffing Survey.
p < .05. ***p < .001.
Lagged ratings
Another concern is that teachers may respond differently to questions in the principal’s last year in the position. Specifically, teachers might rate principals lower knowing that they are about to leave, or principals may perform less than optimally because they are about to leave, resulting in lower ratings. To address this “last year” effect, we estimate the main model replacing teacher ratings of their principal with their ratings of their principal from the prior year. Because we do not have the data to do this for the SASS, this analysis is limited to NYC and necessarily excludes the first year of data.
Using teachers’ lagged ratings of the principal, principal quality continues to be negatively associated with principal turnover. A 1 standard deviation increase in principal quality corresponds to a statistically significant 1.6 percentage point decrease in the likelihood of a principal exiting (Table 3, column 2). Although the relationship attenuates relative to the main model (a 2.1 percentage point decrease), this decrease appears to be explainable by the forced exclusion of the 2012-2013 academic year and all first-year principals. Estimating the main model specification on this reduced sample reveals a nearly identical 1.5 percentage point decrease (Table 3, column 3), implying that teachers do in fact consistently rate principals.
Voluntary turnover
A principal will involuntarily exit if the superintendent decides not to renew the principal’s employment contract. Superintendents of each of NYC’s smaller community and high school districts have control over principal contracts in their district. Changes in superintendents from one year to the next may therefore affect principal turnover. Although the data do not indicate if a principal exits voluntarily or involuntarily, we control for this source of involuntary exits in the NYC sample by adding district-by-year fixed effects to the main model. The result is little changed—a 1 standard deviation increase in principal quality corresponds to a statistically significant 2.0 percentage point decrease in the likelihood of the principal exiting (Table 3, column 4), suggesting teacher ratings predict voluntary exits.
Retirement
Another cause of principal departures, retirement, may also drive the results if principal age is correlated with teacher ratings of their leadership. We therefore estimate the preferred model for principals not of retirement age, that is, less than or equal to 55 years of age (Table 4). In NYC, we exclude the 2015-2016 wave as we are missing age data for 11% of the principals. Again, this alternative model specification returns very similar results: a 1 standard deviation increase in principal quality is statistically significantly associated with a 2.0 percentage decrease in the likelihood of a principal leaving in NYC (column 1) and a 3.4 percentage point decrease in the SASS sample (column 2). The main results are not influenced by age-related turnover.
Selected Coefficients From Models With Alternative Specifications Predicting Principal Exit, NYC and SASS Samples.

Note. Where applicable, robust standard errors in parentheses are clustered at the school level. All models include the full set of control variables described in Table 1. NYC = New York City; SASS = Schools and Staffing Survey.
p < .01. ***p < .001.
Collegiality
It may be that the consistent relationship we measure between principal quality and principal turnover actually reflects teachers’ general perception about the school’s environment and climate, and are not specifically evaluative of the principal’s quality. Teachers could be unhappy with the level of collegiality they feel with other teachers at their school, and could be expressing this general level of discontent in their ratings of their principal. We therefore construct a measure of teacher collegiality leveraging the relevant questions from both the NYC and SASS surveys (see online supplemental material for the wordings of the survey questions) using the same method as we use to create principal quality measures. The collegiality measure for the NYC sample has a mean of 0.47 and a standard deviation of 0.19, and a mean of 0.38 and a standard deviation of 0.27 for the SASS sample. 5
It is likely that teachers’ general perceptions of the school colors their interaction with their principal. In fact, teacher ratings of principal quality are highly correlated with teacher ratings of collegiality: a .74 correlation in the NYC sample and a .60 correlation in the SASS sample. To ensure that teacher ratings of their principals do not include their views about other aspects of the school, we add the measure of collegiality to the main model.
Yet again, this alternative model specification has little effect on the main coefficient of interest (Table 4, columns 3 and 4). Principal quality continues to have a negative and statistically significant association with principal turnover. Teachers are separately assessing their principals’ quality from their views of other factors of the school. Furthermore, teacher ratings of collegiality do not predict principal turnover, indicating that principals’ departures from their roles are likely not influenced by levels of teacher collegiality.
Mobility
The above findings show that principal quality is associated with departures from schools. This leaves unanswered whether principal quality differentially predicts principals moving to another school or leaving the principalship altogether. We estimate the main model separately for principals who move schools (Table 5, column 1) and for principals who leave the principalship altogether (Table 5, column 2), relative to staying, in order to explore this issue. In the SASS sample, 7.5% of principals transfer between schools and another 12.7% leave the principalship. 6 Results show that a 1 standard deviation increase in principal quality is significantly correlated with a 1.8 percentage point decrease in the likelihood of principals moving to another school, and a 1.7 percentage point decrease in the likelihood of principals leaving. While principal quality is related to both types of principal turnover, the relationship does not differ with the type of turnover. It is not the case, therefore, that lower quality principals are just shifting among schools, but rather that many lower quality principals are no longer leading schools.
Selected Coefficients From Models Predicting Principals Moving Across Schools or Leaving the Principalship, SASS Sample.

Note. Where applicable, robust standard errors in parentheses are clustered at the school level. All models include the full set of control variables described in Table 1. SASS = Schools and Staffing Survey.
p < .001.
Heterogeneous Effects
Across the many variations of models presented above, we continue to see a consistent result, lending support to the main effects: principal turnover is negatively correlated with principal quality—higher quality principals as measured by teacher ratings are less likely to turn over. We next examine how the association may differ with principal experience, academic year, and student characteristics. For each factor, we divide principals into groups, and estimate separate models for each group to allow the associations of all the covariates with principal turnover to vary across the groups.
Experience
Prior research shows that principal quality varies with the number of years at the school (Branch et al., 2008); however, it is unclear if and how the relationship between principal quality and principal turnover varies with experience. It could be that as principals gain more experience and improve in quality, they are comfortable remaining at their same schools. Conversely, more experienced and higher quality principals may realize their prospects for better jobs, and may therefore be more likely to leave. To examine this relationship empirically, we divide principals into groups by their experience in the school—first year in the school, second year in the school, third-fourth year in the school, fifth-tenth year in the school, and more than 10 years in the school.
For NYC, the results show that for each level of experience other than more than 10 years in the school, principal quality negatively and statistically significantly predicts principal turnover (Table 6). A postestimation test using seemingly unrelated regressions (SUR), which allows for testing of coefficients across different regression models, shows that the coefficients from each of these models are in fact not different from each other. We similarly estimate fully parametrized models for the SASS (Table 6) and find that across the levels of principal experience, principal quality consistently and negatively predicts principal turnover. Here, a SUR test suggests that the coefficients from the models for third to fourth year principals and principals who have more than 10 years of experience at their schools are statistically different. The magnitudes of the association between principal quality and principal turnover vary between these two models, but the directionality remains the same. It does seem that principal quality has a relatively weaker association with principal turnover for principals who are at their schools for more than 10 years in both samples, implying that more experienced principals may be less responsive to quality indicators.
Selected Coefficients From Models Predicting Principal Exit Estimated Separately by Principal Experience at the School, NYC and SASS Samples.

Note. Where applicable, robust standard errors in parentheses are clustered at the school level. All models include the full set of control variables described in Table 1. NYC = New York City; SASS = Schools and Staffing Survey.
p < .1. *p < .05. **p < .01. ***p < .001.
Academic year
It could also be that principal quality has a differential relationship with principal turnover over time, which the year fixed effects included in our preferred model specification are absorbing. For the NYC sample, principal quality is negatively associated with the likelihood that a principal exits across all years (Table 7). The relationship is the largest for 2012-2013 (column 1), not statistically significant for 2013-2014 (column 2), and statistically significant at the 10% level for 2015-2016 (column 4). Results from SUR tests, however, suggest that none of the coefficients across the years are statistically significantly different from each other, indicating that while the point estimate of the relationship of interest may be stronger in some years than in others, it appears to persist across all years. The SASS models show a similar pattern of results (columns 5 and 6).
Selected Coefficients From Models Predicting Principal Exit Estimated Separately by Survey Wave, NYC and SASS Samples.

Note. Where applicable, robust standard errors in parentheses are clustered at the school level. All models include the full set of control variables described in Table 1. NYC = New York City; SASS = Schools and Staffing Survey.
p < .1. *p < .05. ***p < .001.
Student characteristics
Research shows that principals tend to leave schools that serve greater proportions of Black/Hispanic and low-income students for schools with relatively lower shares of Black/Hispanic and low-income students (Loeb et al., 2010). If, however, higher quality principals are more likely than lower quality principals to leave these high-need schools, the adverse effects of principal turnover may further harm the students in these schools. To understand the extent of this possibility, we examine whether the main finding varies by the student populations that schools serve.
We explore the relationship between principal quality and principal turnover by levels of student characteristics. For both school Black/Hispanic student share and school free and reduced-price lunch share, we group schools into 20 percentage point groups (0% to 20%, 21% to 40%, 41% to 60%, 61% to 80%, and 81% to 100%). We only observe school free and reduced-price lunch share in NYC. Here, fewer than 5% of schools fall into the lowest group (20% or fewer students eligible). We therefore collapse the first two groups into a single group.
In no group of schools, defined on either the concentration of Black/Hispanic students or students eligible for free or reduced-price lunch, are higher quality principals more likely to turn over. All but one point estimate are negative (and that one estimate is not statistically significant), confirming the main result that higher quality principals are less likely to turn over than lower quality principals (Tables 8 and 9). A simple comparison of the point estimates across the groupings of schools suggests that an increase in quality has at least a somewhat larger negative association with turnover in schools serving the highest need student populations, that is, higher quality principals relative to lower quality principals are more likely to stay in the higher need schools—the very schools in which they are most needed. The results of SUR tests, however, reveal these differences are often not significant. For example, in the SASS sample, the negative relationship between a 1 standard deviation increase in quality and turnover in the schools with the highest concentration of Black/Hispanic students (3.9 percentage points, Table 8) is not different from that in the schools with the lowest concentration (2.9 percentage points, Table 8). The same is true of the comparison of the negative relationship in NYC between schools with the highest and lowest concentrations of poor students (2.3 vs. 1.2 percentage points, Table 9). Comparisons of the estimated relationship in NYC between schools with the highest and lowest concentration of Black/Hispanic students, however, provide contradicting evidence. The SUR results confirm that a 1 standard deviation increase in principal quality is more negatively correlated with turnover in the schools with the highest concentration (2.9 percentage points, Table 8) than in schools with the lowest concentration where the relationship is statistically insignificant. Taken together, these results provide no conclusive evidence that the relative turnover rates of high- and low-quality principals differ based on characteristics of the students they serve.
Selected Coefficients From Models Predicting Principal Exit Estimated Separately by School Black/Hispanic Share, NYC and SASS Samples.

Note. Where applicable, robust standard errors in parentheses are clustered at the school level. All models include the full set of control variables described in Table 1. NYC = New York City; SASS = Schools and Staffing Survey.
p < .05. ***p < .001.
Selected Coefficients From Models Predicting Principal Exit Estimated Separately by School Free/Reduced-Price Lunch Share, NYC Sample.

Note. Where applicable, robust standard errors in parentheses are clustered at the school level. All models include the full set of control variables described in Table 1. NYC = New York City.
p < .1. ***p < .001.
Discussion
These analyses show consistent evidence that principals who receive higher quality ratings from their teachers are less likely to leave their positions than those who receive relatively lower quality ratings. The principalship is a multifaceted job, as demonstrated by the array of topics covered by the survey questions we use to construct the principal quality measure. And, while the measured dimensions of the principalship vary across the surveys, the findings are strikingly consistent. Teacher ratings of principals’ leadership explain about one fifth of the total variation in school departures. Schools are, on average, more likely to lose principals who are relatively less effective, suggesting that, to the extent that principal turnover is a problem, it does not appear to be driven by higher quality principals.
The main result also echoes findings from the teacher literature, where more effective teachers are less likely to leave schools (Boyd, Lankford et al., 2011; Goldhaber et al., 2011). The similarities suggest that more effective school personnel, on average, are more likely to remain in their roles at their schools. We find no consistent evidence that higher quality principals relative to lower quality principals are differentially likely to exit more versus less disadvantaged schools.
Our findings offer encouraging news for the field along with some policy implications. If higher quality principals are in fact more likely to remain at their schools, broad emphasis on reducing overall principal turnover might be somewhat misplaced. Districts should instead focus on recruiting more higher quality principals and developing the lower quality principals currently on the job, both of which might naturally reduce principal turnover and its related negative consequences. Principals not meeting performance standards should be given, within reason, the opportunity and resources to improve. Those principals who do not improve should leave. The principalship is both a complex and vital role, and there is no reason to believe that everyone who attempts it will be successful. Encouragingly, the findings indicate that at least some principal turnover appears “well-informed,” that is, lower quality principals are leaving schools, vacating the position to perhaps be filled by a higher quality principal.
One key policy-relevant topic this study leaves unexplored concerns who replaces the principals that leave. If they are replaced by principals of similar quality, then principal turnover does not make students and teachers at those schools any better off. Understanding the quality of replacement principals will add more nuance to our understanding of principal turnover. A related issue is whether principal effectiveness is situational. It could be that a principal who is ineffective in one school is effective in another. Following principals who switch schools would allow us to begin examining these questions and shed more light on the complex relationship between principal turnover and principal quality. Unfortunately, our current data do not include enough such transitions to warrant an exploration of the principals who replace those that leave.
Conclusions
This article is one of only a few to shed light on the interplay between principal quality and principal turnover. Higher quality principals are less likely to exit their schools, implying that at least some of the principal turnover we observe in schools might be part of an efficient system in which ineffective principals are sorting (voluntarily or involuntarily) into other positions. Moving forward, research should focus on enriching our understanding of differential attrition patterns so that efforts to retain principals can be better targeted. Researchers should also continue to seek ways to target improvement of existing principals. Such efforts would reflect the findings presented in this paper and ultimately lead to better outcomes for students.
Supplemental Material
sj-docx-1-eaq-10.1177_0013161X211011235 – Supplemental material for Principal Turnover: Using Teacher-Assessments of Principal Quality to Understand who Leaves the Principalship
Supplemental material, sj-docx-1-eaq-10.1177_0013161X211011235 for Principal Turnover: Using Teacher-Assessments of Principal Quality to Understand who Leaves the Principalship by Aliza N. Husain, Luke C. Miller and Daniel W. Player in Educational Administration Quarterly
Footnotes
Acknowledgements
We appreciate financial support from the National Center for the Analysis of Longitudinal Data in Education Research (CALDER). We are also grateful to the Bankard Fund for Political Economy’s Predoctoral Fellowship in support of the pursuit of Aliza Husain’s dissertation. Finally, we are grateful to conference participants at the Association for Education Finance and Policy (AEFP) and the University Council for Educational Administration (UCEA), and James H. Wyckoff, Michelle D Young, and Daphna Bassok for their feedback.
Authors’ Note
The views expressed in this article are solely those of the authors and do not reflect those of the funders.
Declaration of Conflicting Interests
The author(s) declared no potential conflicts of interest with respect to the research, authorship, and/or publication of this article.
Funding
The author(s) disclosed receipt of the following financial support for the research, authorship, and/or publication of this article: CALDER is supported by IES Grant R305A060018. The research is also supported by the Institute of Education Sciences, U.S. Department of Education, through Grant R305B100009 to the University of Virginia.
Supplemental Material
Supplemental material for this article is available online.
Notes
Author Biographies
References
Supplementary Material
Please find the following supplemental material available below.
For Open Access articles published under a Creative Commons License, all supplemental material carries the same license as the article it is associated with.
For non-Open Access articles published, all supplemental material carries a non-exclusive license, and permission requests for re-use of supplemental material or any part of supplemental material shall be sent directly to the copyright owner as specified in the copyright notice associated with the article.