
Abstract
Effect size use has been increasing in the past decade in many research areas. Confidence intervals associated with effect sizes are encouraged to be reported. Prior work has investigated the performance of confidence interval estimation with Cohen’s d. This study extends this line of work to the analysis of variance case with more than two groups. Confidence interval estimation for the omega-squared (ω2) effect size measure was evaluated under a variety of simulated conditions with three methods where the primary interest was in the comparative performance of the three confidence interval calculation methods (i.e., parametric, percentile bootstrap, and bootstrap bias-corrected and accelerated confidence interval [BCA]) across a variety of real-life data situations. Results suggest that sample size and magnitude of the effect influence coverage rates and interval width. The percentile bootstrap method produced the widest intervals and had higher coverage rates in the smaller effect size conditions compared with the parametric and BCA approaches.
Effect size use is widespread in the social sciences as researchers recognize their effectiveness in communicating information regarding the magnitude of an effect beyond statistical significance. Moreover, effect sizes are one method to overcome some of the limitations of statistical tests (Kline, 2004). Thompson (2006) defined an effect size as a measure of “the extent to which sample statistics diverge from the null hypothesis” (p. 172). With regard to comparison of means using analytic tools such as the t test or analysis of variance (ANOVA), effect sizes can be expressed either as a measure of standardized mean differences, such as Cohen’s d and f2, or as a proportion of variance explained, such as eta-squared (η2) and omega-squared (ω2). Indeed, many educational and psychological journals require authors to report an effect size measure associated with the statistical test (Olejnik & Algina, 2003). Beyond being reported in journals, effect sizes also appear in the legal realm, for example, in court cases concerning hiring practices (Grissom & Kim, 2005), highlighting the importance of accurate effect estimates and interpretation. Although effect size measures do not themselves equal practical significance, they do provide assistance in judging practical significance, which in part is responsible for the increased frequency of their use.
The American Psychological Association (APA) Board of Scientific Affairs Task Force on Statistical Inference stated that effect size estimates should be reported in conjunction with the results of a significance test and encouraged reporting confidence intervals for parameters whenever possible, including specifically those for effect sizes, which has been echoed elsewhere in the literature (e.g., Smithson, 2001; Steiger & Fouladi, 1997).
The purpose of the current simulation study was to compare the performance of three methods (i.e., parametric, percentile bootstrap, and bootstrap bias-corrected and accelerated confidence interval [BCA]) for calculating confidence intervals for ω2, which is the preferred effect size estimate for ANOVA (Kirk, 1995; Thompson, 2006). Prior work (Algina, Keselman, & Penfield, 2006; Kelley, 2005) on these three methods has focused on the two groups case (Cohen’s d), but not on more complex ANOVA models, including factorial designs. For technical details on these methods, see Algina et al. (2006) and Kelley (2005). Prior results showed superior coverage for Cohen’s d by the bootstrap methods in some instances. There has been little comparative simulation work conducted to assess the performance of confidence intervals for ω2, either with the parametric or bootstrap approaches. Given the importance of ω2 in the reporting of ANOVA results, our study compared these methods for more than two groups, and with a factorial ANOVA.
Methods
The Monte Carlo simulation methodology (1,000 replications) was conducted across the following manipulated conditions, which are similar to those employed in Algina et al. (2006) and Kelley (2005), with appropriate extensions for ANOVA. The manipulated factors were the aforementioned methods for calculating confidence intervals, population effect size (0 = no effect, 0.01 = small, 0.059 = medium, and 0.138 = large), distribution of dependent variable (standard and seven nonnormal conditions; see Algina et al., 2006), group variance homogeneity (differing by a factor of 0, 0.5, 1.0, and 1.5), number of groups (three, four, and five), number of independent variables (one variable only, two variables with the same effect size but no interaction, or two variables with the same effect size and a significant interaction), and sample size (5, 10, 20, 50, and 100 per group). The outcome variables included coverage rates for ω2, effect size estimation, and width of the intervals.
Results
Repeated measures ANOVA was used to identify significant manipulated factors in the simulation, which are discussed below.
Coverage Rates
Coverage rates for all methods were frequently below the 0.95 nominal value (see Figure 1). When the data were simulated from a normal distribution (Distribution 1 in Figure 1), the coverage rates for the parametric approach were somewhat higher than those of both the percentile and BCA bootstrapping methods. Although a similar pattern to that for the normal distribution was apparent for most of the nonnormal conditions, the actual coverage rates varied greatly across distributions and within distribution across effect size values.
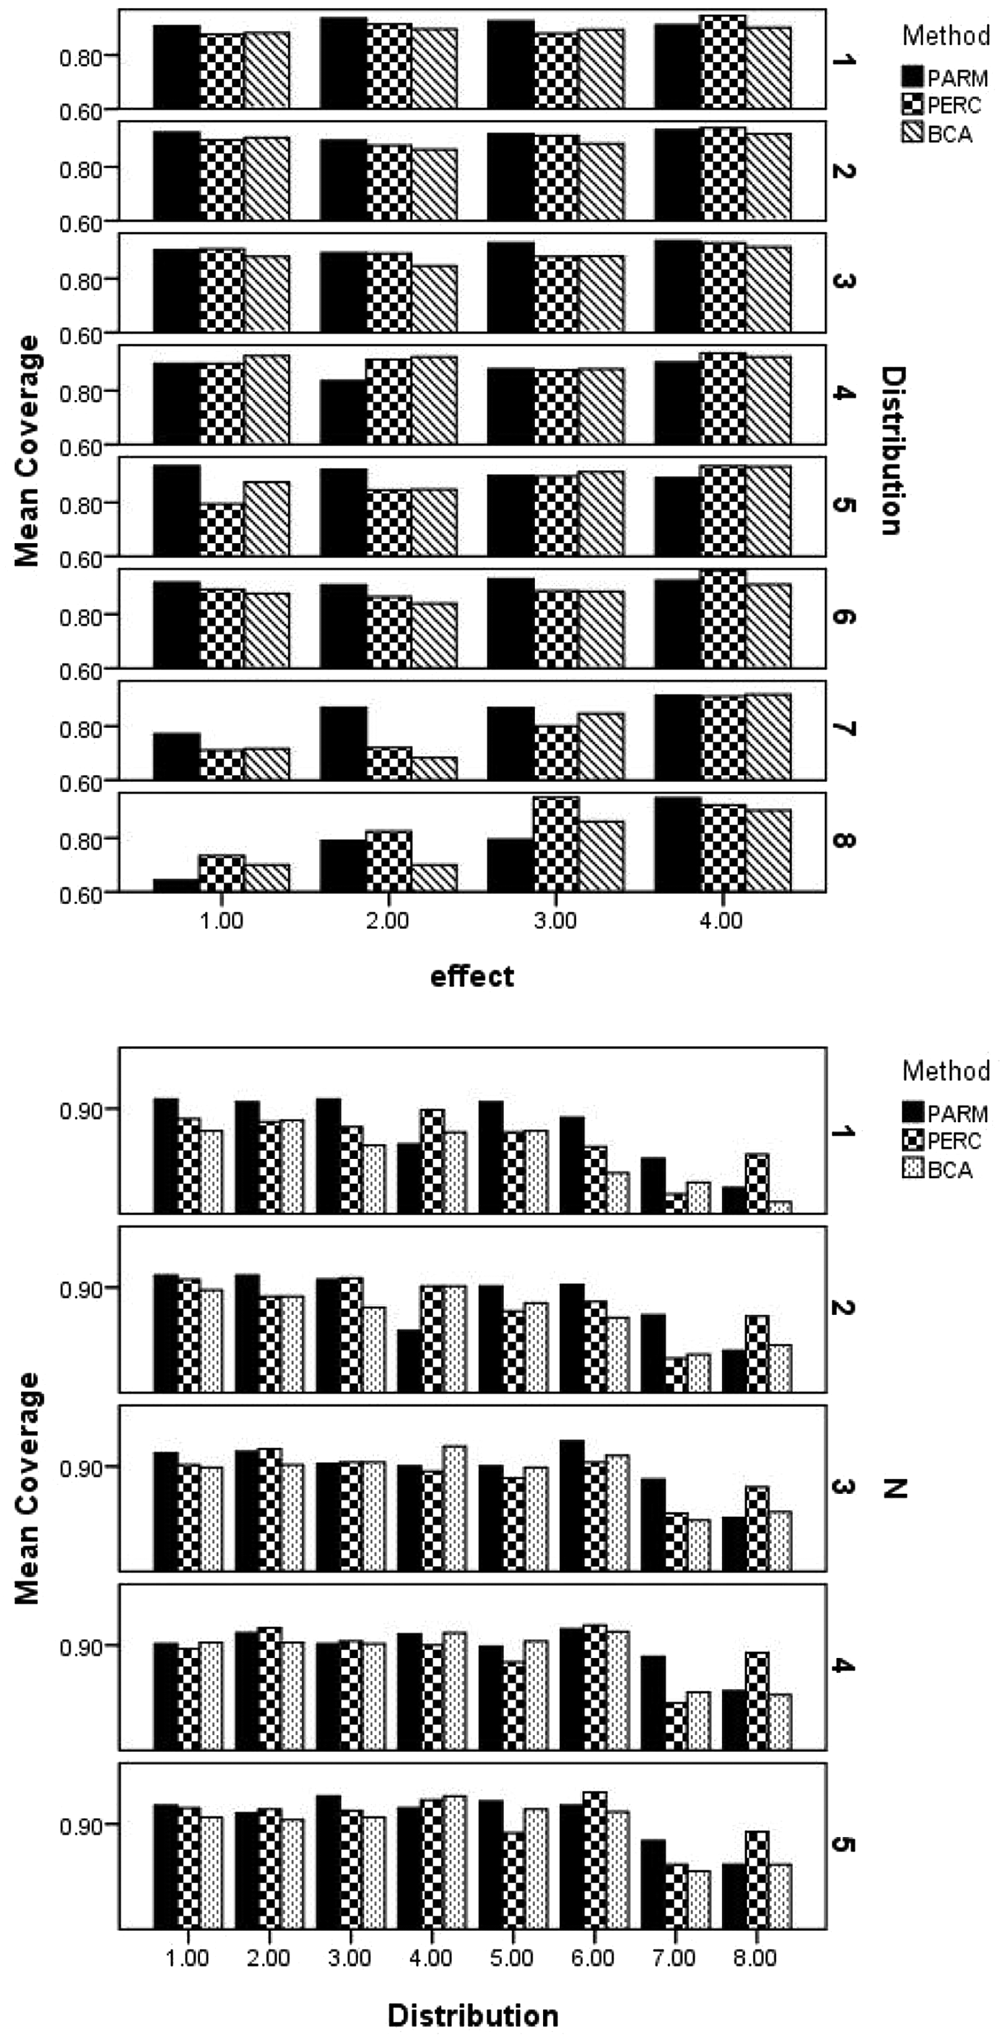
Coverage rates by distribution of dependent variable, effect size magnitude, and sample size
When the data were normally distributed, the coverage rates for the parametric method were largely unchanged across sample sizes (see Figure 1). In contrast, for most of the nonnormal conditions, coverage rates were generally higher for larger samples. The influence of distribution and sample size on both bootstrap methods was complex and somewhat different compared with the parametric method. One consistent pattern across the nonnormal distributions was lower bootstrap coverage rates for smaller sample size conditions. In addition, for most of the distributions, the coverage rates were higher for the percentile method compared with the BCA method, and both generally had lower coverage rates than the parametric method for the nonnormal distributions regardless of sample size. This latter result was particularly notable for the most extreme kurtosis conditions, except when the population effect size was 0, in which case coverage rates were at or very near the nominal level. Coverage rates for all three confidence intervals were lowest when there was a second variable present in the analysis and that variable interacted with the target (Table 1). Otherwise, coverage rates were comparable across conditions. In addition, the impact of the interaction on the coverage rates was greater for the two bootstrap approaches than for the parametric method.
Coverage and Confidence Interval Width Values by Number of Independent Variables

CI = confidence interval; Parm = parametric; Perc = percentile bootstrap; BCA = bootstrap bias-corrected and accelerated.
Effect Size Estimation
There are two primary candidate causes for the variation in coverage rates reported above: (a) accuracy of effect size estimation and (b) width of the intervals. In general, when the data were normally distributed (1 in Figure 2), bias was low across effect sizes, though slightly higher for small and medium effect sizes (2 and 3 in Figure 2) than for no or a large effect. This low bias was evident in nonnormal conditions except for Distributions 6 and 7 where there was somewhat greater positive bias for the small (3), medium (2), and large (1) effect sizes, with increasing bias associated with a greater effect. Conversely, for Distribution 8 (greatest kurtosis), there was a marked negative bias for the large effect size.

Bias in estimate of ω2 by effect, distribution, and sample size
Across distributions, smaller sample sizes resulted in greater bias in estimates of ω2 (Figure 2), though there was not a consistent pattern in its direction, with overestimation in some instances and underestimation in others. For distributions with greater kurtosis (4, 5, 6, 7, and 8), this relationship between sample size and bias was most notable, with positive bias in evidence for most of the distributions except for Distribution 8, where the degree of negative bias increased with increasing sample size. Interpreting these results in light of those presented earlier for the coverage rates, it appears that part of the reason for poor coverage in some of the nonnormal conditions was poor estimation of ω2 itself.
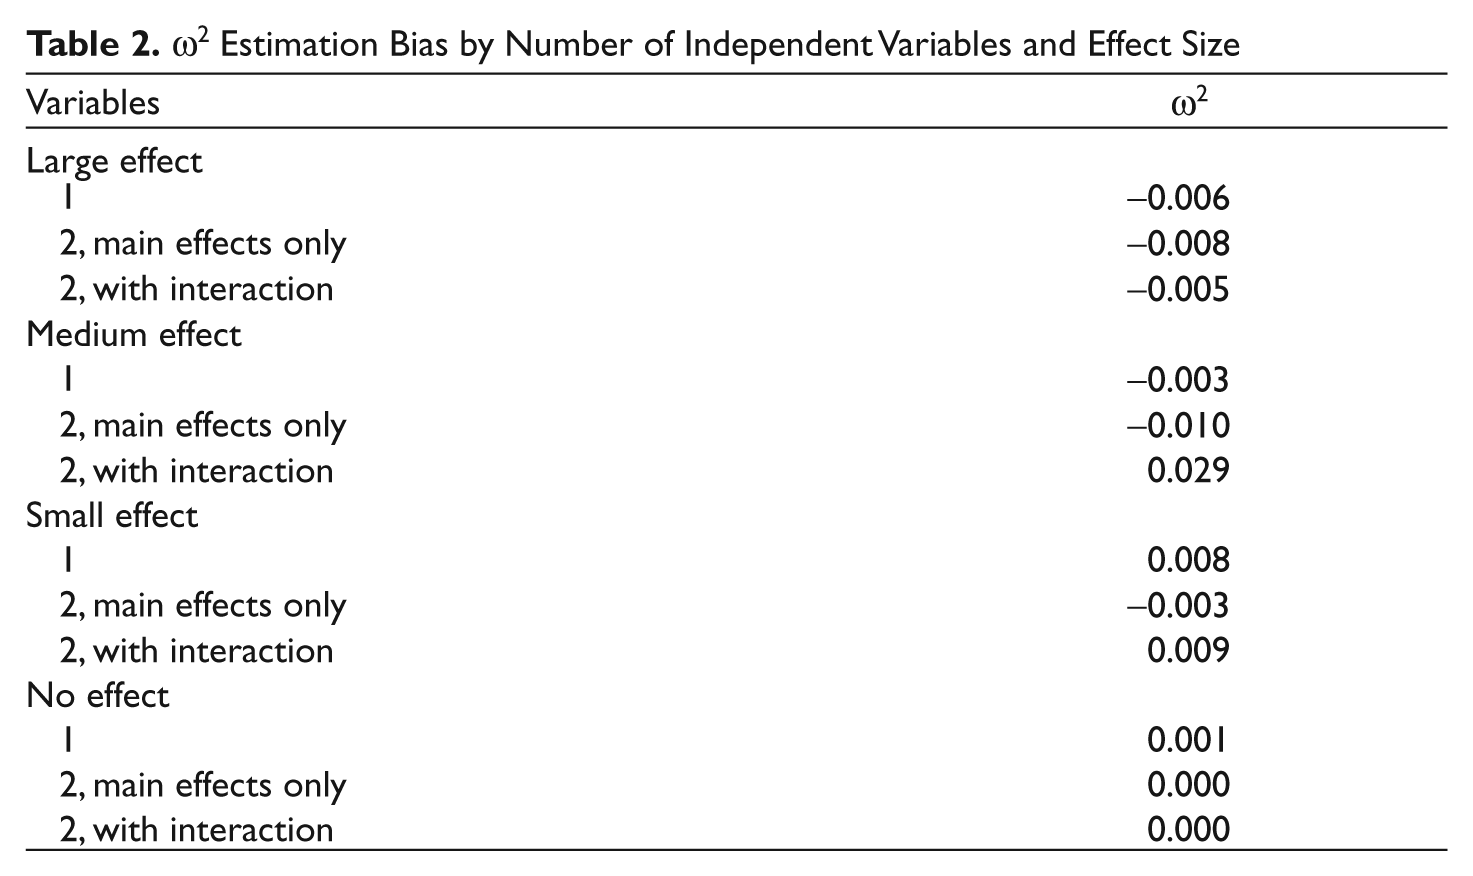
The bias in ω2 estimates by the number of significant independent variables and interactions by effect size appear in Table 2. For the medium effect size, the estimate of ω2 was biased upward when a significant interaction was present and biased downward in the presence of another main effect but no interaction. No other conditions displayed estimation bias greater than 0.01. Because the variance inequality and number of groups conditions were not significantly related to confidence interval coverage rates, the estimates of ω2 under these conditions are not discussed here.
ω2 Estimation Bias by Number of Independent Variables and Effect Size
Confidence Interval Width
As well as bias in the estimate of ω2, coverage rates also can be influenced by the width of the intervals themselves. Because width results were highly similar across simulated effect sizes, only the no effect condition was examined here, with results appearing in Table 3. The widths for each method generally decreased as sample size increased across distributions. The percentile bootstrap confidence interval was consistently the widest across nearly all the conditions for N of 50 or fewer, whereas the BCA displayed the next widest interval. In contrast, when the sample size was 100, there was essentially no difference in interval width for the three methods. In terms of distributions, those with higher kurtosis demonstrated slightly narrower confidence intervals for N of 20 or fewer but had comparable width for larger sample sizes. The confidence interval width by the number of terms in the model appears in Table 1. These results show that the narrowest confidence intervals occurred when there were two independent variables and a significant interaction between them. It is interesting to note that it was under this condition that the coverage rates for the three methods were at their lowest.
CI Width by Distribution and Sample Size for the No Effect Size Condition
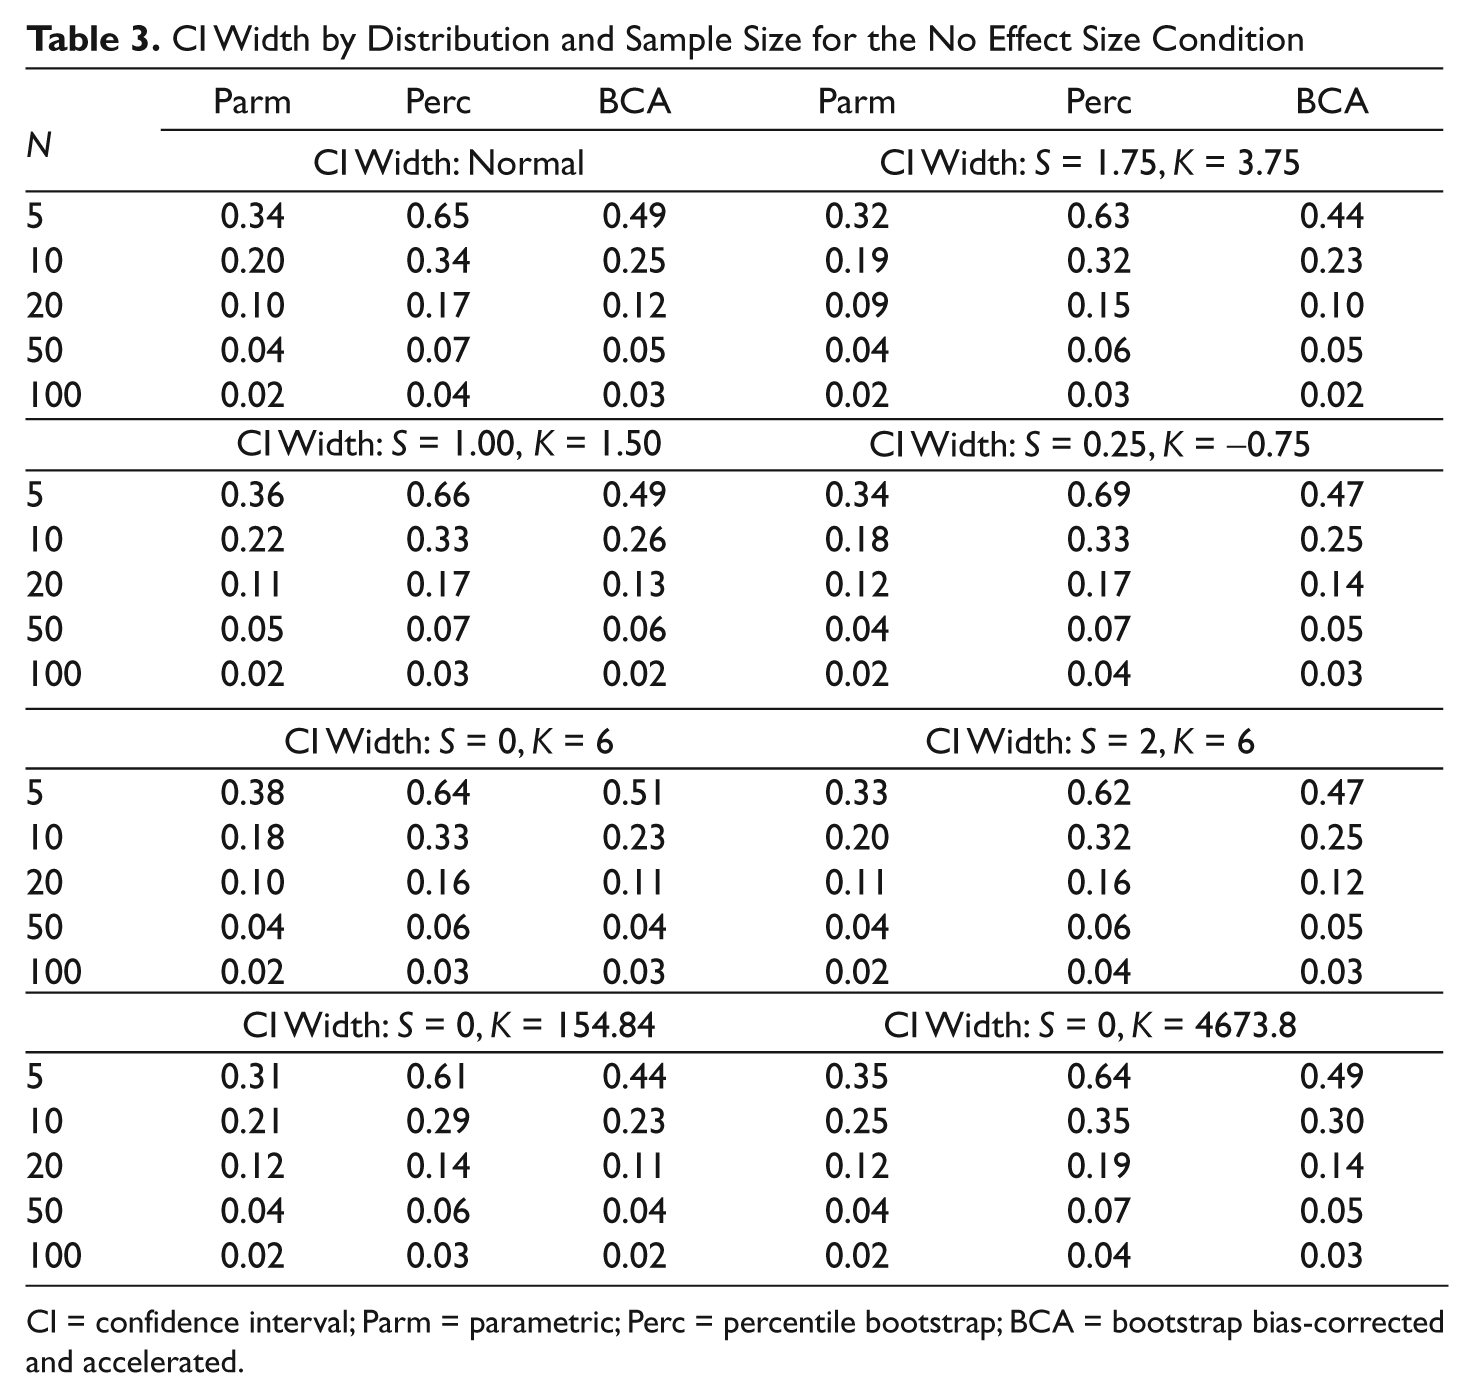
CI = confidence interval; Parm = parametric; Perc = percentile bootstrap; BCA = bootstrap bias-corrected and accelerated.
Discussion
Inclusion of effect sizes is becoming standard practice when reporting statistical significant tests in the social sciences. The suggestion has been made that confidence intervals for effect size values may be more useful than the simple point estimates (Steiger, 2004). Although comparisons of the performance of methods for calculating confidence intervals for Cohen’s d for the simple case of mean comparisons for two groups has been conducted (e.g., Algina et al., 2006; Kelley, 2005), empirical evaluation of the performance of methods for calculating intervals for ω2 has not been examined. This study took this next step in assessing these methods for confidence interval calculation for ω2.
A number of the results of this study are similar to those found in previous examinations of confidence intervals for Cohen’s d. For example, the coverage rate of the parametric confidence interval method was degraded in the presence of nonnormal data (Algina et al., 2006; Kelley, 2005). However, an unexpected outcome in the current study, given the results in Algina et al. (2006), is that the BCA approach for ω2 was generally not the best performer for nonnormal data. Unlike in the earlier study, for several of these nonnormal conditions, the parametric approach produced comparable coverage to the bootstrap alternatives, whereas for others the percentile bootstrap had clearly higher coverage rates. In relatively few instances did the BCA technique provide the best coverage. On the other hand, the BCA intervals were generally narrower compared with the percentile method, while providing better coverage than the parametric method in several instances. Therefore, this combination of typically having the second best coverage rates and the second best interval width in certain nonnormal cases may make the BCA an attractive alternative for researchers interested in calculating confidence intervals for ω2, despite the fact that it was rarely the best performer. Another unexpected result was that the coverage rates for all three methods were influenced by the inclusion of a second significant variable in a factorial ANOVA model. Thus, researchers need to be aware that the calculation of confidence intervals for one variable is not independent of other variables included in such a design. Finally, it appears that when data are not normally distributed, none of the three confidence intervals will provide coverage rates at the nominal level unless the sample size is 50 or higher, and the level of kurtosis is fairly low. This result is somewhat different from that reported in Algina et al. (2006) and Kelley (2005), in which the BCA approach was particularly effective in the presence of nonnormal data for the two groups problem. This outcome would speak to the need for researchers to be aware of how such distributions may differentially affect confidence interval calculation for more complex models.
Study Limitations and Directions for Future Study
We note that this study and the resultant recommendations are limited. For instance, we focused on balanced designs and fixed effects in the models we selected to simulate. Methods for examining standardized mean differences in more complex factorial designs are not as developed or well studied in comparison with the two groups and one-way design cases. However, this work should begin to move research forward for those more complex cases by providing some understanding of the accuracy of these three estimation methods under a variety of well-understood conditions for relatively simple models. Such information can provide the needed foundation to continue to study more complicated scenarios with an eye toward increasing the accuracy of effect size estimates. Such continued work, over time, should assist in improving tools we use to study group differences and accurately capture the magnitude of these differences.
Footnotes
The author(s) declared no potential conflicts of interest with respect to the research, authorship, and/or publication of this article.
The author(s) received no financial support for the research, authorship, and/or publication of this article.