
Abstract
This study integrated Bayesian hierarchical modeling and receiver operating characteristic analysis (BROCA) to evaluate how interest strength (IS) and interest differentiation (ID) predicted low–socioeconomic status (SES) youth’s interest-major congruence (IMC). Using large-scale Kuder Career Search online-assessment data, this study fit three models, the one-level BROCA, the two-level BROCA, and the ordinal Probit BROCA, to examine the moderating effects of gender and race/ethnicity. Both IS and ID displayed race/ethnicity differences in predicting low-SES females’ IMC. Gender difference was found only on IS in predicting low-SES youth’s IMC. Results suggested that low-SES White males and low-SES minority females may need help the most to develop stronger career interests and to differentiate their interests. This study illustrated that BROCA can be a powerful tool for test evaluation and utility analysis in the field because of its capacity of analyzing continuous, nominal, and ordinal data; its graphical nature of result presentation; multiple statistical test options; and its little requirement of Level 2 sample sizes.
Introduction
Instrument evaluation has recently gone beyond the traditional reliability and validity analysis and has developed into a holistic system incorporating external evidence from nomological information, criterion-based utility, and practical impact-based decision making analysis (Lissitz & Samuelsen, 2007). This study merges Bayesian inference and receiver operating characteristic analysis into the practices of educational measurement (American Educational Research Association, American Psychological Association, & National Council on Measurement in Education, 1999), test evaluation (Embretson, 2007), and utility analysis (Gorin, 2007; Lissitz & Samuelsen, 2007).
Receiver Operating Characteristic Curve
The receiver operating characteristic (ROC) curve graphically summarizes how accurately a diagnostic test distinguishes a characteristic group from a noncharacteristic group in a given population (Swets, Dawes, & Monahan, 2000). Consider a situation (McGee, 1979) where a large number of examinees from vocational-technical training programs have been tested on a spatial test battery. According to the administration records, their status of successfully passing the training is known. The two bell curves in Figure 1 indicate the distributions of the spatial test scores of the two groups, pass group and not-pass group. A given threshold constructs four proportions: True Positive (TP; the proportion of pass group members correctly identified), False Negative (FN; the proportion of pass group members falsely identified), True Negative (TN; the proportion of not-pass group members correctly identified), and False Positive (FP; the proportion of not-pass group members falsely identified). Using different thresholds will result in different pairs of (FP, TP).
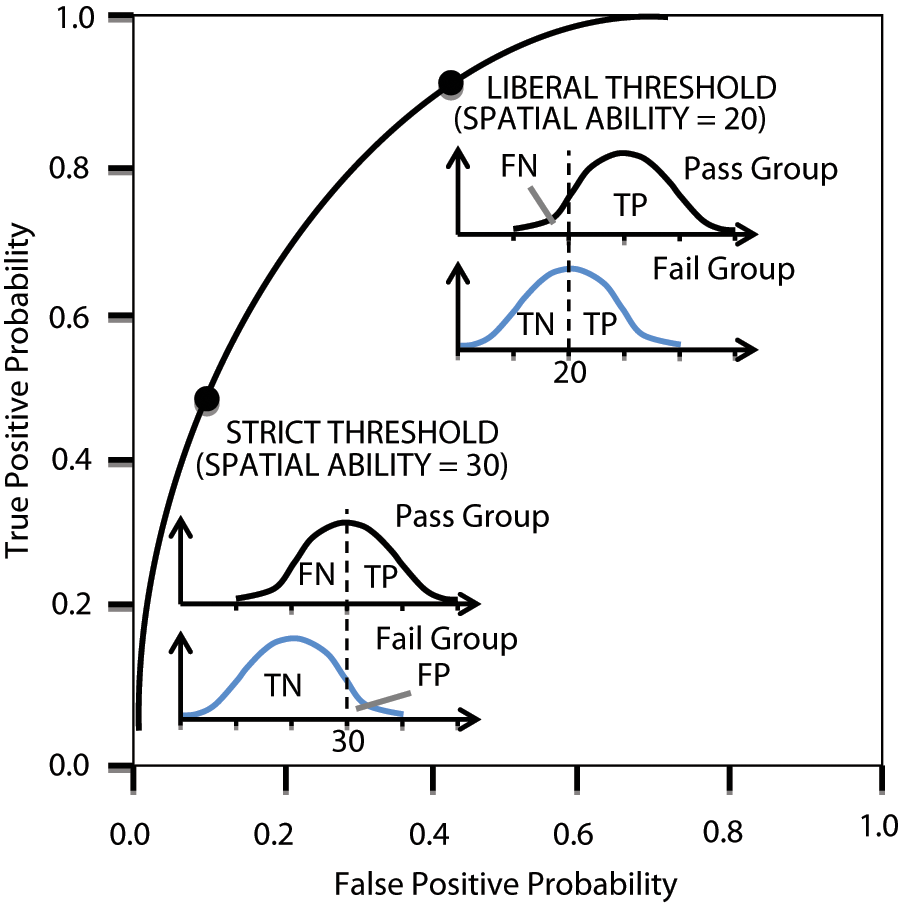
Receiver operating characteristic curve and (False Positive, True Positive) pairs given all diagnostic test score thresholds.
A pair of (FP, TP) obtained from a given threshold represents the classification accuracy of the diagnostic test for detecting program success. A perfect test should have a 100% TP and a zero FP, which is rarely possible to achieve in practice. An ROC curve reflects the trade-off between correct detection (TP) and false alarm (FP) when a diagnostic test has been used to classify examinees. This logic coincides with the usage of the statistical hypothesis test, in which the power (TP) will be optimized controlling for Type I error (FP) given the hypothetical value (the given threshold) on the statistic computed from sample data. Plotting FP values on the horizontal axis and TP on the vertical axis, one will obtain the trajectory, or an ROC curve (Swets et al., 2000) demonstrated in Figure 1. An ROC curve displays the diagnostic performance of a test on all legitimate cutoff points and can be used to compare tests and select the most powerful diagnostic instrument (Fawcett, 2003; Pepe, 2003).
A Short History of ROC Analysis
ROC analysis, originated in signal detection theory during World War II, has been applied into several fields and become a well-developed methodology. During the war, the ROC curve was used to evaluate how well a radar reader could detect enemy’s aircrafts on the radar screen with a high TP rate and a low FP rate (Green & Swets, 1966). In the 1950s, psychologists used ROC analysis to assess human cognitive processing ability (Tanner & Swets, 1954). Since the 1980s, ROC analysis has been widely used in the fields of computer engineering (Fawcett, 2003), radiologic imaging (Hanley, 1989; Metz, 1986), and medical testing (Pepe, 2000, 2003) for instrument evaluation and test utility analysis. The well-developed ROC methodology can analyze continuous measures (Pepe, 1998), ordinal data (Dorfman & Alf, 1968, 1969; Metz, 1986), and multilevel data (Gatsonis, 1995; Toledano & Gatsonis, 1995). It allows researchers to use categorical background variables (Pepe, 2000) to examine how covariates affect the ROC curve (Tosteson & Begg, 1988). Bayesian approach was successfully used in ROC analysis through the multivariate hierarchical transformation model (O’Malley & Zou, 2006).
Bayesian ROC analysis (BROCA), as illustrated in this article, has the potential to advance instrument evaluation and test utility analysis. Because of Bayesian approach’s hierarchical modeling nature (Gelman & Hill, 2007), prior information can be incorporated into lower level parameters and allow them to vary across higher level units to improve analysis accuracy.
Bayesian ROC Analysis and Test Utility Analysis
As one of the most active fields of educational measurement, career assessment research frequently examines the “congruence hypothesis” (Tracey & Robbins, 2006) and study interests’ predictive role in later educational/occupational satisfaction and performance (Swanson, 1993). Many methods, such as logistic regression and multivariate classification analysis techniques, have been used to study the prediction power of vocational interests (Hansen & Zytowski, 1979). For example, the ROC curve can be obtained through a logistic regression (Hosmer & Lemeshow, 1989) to study the moderating effect of demographic variables including gender and ethnicity.
The BROCA is different from the use of ROC curve in logistic regression. The ROC curve obtained in the logistic regression serves as an index of goodness-of-model-fit (Hosmer & Lemeshow, 1989) of the logit classification model. BROCA, as an independent methodology, can graphically depict each career interest variable’s prediction power rather than the performance of the entire model. Through the statistical significance test, BROCA evaluates whether the prediction power of a diagnostic measure varies across gender and/or ethnicity groups (Porter & Umbach, 2006).
In addition, BROCA allows researchers to include moderators, such as gender, to detect gender differences by testing if females and males have the same ROC curves. If the two gender groups have different ROC curves, it implies that the vocational interest instrument performs differently for men and women. BROCA’s hierarchical modeling nature can help researchers understand how vocational instruments perform differently across higher level demographic groupings such as racial groups. These forms of external evidence including gender and racial group differences can be incorporated into the test utility analysis corresponding with the emphasis on test impact evaluation (Lissitz & Samuelsen, 2007).
Theoretical Framework
The goal of using BROCA on career assessment data for test utility evaluation is to evaluate if the vocational interest can distinguish the interest-major-congruent (IMC) group (students whose vocational interests match their prospective major, or major they expect to later attain) and the interest-major-noncongruent (IMNC) group (students whose vocational interests do not match their prospective major) with high true positive (TP) rate and low false positive (FP) rate. Let D represent the IMC group and D* the IMNC group. The diagnostic measure Y is the interest strength, which is the largest score of the Kuder Career Search (KCS) vocational interest measures. Detailed operational definitions of the two groups and interest strength are discussed later in the Data Analysis section.
Statistical Inference for Test Utility Comparison
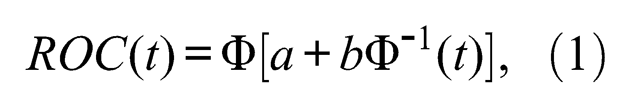
The statistical inference and comparison can be conducted through a Binormal ROC model (Green & Swets, 1966; Pepe, 2003). Suppose the interest strength scores of group D and group D* are normally distributed as
with
The area under curve (AUC) is used to evaluate the prediction power of an instrument and it is denoted in Binormal ROC model as
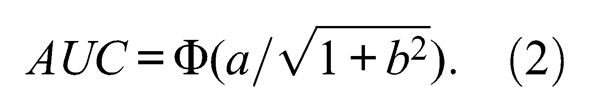
Previous research has suggested a rule of thumb for using AUC to evaluate the effectiveness of a classification model (Hosmer & Lemeshow, 1989). For example, AUC equal to or above .90 indicates an outstanding discrimination; AUC between 0.8 and 0.9 represents an excellent discrimination; AUC less than 0.8 but equal to or more than 0.7 represents an acceptable discrimination. In this study, a bigger area under the ROC curve indicates a better performance of interest strength in predicting interest-major congruence and distinguishing the IMC group and the IMNC group.
A chi-square test with two degrees of freedom on the estimated parameters of a and b of the binormal ROC model can be used for utility comparison between two tests (Metz & Kronman, 1980). The null hypothesis is: H0: a1 = a2; b1 = b2, and the chi-square test statistic is
Using large-scale career interest assessment data collected online from high school juniors and seniors students living in poverty, the next section illustrates how to use BROCA to estimate the Binormal model parameters and quantities including
Data Analysis
Sample and Participants
A random sample of 1,930 high school juniors (954, 49.4%) and seniors (976, 50.6%) were drawn from a large-scale archival database for this study. These students took the KCS vocational interest measure online to better understand their vocational interests. Participants were selected from those who lived in ZIP codes where the median household income was below the federal poverty level (Diemer, Wang, & Smith, 2010). These participants belonged to five racial/ethnic groups: American Indian/Alaska Native (AIAN, 256, 13.3%), African American (AA, 455, 23.6%), Asian/Hawaiian/Pacific Islander (AHPI, 273, 14.1%), Latino/a (483, 25.0%), and White (463, 24%). Their age ranged from 15.21 to 19.49 years (
Variables
Interest-major congruence
The outcome variable, interest-major congruence (Diemer et al., 2010; Hansen & Zytowski, 1979; Ihle-Helledy et al., 2004; Kelly, 2002; Tracey & Robbins, 2006), is a 0-1 binary measure with 1 indicating that students’ vocational interests match their prospective college major, 0 otherwise. The binary measure also conceptualizes participants group membership, that is, 1 indicates the participant belongs to the IMC (interest-major congruent) group and 0 the IMNC (interest-major not congruent) group. The observed frequencies of IMC and IMNC groups across these five racial/ethnic groups are the following: AIAN (N1 = 99, N0 = 155), AHPI (N1 = 135, N0 = 129), AA (N1 = 182, N0 = 267), Latino/a (N1 = 191, N0 = 260), and White (N1 = 208, N0 = 245).
Interest strength and interest differentiation
This study compared interest strength (IS) with interest differentiation (ID) in predicting the interest-major congruence. IS was measured by the largest of the six career interest scores on the KCS online assessment (Diemer et al., 2010). The six Kuder career clusters were Outdoor/Mechanical, Science/Technical, Arts/Communication, Social/Personal Services, Sales/Management, and Business/Retail (Zytowski, 2001). The possible range of an interest cluster score is 0 to 99. The descriptive statistics of IS across the five racial/ethnic groups are the following: AIAN (M = 85.57, SD = 9.71), AHPI (M = 87.52, SD = 9.15), AA (M = 84.86, SD = 9.17), Latino/a (M = 86.37, SD = 9.06), and White (M = 88.80, SD = 8.82). ID was conceptualized as the difference between the sum of the upper three interest cluster scores and the sum of the lower three interest cluster scores. A larger ID score indicates a more differentiated gap between what the participants are most interested in and what they are least interested in. The descriptive statistics of ID across the five racial/ethnic groups are the following: AIAN (M = 138.67, SD = 40.70), AHPI (M = 143.44, SD = 38.84), AA (M = 132.97, SD = 39.02), Latino/a (M = 138.50, SD = 38.72), and White (M = 152.55, SD = 41.39).
WinBUGS with the implementation of MCMC (Lunn et al., 2000; Spiegelhalter et al., 2003) was used to analyze the data. The computation and estimation were run using R (R Development Core Team, 2008). WinBUGS code can be requested through e-mail from the first author of this study.
Analysis 1: Single-Level BROCA Model
Parameter and model specifications
The one-level Binormal model was specified as
The priors of
Results of Analysis 1
The posterior parameter estimates (standard deviations) of
Analysis 2: Two-Level BROCA Model
Parameter and Model Specifications
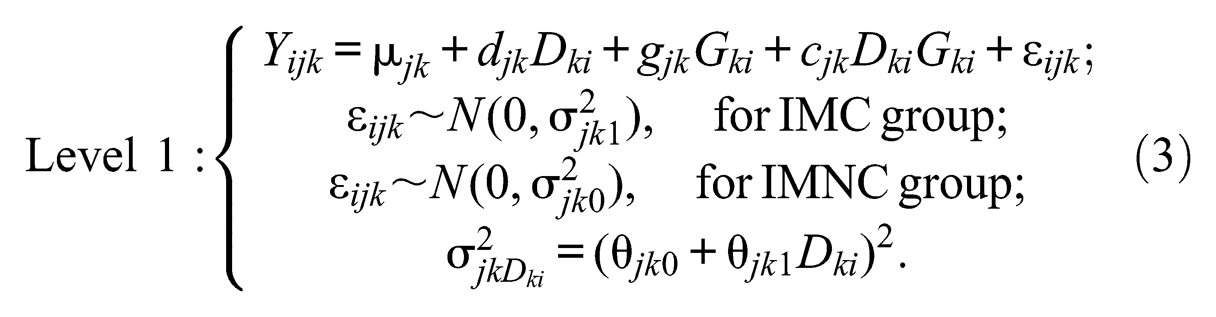
A two-level model was implemented to examine the moderating effects of gender and race/ethnicity. In this model, racial groups were treated as Level 2 units. The two-level BROCA model was written as
and
The jth career interest measure of the ith individual in racial group k was denoted as Y
ijk
, for i = 1, 2, . . . , n
k
; j = 1, 2, . . . , J; and k = 1, 2, . . . , K. n
k
was the kth racial group size. K was equal to 5, representing the five racial groups. In this study, J was equal to 2, representing the two career interest measures IS and ID.
The IMC group and the IMNC group had different residual variance parameters, which were indicated by the second and third equations of the Level 1 model in (3).
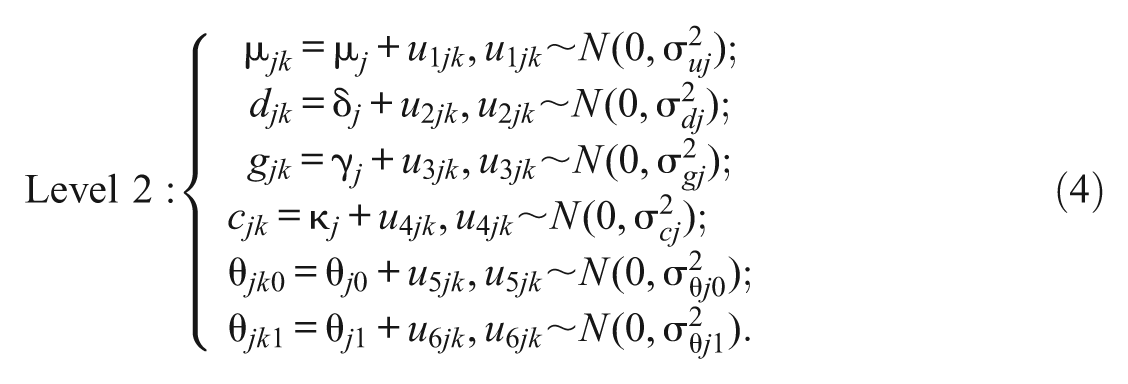
The Level 2 equations demonstrated how Level 1 parameters varied across racial groups. The random errors, u1jk, u2jk, u3jk, u4jk, u5jk, and u6jk followed normal distribution
Prior Distributions
The prior distribution of
Gender-Specific ROC Curves Across Racial Groups
In the Level 1 model, the coefficient of the interaction term (D ki G ki ) between gender and the interest-major congruence group membership variable resulted in two ROC curves: one for males and the other for females. The positive (negative) sign of the coefficient of the interaction term determined the positive (negative) gender effect. Visually, a positive gender effect pushes males’ ROC curve further to the left-above corner from females’ ROC curve. In turn, it increases the value of AUC and indicates a larger prediction power of the career interest measure for males. However, a negative gender effect indicates a higher prediction power for females and a larger AUC value of the ROC curve, which is closer to the left-above corner than the males’ ROC curve.
The Level 2 model allowed each racial group to have its own mean and residual variance. In turn, each racial group had two gender-specific ROC curves, reflecting the detailed micro differences of how IS or ID predicted interest-major congruence for males and females within the same racial group. The ROC curves for kth racial group was obtained through

ROC curves of interest differentiation by gender and race
Results of Analysis 2
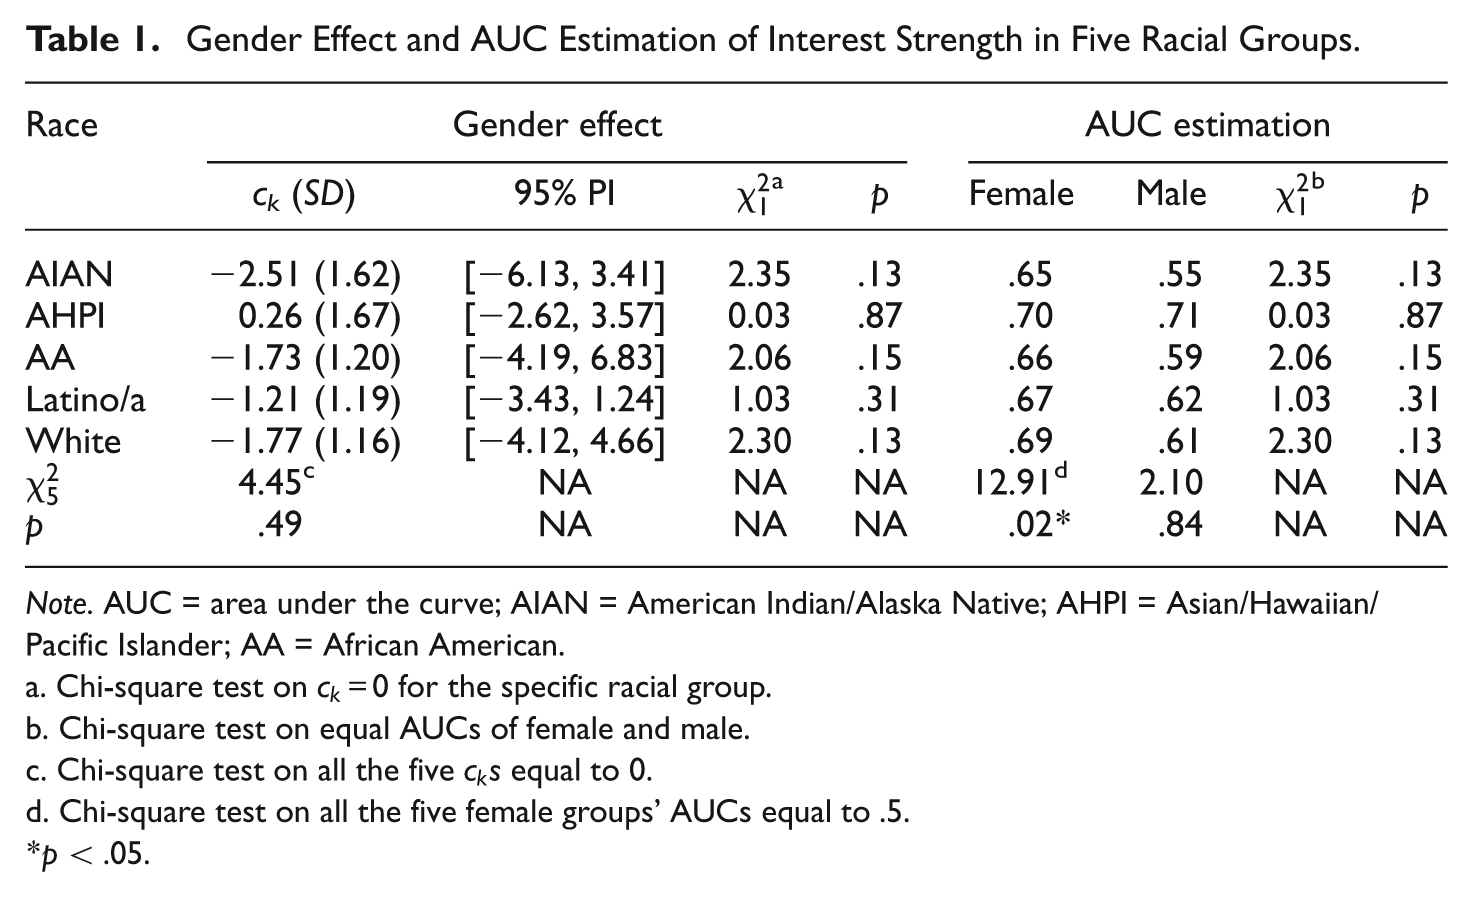
Gender and racial differences in career interest strength
Four of the five racial groups had negative coefficients of the interaction terms displayed in the second column of Table 1. The estimated gender effect of IS in each racial group was tested under the null hypothesis that each c
k
was equal to zero for k = 1, . . . , 5. None of the five chi-square tests were statistically significant. The results suggested that, within each racial group, there was no significant gender difference on IS in predicting interest major congruence. The holistic test that all c
k
s are 0 for k = 1, . . . , 5 was conducted. The result (
Gender Effect and AUC Estimation of Interest Strength in Five Racial Groups.
Note. AUC = area under the curve; AIAN = American Indian/Alaska Native; AHPI = Asian/Hawaiian/Pacific Islander; AA = African American.
Chi-square test on
Chi-square test on equal AUCs of female and male.
Chi-square test on all the five
Chi-square test on all the five female groups’ AUCs equal to .5.
p < .05.
For the purpose of cross-validation, a chi-square test was conducted for each of the five racial groups under the null hypothesis:
For each gender group, racial differences were tested under the null hypothesis that all five AUCs were equal to 0.5. The last two rows of Table 1 summarized the results. For low-SES females, the chi-square test rejected the null hypothesis (
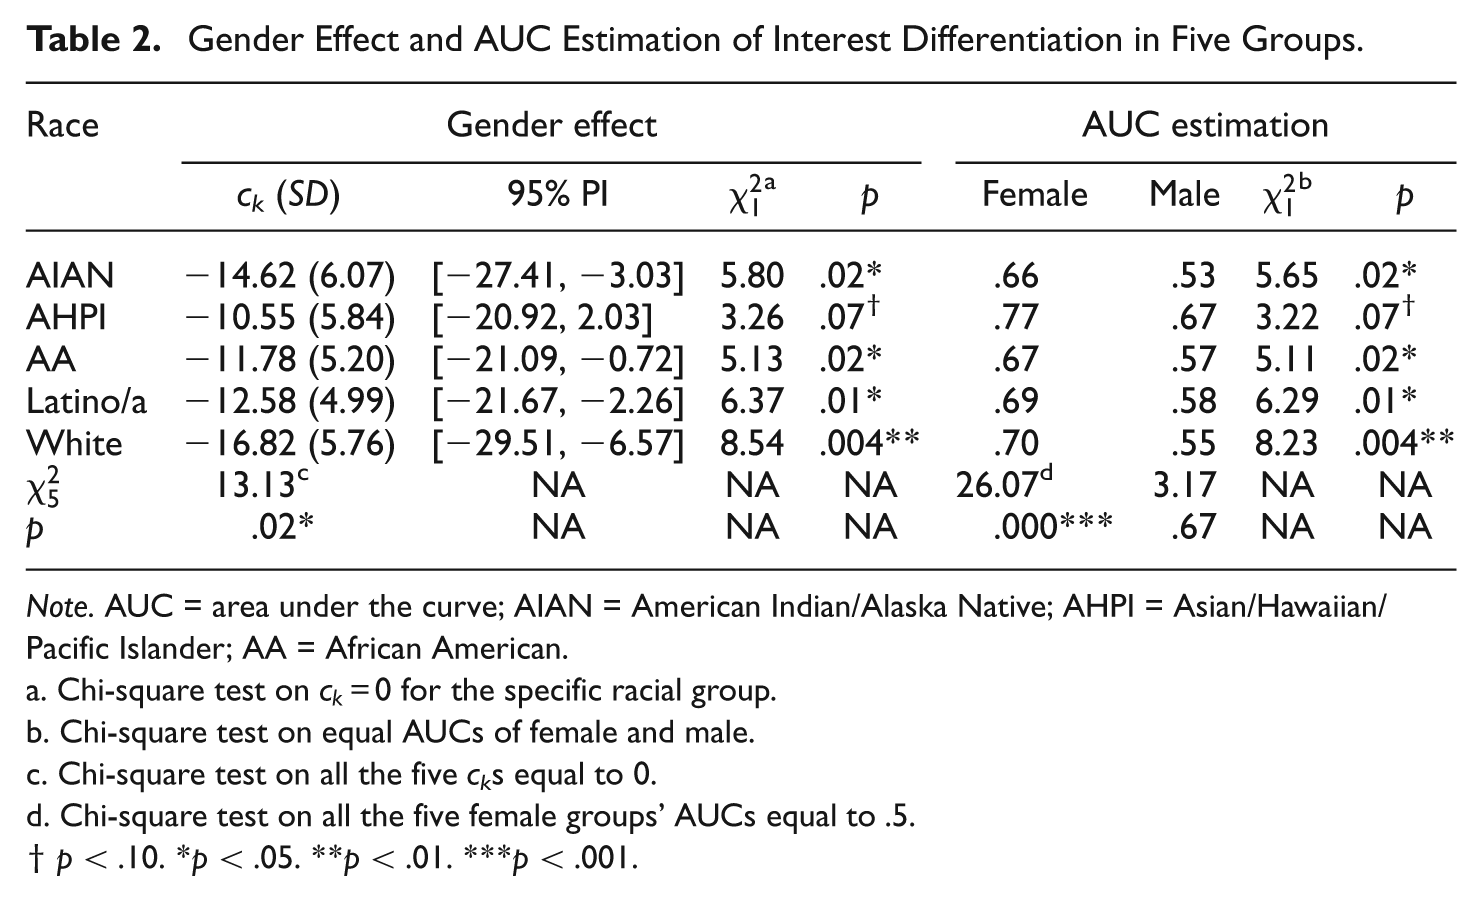
Gender and racial differences in career interest differentiation
All racial groups showed the negative gender effect indicated by the negative sign of the coefficient in the second column of Table 2. A holistic chi-square test under the null hypothesis that all gender effects were zero was conducted, namely H0: c
k
= 0, for k = 1, . . . , 5. The results (
Gender Effect and AUC Estimation of Interest Differentiation in Five Groups.
Note. AUC = area under the curve; AIAN = American Indian/Alaska Native; AHPI = Asian/Hawaiian/Pacific Islander; AA = African American.
Chi-square test on
Chi-square test on equal AUCs of female and male.
Chi-square test on all the five c k s equal to 0.
Chi-square test on all the five female groups’ AUCs equal to .5.
p < .10. *p < .05. **p < .01. ***p < .001.
The estimated negative gender effect of ID in predicting interest-major congruence was further tested for each racial group. The fourth column of Table 2 summarized the results of the five chi-square tests. Statistically significant negative gender differences were observed in four racial groups: the American Indian/Alaska Native group (
Similarly, the cross-validation chi-square test that females and males had the same AUC in a racial group indicated that interest differentiation had larger power in predicting low-SES females’ interest-major congruence—see the eighth and ninth columns of Table 2. The Asian/Hawaiian/Pacific Islander group had the highest values of AUC for both males (AUC = .67) and females (AUC = .77). In two groups, Asian/Hawaiian/Pacific Islander and White, the interest differentiation’s distinguishing power for females reached or surpassed the acceptable discrimination criterion .70 (Hosmer & Lemeshow, 1989).
For each gender group, racial differences were tested under the null hypothesis that the AUC values in the five racial groups were all equal to 0.5—see the last two rows of Table 2. The chi-square test rejected the null hypothesis (
Analysis 3: BROCA on Ordinal Data
Ordinal data
The large-scale online KCS system measured six interest clusters (Zytowski, 2001): Outdoor/Mechanical, Science/Technical, Arts/Communication, Social/Personal Services, Sales/Management, and Business/Retail. Six abbreviations, KOUT, KSCI, KART, KSOC, KSAL, and KBUS were used to represent the six Kuder interest clusters, respectively. Ordinal data were generated by ordering each student’s six interest scores of the six interest clusters. Higher rank indicated a student’s higher interest on a career cluster. For example, after sorting the six cluster scores in an ascending order, a student had the rank scores 2, 1, 5, 6, 3, and 4 for KOUT, KSCI, KART, KSOC, KSAL, and KBUS, respectively. This indicated that this student had the highest measured interests for Social/Personal Services careers and the lowest measured interests for Science/Technical careers.
Probit BROCA model
Let Y be the ordinal variable of a Kuder interest cluster. The observed ordinal responses of Y were hypothetically attributed to the latent variable (L) and corresponding thresholds (

This implied that, for example, Y took a value of 4 if the latent career interest score was between the third and the fourth thresholds (Metz, 1986; Pepe, 2000). The latent variable followed a standard normal distribution N(0, 1) for IMNC group and
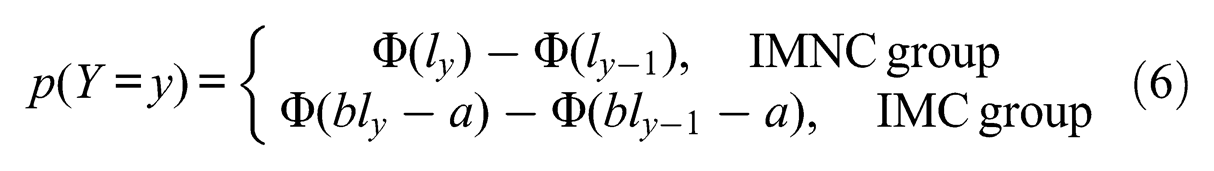
with y = 1, . . ., 6. Equations (5) and (6) specified the probit ordinal analysis model (Gelman & Hill, 2007).
Parameter estimation
This study used MCMC-based WinBUGS to estimate the parameters, rather than to solve the partial derivative joint functions of parameters (a, b,
The prior of each of the five thresholds was set up as N(0, 1) and constraints were used to force their correct order (
Results of Analysis 3
The estimated values of AUC were .54, .63, .51, .45, .47, and .40 for KOUT, KSCI, KART, KSOC, KSAL, and KBUS, respectively. Science/Technical Cluster and Outdoor/Mechanical Cluster had the first and the second largest estimated AUC among the six interest clusters. For the Science/Technical Cluster, the estimations (standard deviations) of the seven parameters,
Discussion
This study used the BROCA approach to examine the prediction power of the interest measures collected from KCS system in predicting low-SES youth’s interest-major congruence. Findings from this study have significant implications to methodogy research and to educational practices.
Implications for Assessment Methodology
Three analyses in this study demonstrated that BROCA as an innovative approach has several strengths: (a) capability to handle continuous measures, nominal background variables, and ordinal rank measures; (b) graphical nature of presenting assessment results for test utility comparison; (c) availability of disparate statistical evidence including chi-square tests and nonparameter “rules of thumb”; (d) fast computation of incorporating priors on multilevel parameters; and (e) little requirement for higher level sample sizes. Because of the small number of higher level units, traditional hierarchal modeling approaches (e.g., HLM) cannot be used in systematic evaluation for educational assessment involing heriarchically structured data. Lissitz and Samuelsen (2007) suggested to examine the practical utility analysis through hierarchical liner model to answer questions such as “Are the outcomes from the test predictive of outcomes in a desired domain?” (Lissitz & Samuelsen, 2007, p. 444). The Bayesian approach, by nature, is a hierarchical modeling method, where the use of hyperparameters captures the characteristics of the lower level of parameters. Using noninformative priors did ease the model fit process and lead to appropriate results, which are “equivalents” to the maximum likelihood estimates. Bayesian model’s parameter estimates can be plugged in the chi-square test for the validation analysis to examine the predictive power of the test and to demonstrate its utility on that purpose.
The MCMC estimation based chi-square test empowered the ROC method in evaluating test utility and impact analysis. Traditionally, statistical testing on ROC analysis depends on the central limit theory and the normal distribution approximation of each parameter estimator (Pepe, 2003). BROCA involves the more powerful chi-square test (Metz & Kronman, 1980) to evaluate a composite hypothesis to provide multiple sources of evidences for assessment evaluation. The MCMC-based estimation avoided traditional heavy computation of bootstrapping in estimating variances. WinBUGS with the implementation of MCMC algorithm naturally estimated the parameters and their covariance matrix for chi-square tests in assessment evaluation and utility analysis.
The BROCA solves one of the challenges in the external investigation on the impact of testing. This challenge is that scale-specific indices are not directly comparable with one another in the practices of educational and psychological assessment involving multiple scales and multiple measures (e.g., Tracey & Robbins, 2006). BROCA handles different types of measures to provide a scale-free index (i.e., AUC) for test utility and impact analysis. The MCMC-based BROCA evaluates instruments through multiple-group comparisons. The multiple-group-multiple-instrument comparisons can be naturally conducted in BROCA by incorporating dummy coded Level 1 and Level 2 group membership variables as demonstrated in this career interest example.
Implications for Assessment Practices
In assessment practices, the strengths of BROCA can help researchers differentiate various measures and identify the most preditctive measure. For instance, in this particular study, our results show that BROCA helps researchers explain how a career assessment instrument functions differently across higher level clusters such as racial groups, nations, and time points. Detailed comparisons between interest differentiation and strength across gender and race/ethnicity groups suggested that interest differentiation was more powerful than interest strength in predicting low-SES youth’s interest-major congruence. The interaction between race/ethnicity and gender indicated a micro differential test utility functioning, which suggested that race/ethnicity differences vary across gender groups and, similarly, gender difference varies across racial groups.
Our results suggested that interest differentiation had a higher level of impact than interest strength in examining the utility of test outcomes. The practical importance of the finding is that simply having a clear sense of what a student really likes to do (i.e., interest strength) is less predictive of congruence than a more nuanced understanding of what she/he likes and does not like (i.e., interest differentiation). One implication is that career guidance practitioners should help young people explore their vocational “likes and dislikes” rather than just focusing on helping young people identify one vocational domain that they are interested in.
In addition, micro differences on the prediction powers of educational measures with respect to demographic characteristics demonstrate the differential test utility functioning. In our study, the test utility differential functioning in terms of gender and race/ethnicity suggested that low-SES males, specifically, White, African American, and American Indian/Alaska Native males, may need extra help in selecting college majors congruent with their interests. However, low-SES females in the groups of African American, Latino/a, and American Indian/Alaska Native displayed disadvantages and may need more help. One implication of this finding is that when working with low-SES students, practitioners should also pay attention to specific rece/ethinicity-gender groups (e.g., low-SES White males), and helping them develop a more nuanced and comprehensive understanding of their vocational interests rather than focusing on the one domain they express the strongest interest in.
Limitations and Future Research
Findings of this study favored the use of continuous measures of career interests, rather than ordinal measures, although the Bayesian receiver operating characteristic analysis approach can handle both types of data. The continuous measure of interest differentiation revealed informative moderating effects of gender and race/ethnicity in predicting interest-major congruence. Using ordinal data, this study did not find either gender or race/ethnicity differences. This study found that the Science/Technical career interest measure was statistically better than the Outdoor/Mechanical career interest measure in predicting interest-major congruence. However, the results may not be generalizable because of the low prediction power of ordinal measures of career-clusters observed in this study.
Conducting BROCA can be challenging for test evaluation and utility analysis in practice. For example, selecting appropriate priors for the hyperparameters can be difficult and programming in WinBUGS can be time consuming. For the highly skewed nonnormal measures, data transformation is needed to approximate normal distribution using Box-Cox method (O’Malley & Zou, 2006). However, composite measures such as the variance or the standard deviation of students’ career interest scores (Tracey & Robbins, 2006) require more complicated transformation methods to conduct BROCA. In-depth literature review and simulation studies on data transformation will be needed in future research. Alternative ROC estimation approaches such as semiparametric method (Cai, 2004) have been developed, but future research is needed to examine if and how these alternative approaches can be applied into test evaluation and utility analysis in educational measurement.
Footnotes
Acknowledgements
Declaration of Conflicting Interests
The author(s) declared no potential conflicts of interest with respect to the research, authorship, and/or publication of this article.
Funding
The author(s) disclosed receipt of the following financial support for the research, authorship, and/or publication of this article: This study is based on work supported by a Kuder, Inc. research grant awarded to the first and the second authors.