



Abstract
Whittaker, Chang, and Dodd compared the performance of model selection criteria when selecting among mixed-format IRT models and found that the criteria did not perform adequately when selecting the more parameterized models. It was suggested by M. S. Johnson that the problems when selecting the more parameterized models may be because of the low variance of the discrimination parameters used to generate the data. This simulation study reproduced the Whittaker et al. study by incorporating more variability in the discrimination parameter estimates used to generate the data. The results indicated that the majority of the criteria performed more accurately when selecting the more parameterized models. Differences among the criteria performance under certain conditions and implications for model selection practice are discussed.
Model selection methodology has begun to be examined more widely in the item response theory (IRT) arena. Simulation studies in this area have investigated the performance of various model selection indices when selecting among dichotomous IRT models (Kang & Cohen, 2007) and polytomous IRT models (Kang, Cohen, & Sung, 2009). More recently, Whittaker, Chang, and Dodd (2012) examined the performance of various model selection criteria when selecting among mixed-format IRT models. The mixed-format IRT models combined dichotomous IRT models, including the three-parameter logistic (3PL; Birnbaum, 1968), two-parameter logistic (2PL; Birnbaum, 1968), and one-parameter logistic (1PL) or Rasch (Rasch, 1960) models, with polytomous IRT models, including the partial credit (PC; Masters, 1982) and the generalized partial credit (GPC; Muraki, 1992) models. Their results indicated that the likelihood ratio test (LRT), Akaike’s information criterion (AIC; Akaike, 1973), the sample corrected AIC (AICC; Hurvich & Tsai, 1989), and Hannon and Quinn’s (1979) information criterion (HQIC) generally performed well except when correctly selecting the more parameterized IRT models. Given that the AIC has a history of selecting more parameterized models, this finding was unexpected by the authors.
M. S. Johnson (personal communication, April 16, 2012) suggested that the counterintuitive findings may be because of the low variance of the discrimination parameter estimates used when generating the data and that the effects of this should be examined by increasing the variance of the discrimination parameters such that half of the discrimination parameters be set equal to an extremely low value (i.e., .50) while the remaining half of the discrimination parameters be set equal to an extremely high value (i.e., 2.50). More homogeneous discrimination parameters would lead to the selection of the most parsimonious models in which the discrimination parameter is constant (i.e., the PC, 1PL, and 1PL/PC models). This pattern was demonstrated by the Bayesian information criterion (BIC; Schwarz, 1978) and Bozdogan’s (1987) consistent AIC (CAIC) in Whittaker et al. (2012). The tendency of the remaining model selection criteria (viz., LRT, AIC, AICC, and HQIC) to have incorrectly selected the 2PL and 2PL/GPC models as compared with the 3PL and 3PL/GPC models, respectively, may have also been because of homogenous discrimination parameters. More specifically, the less parameterized 2PL model may have fit better, as assessed by the model selection criteria, than the more parameterized 3PL model because there was variability in only two of the three parameters estimated in the 3PL model, including the guessing parameter and the difficulty parameters. Thus, the purpose of this article is to examine the performance of the model selection criteria used in Whittaker et al. (2012) when selecting among mixed-format IRT models with more variable discrimination parameters.
Method
A simulation study was conducted that duplicated the Whittaker et al. (2012) study with the exception of varied discrimination parameters to determine if low discrimination parameter variance was the factor that contributed to the less than satisfactory performance of the model selection criteria when selecting the more parameterized, generating IRT models. Conditions that were varied, as in the original study, included sample size, proportion of dichotomous and polytomous items on the test, total score points, and generating mixed-format IRT model, which are briefly discussed subsequently (see Whittaker et al., 2012, for more detailed information concerning the manipulated conditions in their study).
Sample Size (N)
Sample size was varied in the Whittaker et al. (2012) study to reflect small (N = 500) and moderate (N = 1,000) sample sizes.
Proportion of Dichotomous and Polytomous Items
Five tests were created by means of dichotomous and polytomous item combinations. These combinations consisted of a percentage of dichotomously and/or polytomously scored items, which contributed to the total score points on the test. These five combinations included a baseline dichotomous test in which 100% of the items were dichotomously scored, a 60% dichotomously/40% polytomously scored test, an approximately 50% dichotomously/50% polytomously scored test, a 40% dichotomously/60% polytomously scored test, and a baseline polytomous test in which 100% of the items were polytomously scored. Whittaker et al. (2012) used the term approximately in the 50% dichotomously/50% polytomously scored test condition because each item type in this condition did not contribute an equal number of score points to the total score points on the test, which was also a varied condition.
Total Score Points on Test
Whittaker et al. (2012) manipulated the total score points on a test instead of manipulating test length directly. The total number of scores points attributed to dichotomously scored and/or polytomously scored items was either 26 or 50 points. Employing both 26 and 50 total score points on a test with each of the five proportions of item type combinations resulted in 10 distinctive tests with varying lengths.
Generating IRT Models
Whittaker et al. (2012) used three mixed-format IRT models as generating models, including the 1PL/PC, 2PL/GPC, and 3PL/GPC models. The 1PL/PC model was not employed as a generating model in the current study because it does not consist of a discrimination parameter and was accurately selected in the Whittaker et al. (2012) study. The remaining two mixed-format IRT models (viz., 2PL/GPC and 3PL/GPC) were employed as generating models because of the problems the model selection criteria encountered when attempting to differentiate between the baseline and/or mixed-format 3PL and the 2PL models (see Whittaker et al., 2012, for a description and equations of the IRT models employed).
Discrimination Parameter Variance
The 2000 NAEP in mathematics parameter estimates for Grades 4, 8, and 12 were used to generate the data in the Whittaker et al. (2012) study (see Whittaker et al., 2012, for more detailed information concerning the selection of generating parameter estimates). To increase the variance of the discrimination parameters associated with the items, two different methods were employed. One of the methods was recommended by M. S. Johnson (personal communication, April 16, 2012) in which the discrimination parameter values were set to extreme values. For the extreme discrimination method, the items were first sorted in ascending order with respect to their original discrimination parameter value. A median split was performed in which half of the items with the lower original discrimination parameter values were assigned a new discrimination parameter value equal to .50, whereas the remaining half of the items with the higher original discrimination parameter values were assigned a new discrimination parameter value equal to 2.50. When the number of items on the test was odd, the median item was randomly assigned a new low (.50) or high (2.50) discrimination parameter value. On average, the mean of the new extreme discrimination parameter values was 1.50 with a standard deviation of 1.00 in each condition.
The second method employed to increase the variability of the discrimination parameters was a linear transformation such that the mean of the discrimination parameters remained the same but the standard deviation was set to equal .50. The standard deviation value of .50 was obtained by examining a set of items from a national test and would, thus, render more realistic values of the discrimination parameters. Employing both methods increased the variability of the discrimination parameters substantially as compared with the original discrimination parameters (see Whittaker et al., 2012, for descriptive statistics of the original discrimination parameters and of the remaining parameters). These new discrimination parameters (extreme and realistic) were substituted for the original discrimination parameters in the Whittaker et al. (2012) study when generating the data.
Data Generation and Data Analysis
The SAS IRTGEN program (Whittaker, Fitzpatrick, Williams, & Dodd, 2003) was used to simulate item responses in each manipulated condition for each of the two generating baseline and/or mixed-format IRT models. The data were subsequently calibrated in PARSCALE version 4.1 (Muraki & Bock, 2003) with marginal maximum likelihood estimation according to the 1PL/PC, 2PL/GPC, and 3PL/GPC models. The five model selection criteria used in the Whittaker et al. (2012) study (viz., LRT, AIC, AICC, BIC, HQIC, and CAIC; see Whittaker et al., 2012, for a description and equations of the model selection criteria employed) for each of the models were calculated in SAS (version 9.2; SAS Institute Inc., 2007). The model selected by each of the five model selection criteria within each replication was recorded. Fifty replications in which all three IRT models converged were completed for the 2PL/GPC and the 3PL/GPC generated data sets.
Results
Parameter Recovery
Correlations between the generating and corresponding estimated parameters were computed to determine how well the parameter estimates were recovered in PARSCALE in each condition for each of the generating baseline and/or mixed-format IRT models. Correlations among the generating and corresponding estimated discrimination, difficulty, and guessing parameters for the 3PL model in the extreme discrimination conditions ranged from .87 to .97, .74 to .97, and .07 to .64, respectively. The correlations between generating and respective estimated discrimination, difficulty, and guessing parameters for the 3PL model in the realistic discrimination conditions ranged from .63 to .91, .91 to .99, and .10 to .78, respectively. The correlations among the generating and estimated discrimination parameters in the 3PL model are slightly higher whereas the correlations among the generating and estimated guessing parameters in the 3PL model are slightly lower in the current study than in the Whittaker et al. (2012) study.
Correlations among the generating and corresponding estimated discrimination and difficulty parameters for the 2PL model in the extreme discrimination conditions ranged from .97 to .99 and .98 to .99, respectively. The correlations between the generating and respective estimated discrimination and difficulty parameters for the 2PL model in the realistic discrimination conditions ranged from .92 to .97 and .98 to 1.00, respectively. These correlations, although slightly higher among generating and estimated discrimination parameters, are fairly similar to those in the Whittaker et al. (2012) study.
Correlations among the generating and corresponding estimated discrimination and step difficulty parameters for the GPC model in the extreme discrimination conditions ranged from .96 to 1.00 and .88 to 1.00, respectively. The correlations between the generating and respective estimated discrimination and step difficulty parameters for the GPC model in the realistic discrimination conditions ranged from .46 to .99 and .88 to 1.00, respectively. The correlations among generating and estimated discrimination parameters for the GPC model are somewhat higher in the current study as compared with those in the Whittaker et al. (2012) study.
Model Selection
When the data were generated according to the GPC model in the baseline 0% dichotomously/100% polytomously scored conditions (regardless of discrimination parameter variability), all the model selection criteria performed perfectly, correctly selecting the GPC model over the PC model in 100% of the 50 replications in the current study. In comparison, the BIC and CAIC, as well as the HQIC in small sample size conditions, had difficulty correctly selecting the GPC model in the Whittaker et al. (2012) study.
When the data were generated according to the 2PL model in each of the baseline 100% dichotomously/0% polytomously scored conditions with extreme discrimination parameter variability, all five of the model selection criteria performed well, correctly selecting the 2PL model in at least 94% of the 50 replications. When data were generated with realistic discrimination parameter variablity in the baseline 100% dichotomously/0% polytomously scored conditions, the AIC, AICC, BIC, and HQIC correctly selected the 2PL model in at least 96% of the 50 replications. The CAIC correctly selected the 2PL model in 76% of the 50 replications when sample size was low and total score points were equal to 26, yet correctly selected the 2PL model in 100% of the 50 replications in the remaining sample size and total score point combinations. The LRT correctly selected the 2PL model in 96% and 86% of the 50 replications when sample size was low and total score points were equal to 26 and 50, respectively. However, the LRT correctly selected the 2PL model in 78% and 50% of the 50 replications when sample size was high and total score points were equal to 26 and 50, respectively. In the Whittaker et al. (2012) study, the BIC and CAIC demonstrated problems in some of these conditions by incorrectly selecting the 1PL model when not selecting the 2PL model. The LRT similarly demonstrated less than satisfactory performance in the large sample size scenarios by incorrectly selecting the 3PL model when not selecting the 2PL model in Whittaker et al. (2012).
When the data were generated according to the 2PL/GPC model in the mixed-format test conditions with extreme discrimination parameter variability, all the model selection criteria correctly selected the 2PL/GPC model in at least 86% of the 50 replications. When data were generated with realistic discrimination parameter variability, the AIC, AICC, and HQIC performed well, correctly selecting the 2PL/GPC model in at least 98% of the 50 replications. The BIC correctly selected the 2PL/GPC model in only 78% of the 50 replications when items were approximately 50% dichotomously/50% polytomously scored and sample size was low with 26 total score points, but correctly selected the 2PL/GPC model in at least 92% of the 50 replications in the remaining mixed-format conditions. The CAIC correctly selected the 2PL/GPC model in 40% and 76% of the 50 replications when sample size was low with 26 total score points under the approximately 50% dichotomously/50% polytomously scored and 60% dichotomously/40% polytomously scored conditions, respectively; however, the CAIC correctly selected the 2PL/GPC model in at least 96% of the remaining mixed-format conditions. The LRT correctly selected the 2PL/GPC model in at least 84% of the 50 replications in the low sample size conditions. In the large sample size conditions, the LRT correctly selected the 2PL/GPC model in at least 80% of the 50 replications when total score points was equal to 26, yet correctly selected the 2PL/GPC model in 72%, 70%, and 50% of the 50 replications under the 40% dichotomously/60% polytomously scored, approximately 50% dichotomously/50% polytomously scored, and 60% dichotomously/40% polytomously scored conditions, respectively. The BIC and CAIC tended to incorrectly select the less parameterized 1PL/PC model in small sample size conditions whereas the LRT tended to incorrectly select the more parameterized 3PL/GPC model in large sample size conditions in the Whittaker et al. (2012) study.
Results for the remaining conditions in which the generating model was the 3PL or the 3PL/GPC are presented graphically in Figures 1 through 8 in panel charts horizontally placed next to the results from Whittaker et al. (2012). This was done to better observe potential differences in the findings with increased discrimination parameter variability in the current study, particularly when selecting the more parameterized IRT models. In the 3PL generating baseline 100% dichotomously/0% polytomously scored conditions, the LRT and AIC were more accurate than the remaining criteria when selecting the 3PL model, particularly in the extreme discrimination parameter variance scenarios (see Figures 1 and 2). The AICC performed satisfactorily in large sample size conditions while the HQIC performed satisfactorily when total score points and sample size were both large when discrimination parameter variability was extreme whereas neither were markedly accurate when discrimination parameter variability was realistic. The BIC and the CAIC incorrectly selected the 2PL more frequently than the 3PL in all of the 3PL generating baseline conditions, regardless of discrimination parameter variability (see Figures 1 and 2). In the Whittaker et al. (2012) study, the model selection criteria tended to demonstrate low accuracy when selecting the 3PL model in the majority of conditions. Overall, the performance of the LRT, AIC, AICC, and HQIC improved with respect to 3PL selection accuracy as discrimination parameter variability increased in the current study. The performance of the BIC and CAIC did not improve with respect to 3PL selection accuracy in the current study; still, they did not incorrectly select the 1PL model in any of the 3PL baseline conditions when discrimination parameter variability was extreme or when sample size was large in the realistic parameter variability scenarios as they did in the majority of corresponding conditions in Whittaker et al. (2012).
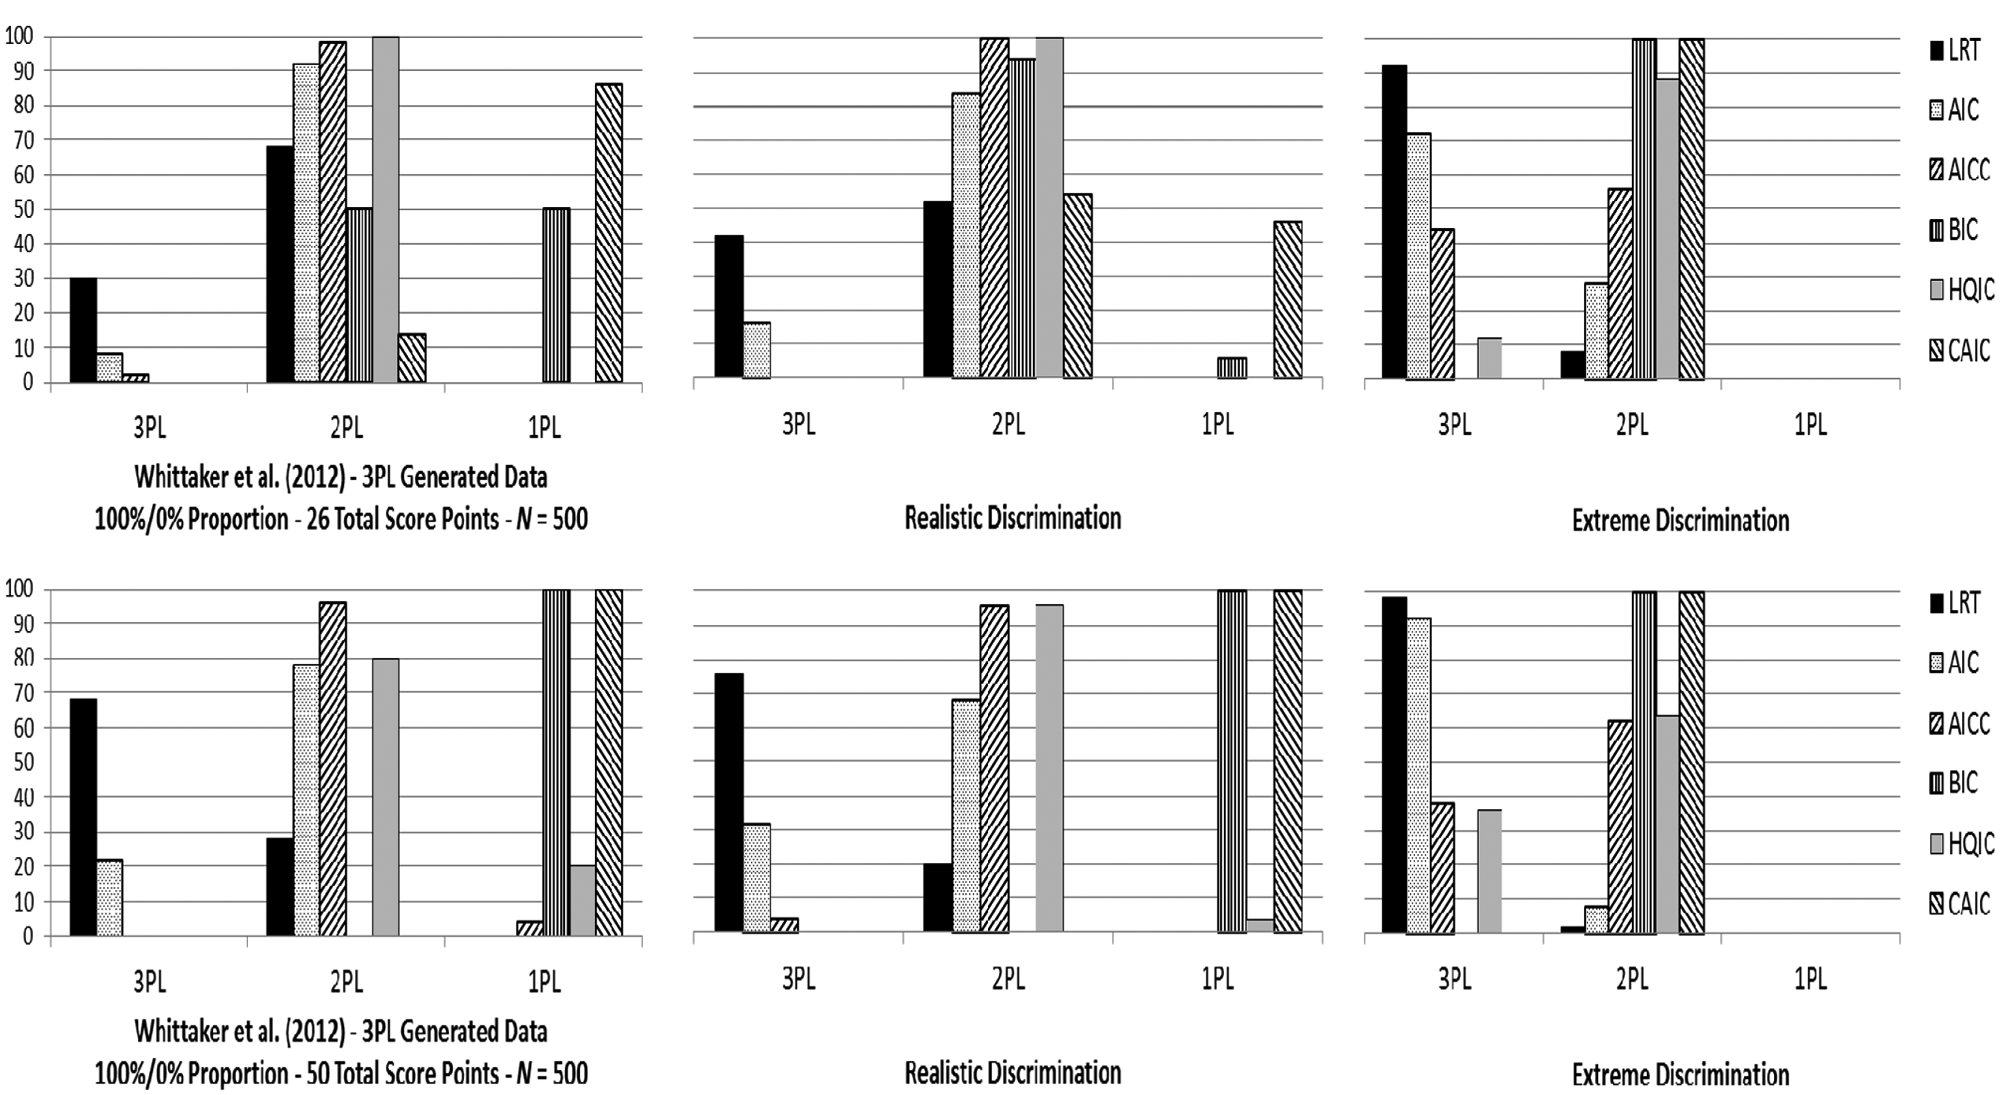
Percentage of times out of 50 converged replications each IRT model was selected by each model selection criterion with 3PL generated data in the 100% dichotomously/0% polytomously scored conditions by total score points for N = 500.

Percentage of times out of 50 converged replications each IRT model was selected by each model selection criterion with 3PL generated data in the 100% dichotomously/0% polytomously scored conditions by total score points for N = 1,000.

Percentage of times out of 50 converged replications each IRT model was selected by each model selection criterion with 3PL/GPC generated data in the 40% dichotomously/60% polytomously scored conditions by total score points for N = 500.

Percentage of times out of 50 converged replications each IRT model was selected by each model selection criterion with 3PL/GPC generated data in the 40% dichotomously/60% polytomously scored conditions by total score points for N = 1,000.
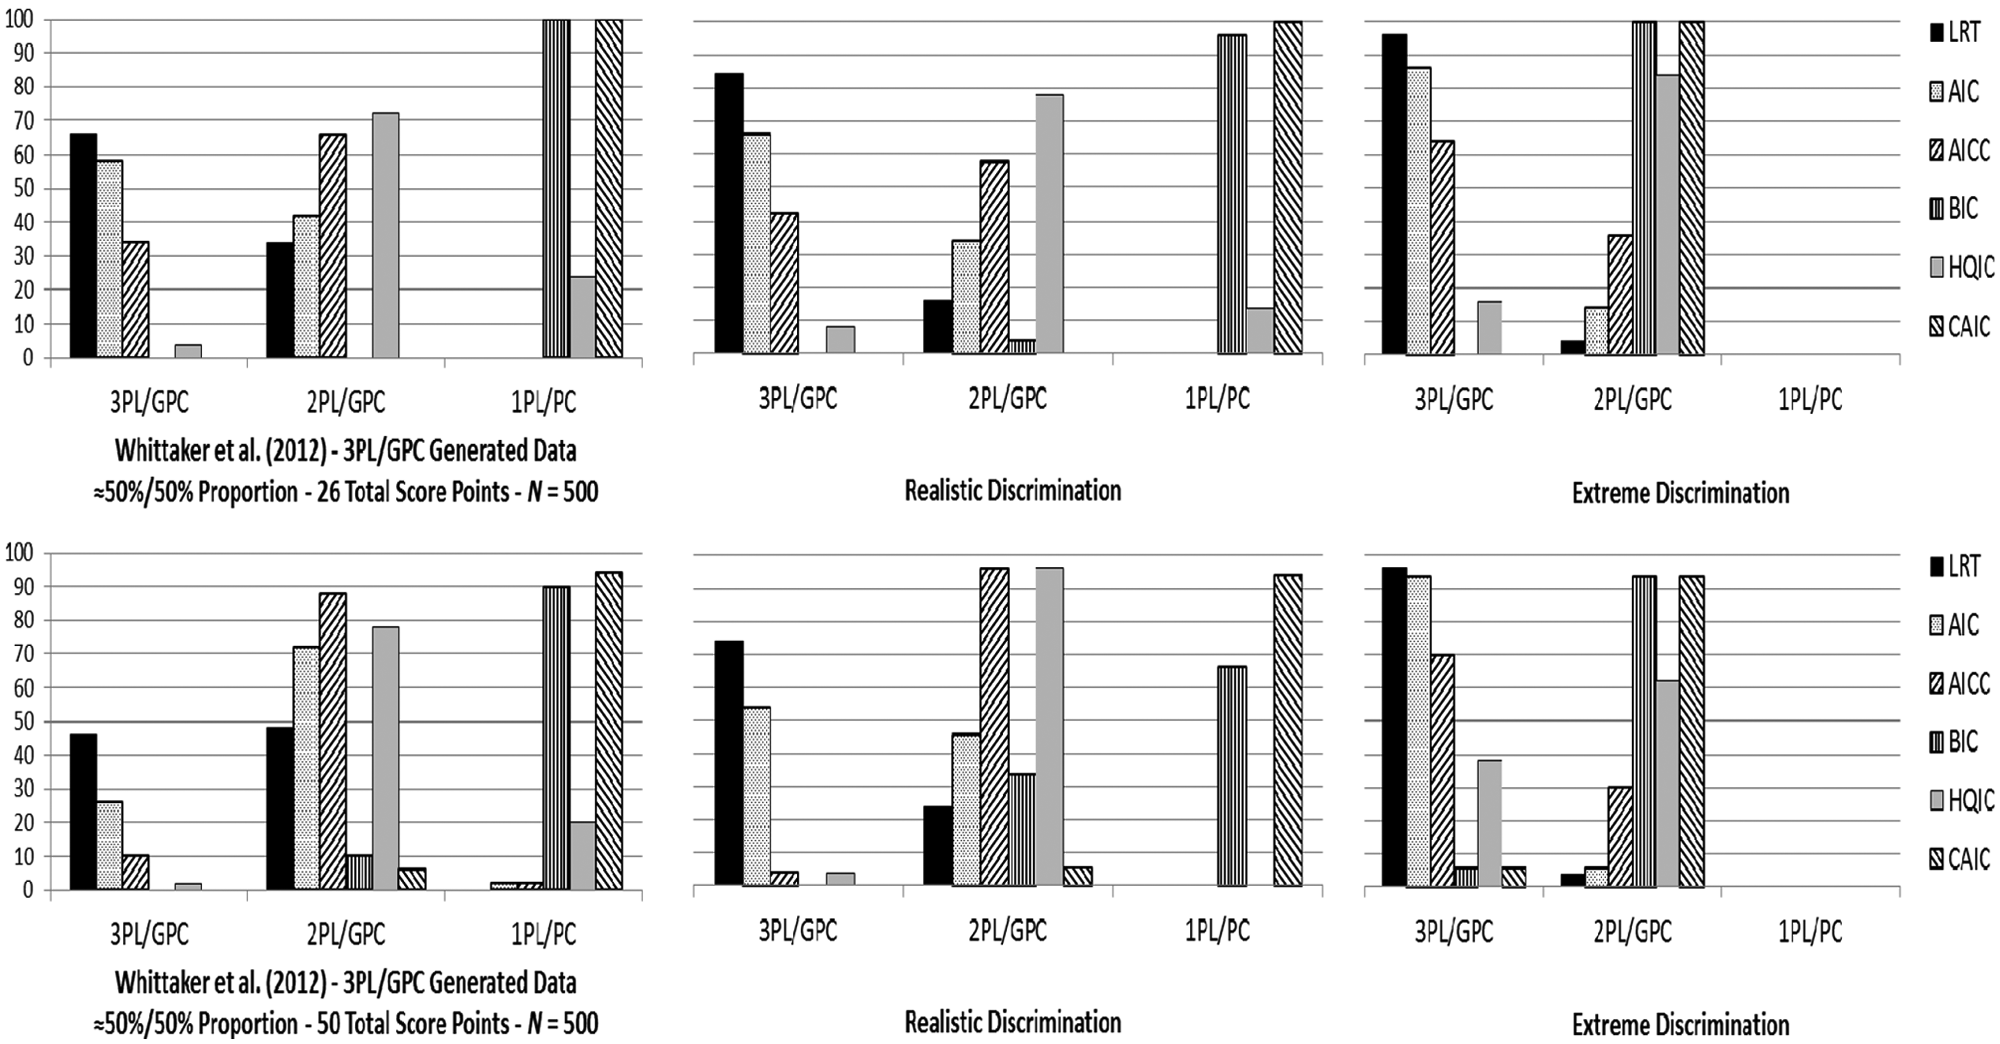
Percentage of times out of 50 converged replications each IRT model was selected by each model selection criterion with 3PL/GPC generated data in the approximately 50% dichotomously/50% polytomously scored conditions by total score points for N = 500.
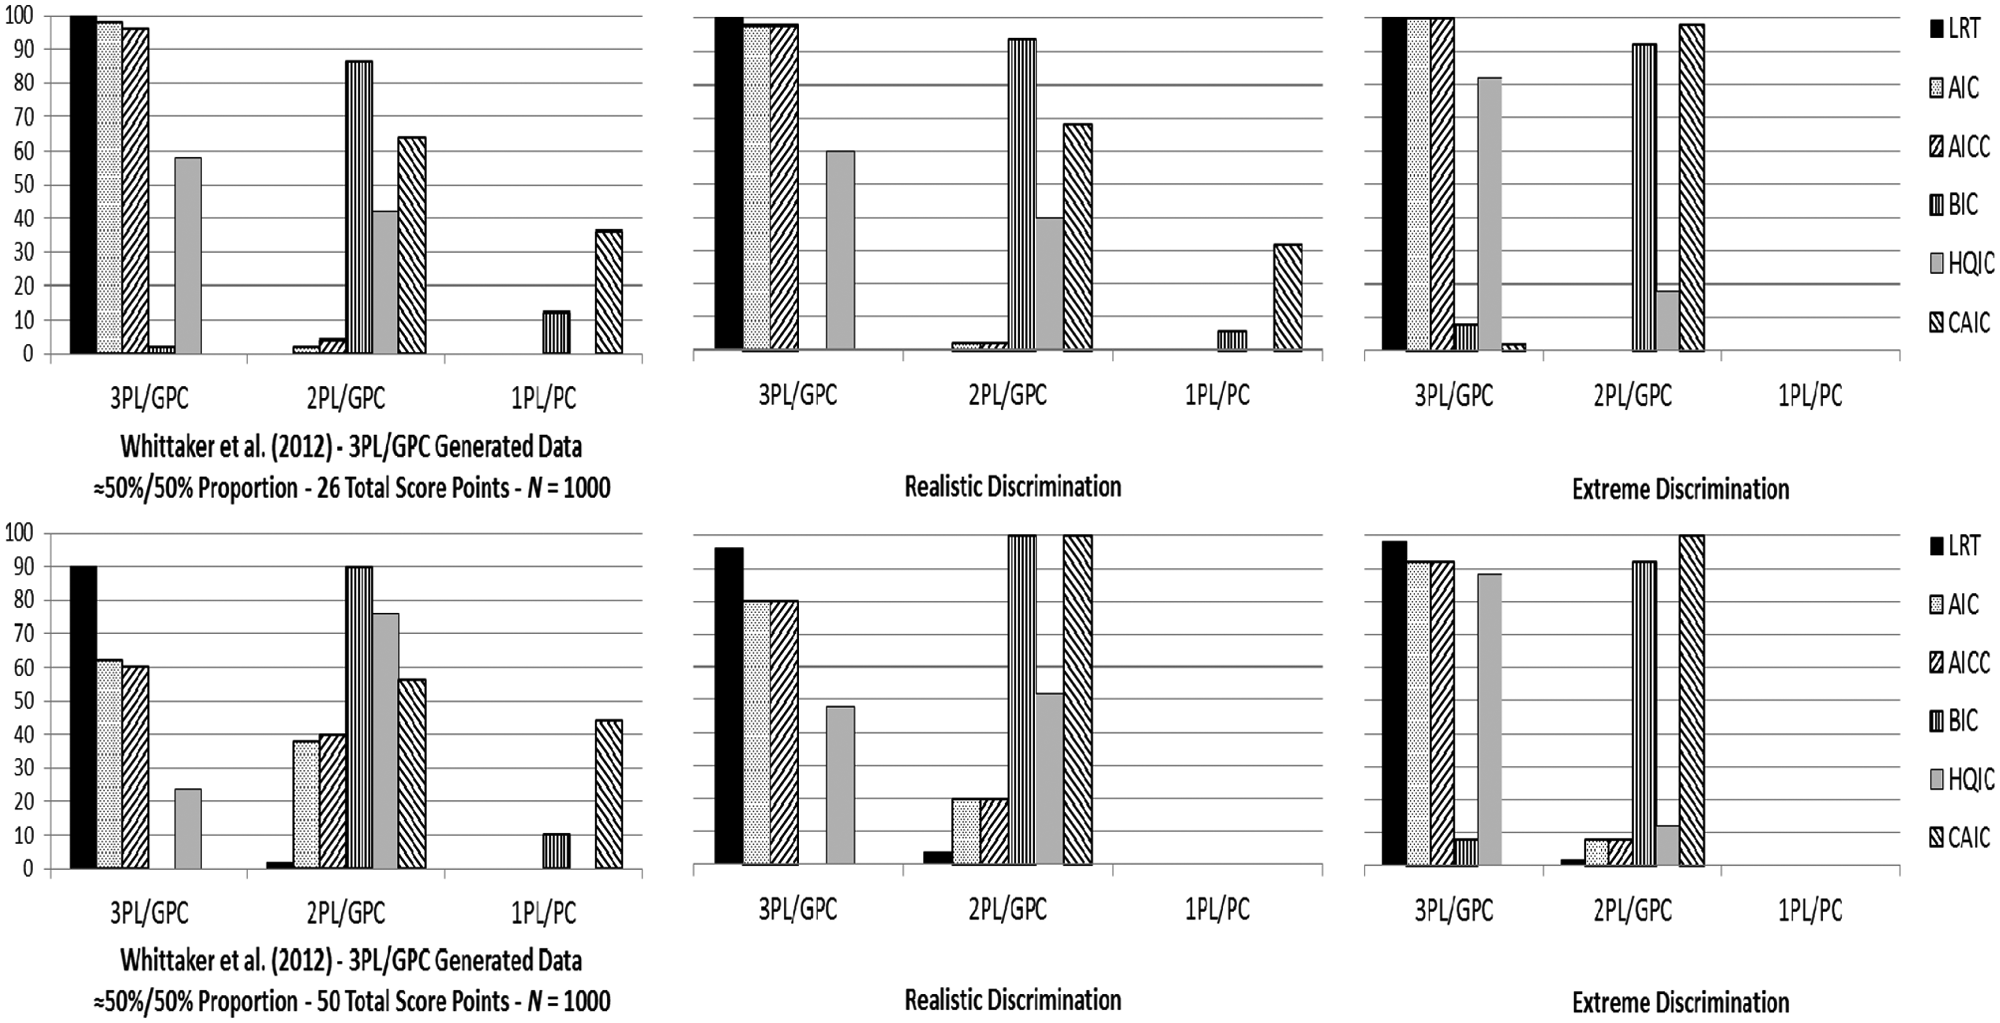
Percentage of times out of 50 converged replications each IRT model was selected by each model selection criterion with 3PL/GPC generated data in the approximately 50% dichotomously/50% polytomously scored conditions by total score points for N = 1,000.
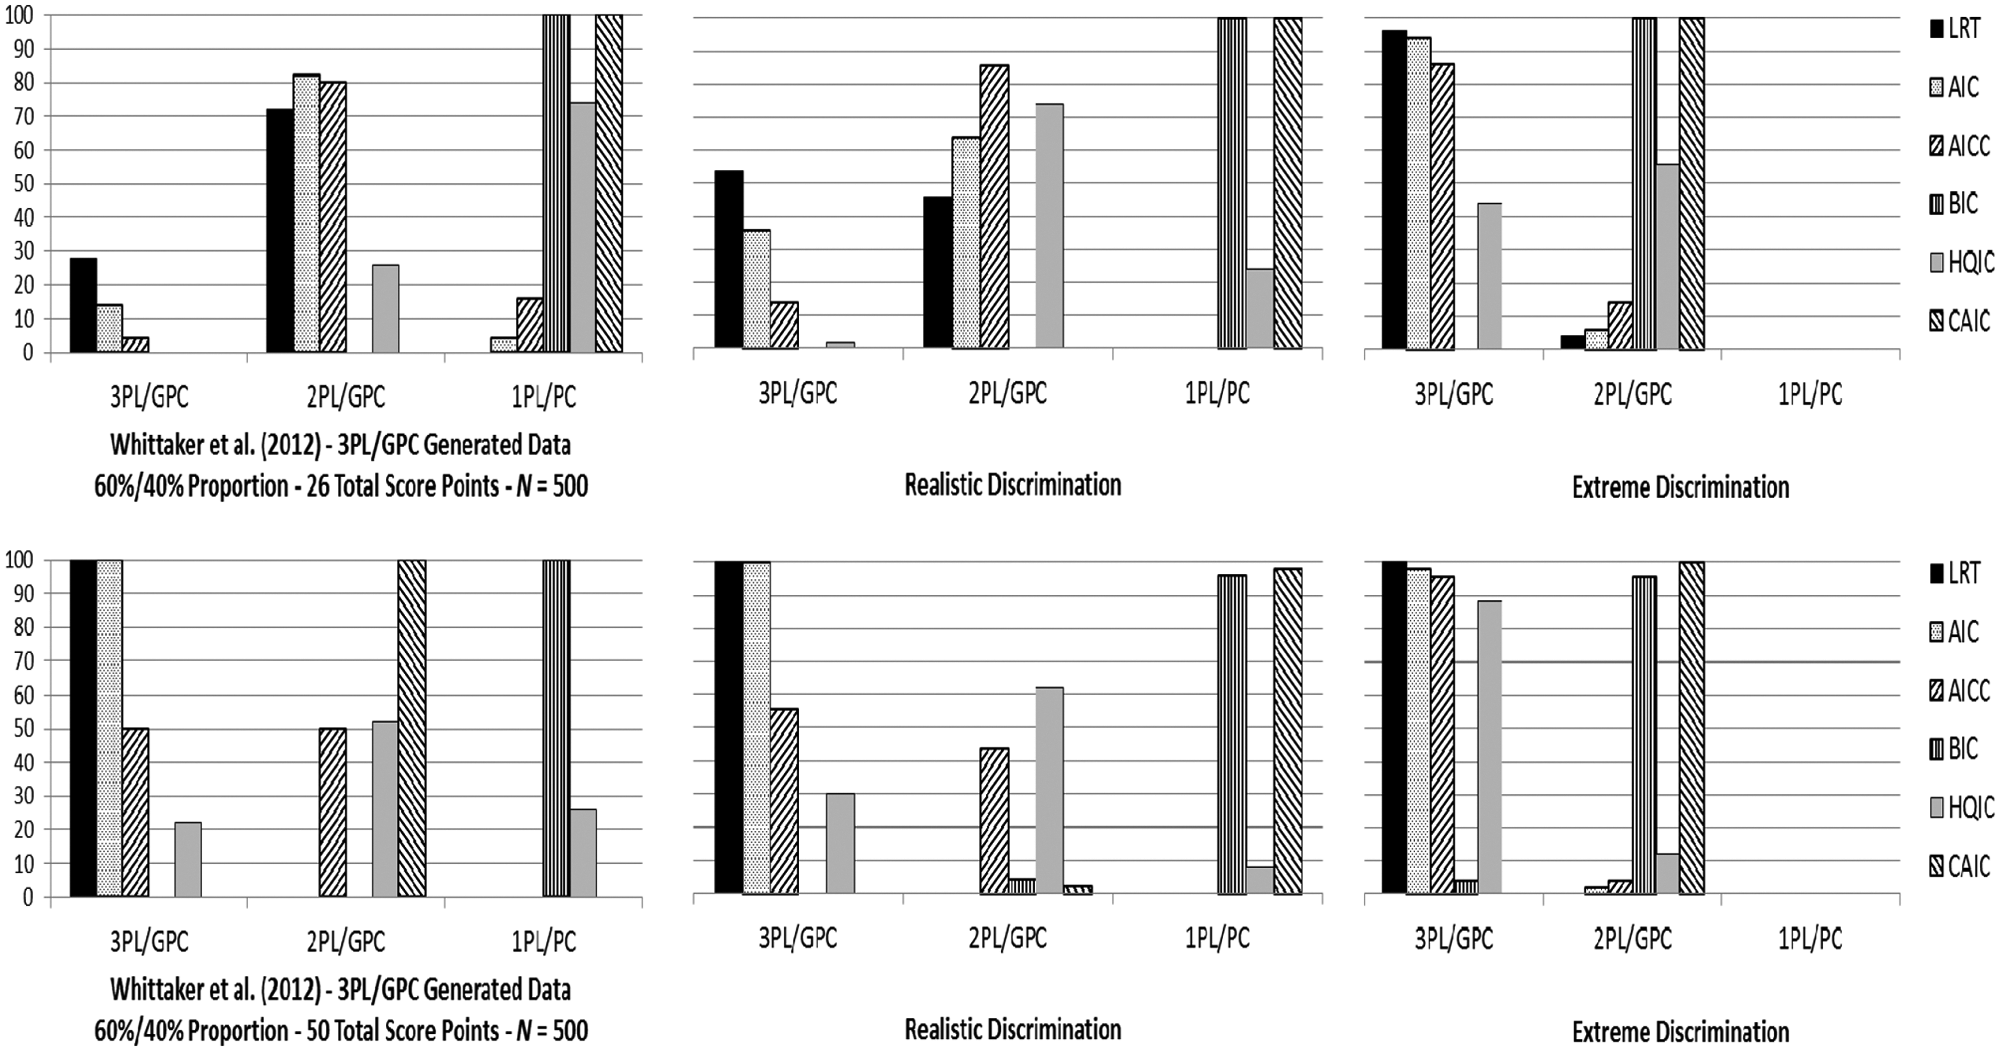
Percentage of times out of 50 converged replications each IRT model was selected by each model selection criterion with 3PL/GPC generated data in the 60% dichotomously/40% polytomously scored conditions by total score points for N = 500.
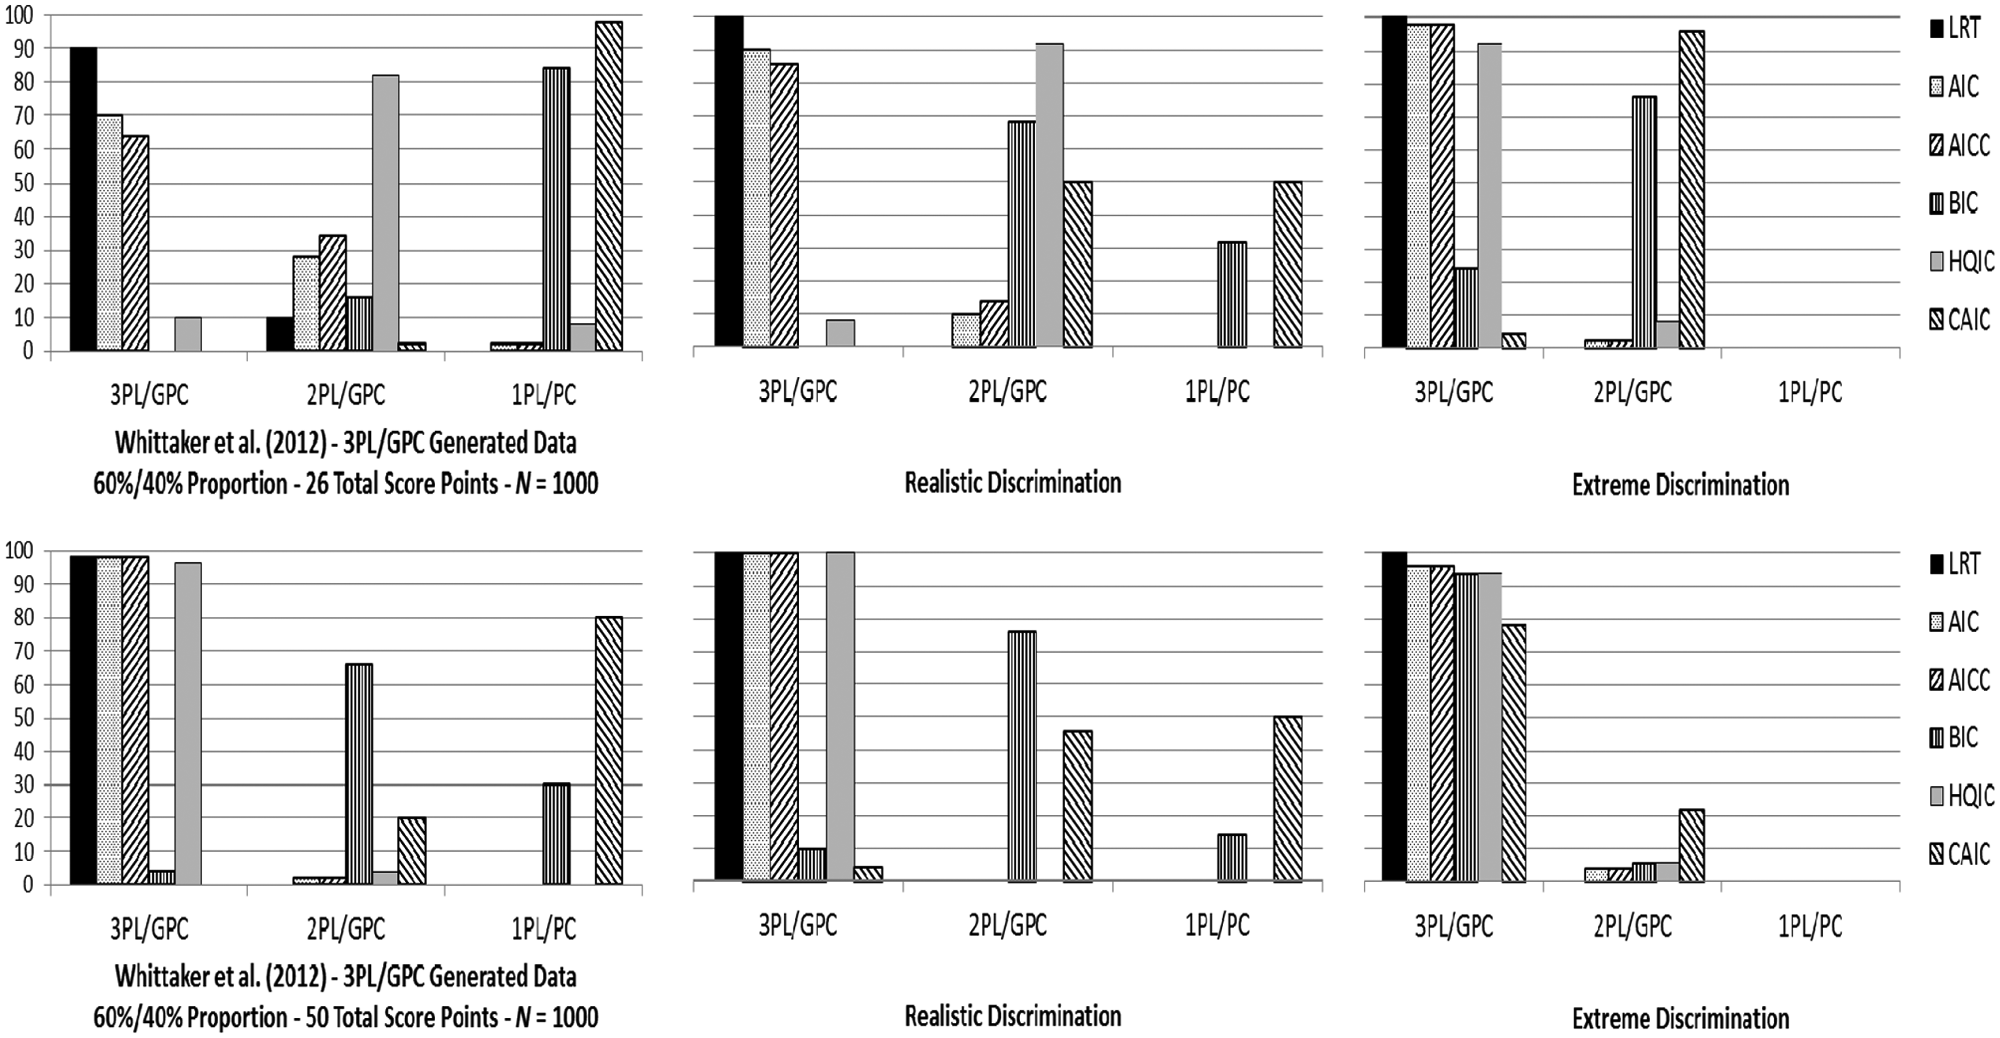
Percentage of times out of 50 converged replications each IRT model was selected by each model selection criterion with 3PL/GPC generated data in the 60% dichotomously/40% polytomously scored conditions by total score points for N = 1,000.
In the 3PL/GPC mixed-format conditions, the LRT and the AIC performed more accurately than the remaining model selection criteria, especially in the extreme discrimination parameter variability conditions (see Figures 2 through 8). Although the AICC was generally more accurate than the HQIC in these mixed-format conditions, the performance of the AICC and HQIC both tended to improve as sample size increased and as discrimination parameter variability increased. The BIC and the CAIC performed the worst of the model selection criteria with respect to accuracy. They tended to incorrectly select the 2PL/GPC model or the 1PL/PC model more frequently than the 3PL/GPC model in these mixed-format conditions and only performed satisfactorily in the 60% dichotomously/40% polytomously scored test condition when score points and sample size were large and discrimination parameter variability was extreme (see Figure 8). As demonstrated in Figures 2 through 8, the model selection criteria did tend to select the more parameterized models as discrimination parameter variability increased, though not necessarily accurately, in the current study than they did in Whittaker et al. (2012). That is, the LRT, AIC, AICC, and HQIC were inclined to accurately select the more parameterized 3PL/GPC model than the 2PL/GPC model whereas the BIC and CAIC were inclined to inaccurately select the 2PL/GPC model than the (also inaccurate) 1PL/PC model as discrimination parameter variability increased.
Discussion
This article replicated the study conducted by Whittaker et al. (2012) to assess the impact of varied discrimination parameters on the performance of model selection methods used to select among a set of mixed-format IRT models, particularly the more parameterized IRT models. Although similarities in the results from the current study and those from Whittaker et al. (2012) did exist, some disparities in the results were also observed. Similar to the Whittaker et al. (2012) study, the LRT, AIC, AICC, and HQIC performed better than the BIC and CAIC while the LRT and AIC, overall, were the top performers with respect to accuracy across the conditions examined with increased discrimination variance in the current study. Furthermore, the LRT, AIC, AICC, and HQIC (with a few exceptions) performed satisfactorily when selecting the GPC, 2PL, and 2PL/GPC models in both the current and Whittaker et al. (2012) studies.
Dissimilar from the findings in Whittaker et al. (2012), the BIC and CAIC performed with perfect or close to perfect accuracy with extreme discrimination parameter variability and performed reasonably well (with a few exceptions) with realistic discrimination parameter variability when selecting the GPC, 2PL, and 2PL/GPC models. Also distinctive from the Whittaker et al. (2012) findings, the LRT, AIC, AICC, and HQIC accurately selected the 3PL and 3PL/GPC models in the current study with increased discrimination variability. Although the BIC and CAIC did not accurately select the 3PL and 3PL/GPC models, they did tend to select the more parameterized 2PL and 2PL/GPC models with increased discrimination variability, respectively, than the more frequently selected 1PL and 1PL/PC models, respectively, in Whittaker et al. (2012).
Given that the variability of the discrimination parameters was the only modification to the Whittaker et al. (2012) study, the findings from the current study appear to support the suggestion that varied discrimination parameter values will aid in the selection of more parameterized models when they are the correct model within the set of comparison models. This is not to say, necessarily, that tests should include items with more varied discrimination parameters. The inclusion of items with high discriminatory power on a test is typically desired in order to better differentiate among those with different ability levels. In the end, the variability of the discrimination parameters are a function of the items included on the test.
The parameter estimates used to generate the data in Whittaker et al. (2012) and in the current study were taken from published parameter estimates on the NAEP exam in mathematics and, thus, reflect parameter estimates that may be observed in practice. Indeed, the discrimination parameters on the NAEP are not substantially large or heterogeneous. Some may argue that the NAEP is not a high stakes test, which may result in low motivation and, consequently, lead to biased parameter estimates (Wise, 2006) and that this is the basis of the poor model selection criteria performance, particularly in Whittaker et al. (2012). Whittaker et al. (2012) did add .40 to the NAEP discrimination parameters used for data generation to better reflect estimates that may be seen on high stakes tests (Pastor, Dodd, & Chang, 2002). Items with discrimination falling between values of .80 and 2.50 have been deemed as representing effective discriminatory power (de Ayala, 2009). Even with this adjustment, the discrimination values did not necessarily reach the higher values in this recommended range. Future research should continue to examine the impact of motivation on parameter estimates and how this, in turn, may affect model selection.
We recognize that the extreme discrimination parameter values in the current study do not represent parameter estimates necessarily observed in practice. They were set to markedly extreme values in order to assess the supposition that the homogeneity of the discrimination parameters was the factor that contributed to inaccurate model selection of the more parameterized 3PL and 3PL/GPC IRT models in Whittaker et al. (2012). The inclusion of the more realistic discrimination parameter values helped further demonstrate how correct model selection accuracy improves as the variability in the discrimination parameters increased.
It is important to note that although the increased variability of the discrimination parameters may aid in correct model selection, it may also result in complications with respect to parameter estimation. For instance, the running of numerous replications was required in order for all three of the IRT models to converge properly in all 50 replications per condition (see Tables 1 and 2). Thus, the increased heterogeneity of discrimination parameters may come at a price. In addition, we realize that if a model does not converge appropriately, it would denote that the particular model is not a suitable candidate model and should not be considered among the set of comparison models. Nonetheless, we required the proper convergence of all three models in each replication to perform fair comparisons across the model selection criteria, even though this resulted in ideal situations that may not be encountered by applied researchers.
Number of Replications Needed in Realistic Discrimination Conditions (and Extreme Discrimination Conditions) to Attain 50 Replications in Which All Three IRT Models Converged Properly in Each Test Condition as a Function of Proportion of Item Type and Total Score Points by Sample Size for the 3PL/GPC Generating Model.

Number of Replications Needed in Realistic Discrimination Conditions (and Extreme Discrimination Conditions) to Attain 50 Replications in Which All Three IRT Models Converged Properly in Each Test Condition as a Function of Proportion of Item Type and Total Score Points by Sample Size for the 2PL/GPC Generating Model.

In the baseline 0% dichotomously scored/100% polytomously scored conditions, the generating model is the GPC model, which results in identical outcomes if using either the 2PL/GPC model or the 3PL/GPC model as the generating model, which is why these values are the same as in Table 1.
It is also important to note that the impact of heterogeneous discrimination parameters should not be considered in isolation in practice. That is to say, the parameters estimated in the more parameterized 2PL and 3PL models interact with one another when determining the probability of responding to a certain item. For instance, when calculating the probability of responding correctly to an item under the 2PL model, the difference between the item’s difficulty and the person’s ability level is weighted by the item’s discrimination. In addition, as guessing associated with an item increases, the same item’s discrimination decreases, all things held constant, under the 3PL model (de Ayala, 2009). Thus, the interactions among parameters estimated in these models do have consequences during the estimation process which may yield different model selection outcomes (see, e.g., Yen, 1981). Therefore, future studies could evaluate the interaction between the parameter estimates on model comparison and selection methodology.
The findings from this study suggest that simpler IRT models may explain the relationships among items on a test just as well as more complex IRT models when parameter estimates are more homogeneous. The selection of an appropriate IRT model should not, however, be solely based on decisions made when employing model selection criteria. Instead, the selection of an appropriate model to explain the data with which one is working should also be based on other factors, including the reasonableness and stability of the parameter estimates as well as the purpose and use of the test.
Footnotes
Declaration of Conflicting Interests
The authors declared no potential conflicts of interest with respect to the research, authorship, and/or publication of this article.
Funding
The authors received no financial support for the research, authorship, and/or publication of this article.