
Abstract
Cognitive diagnostic computerized adaptive testing (CD-CAT) purports to combine the strengths of both CAT and cognitive diagnosis. Cognitive diagnosis models aim at classifying examinees into the correct mastery profile group so as to pinpoint the strengths and weakness of each examinee whereas CAT algorithms choose items to determine those strengths and weakness as efficiently as possible. Most of the existing CD-CAT item selection algorithms are evaluated when test length is relatively long whereas several applications of CD-CAT, such as in interim assessment, require an item selection algorithm that is able to accurately recover examinees’ mastery profile with short test length. In this article, we introduce the mutual information item selection method in the context of CD-CAT and then provide a computationally easier formula to make the method more amenable in real time. Mutual information is then evaluated against common item selection methods, such as Kullback–Leibler information, posterior weighted Kullback–Leibler information, and Shannon entropy. Based on our simulations, mutual information consistently results in nearly the highest attribute and pattern recovery rate in more than half of the conditions. We conclude by discussing how the number of attributes, Q-matrix structure, correlations among the attributes, and item quality affect estimation accuracy.
Keywords
Computerized adaptive testing (CAT) has been recently adopted by many high-stakes educational testing programs, such as the Graduate Management Admission Test (GMAT), the National Council of State Boards of Nursing (NCLEX), and the Armed Services Vocational Aptitude Battery (ASVAB). A CAT tailors the set of items to the examinee’s ability level, so that no examinee receives too many overly easy or difficult items. Consequently, CAT can provide more accurate latent trait estimates using fewer items than required by Paper and Pencil tests (e.g., Weiss, 1982). Traditional CAT selects items to gain general information about a single, continuous latent trait. Alternatively, cognitive diagnosis assessment (CDA) aims to determine whether or not examinees have each of many attributes or skills underlying responses to test items. Unlike traditional CAT, CDA informs the specific cognitive skills required for designing effective remedial interventions in formative instruction (Cui, Gierl, & Chang, 2012, Leighton & Gierl, 2007). Models proposed to facilitate diagnostic assessment (Rupp, Templin, & Henson, 2010) include the rule-space model (Tatsuoka, 1983), Bayesian inference networks (Mislevy, Almond, Yan, & Steinberg, 1999), latent trait models (Yamamoto, 1989), and restricted latent class models such as the Deterministic Input; Noisy And gate (DINA) model (Haertel, 1989; Junker & Sijtsma, 2001), Noisy Input; Deterministic And Gate (NIDA) model (Maris, 1999), and the Deterministic Input, Noisy Or Gate (DINO) model (Templin & Henson, 2006).
Although statistically sound and substantially useful models provide an infrastructure for cognitive assessment, combining cognitive diagnostic models (CDM) with adaptive procedures (so-called cognitive diagnostic computerized adaptive testing [CD-CAT], Cheng, 2009, Huebner, 2010) facilitates their practical and realistic implementation. A version of CD-CAT has already been applied in determining whether or not students possess specific skills (Jang, 2008). In the past decade, many traditional item selection algorithms have been adapted for CD-CAT, including the Kullback–Leibler (KL) Information Index (Xu, Chang, & Douglas, 2003), the Shannon entropy method (Xu et al., 2003), and the posterior weighted KL Index (PWKL, Cheng, 2009), among others. One method yet to be adapted to cognitive diagnosis settings is based on mutual information. Mutual information was recently proposed by Weissman (2007) for continuous trait-based classification testing and generalized by Mulder and van der Linden (2010) and Wang and Chang (2011) for use in multidimensional CAT. Mutual information has been shown to be more efficient than competing item selection methods, such as those based on KL-information and Shannon entropy, especially for short tests.
The objective of this article is to introduce a mutual information method for use in CD-CAT and evaluate its performance against the KL Index, the PWKL Index, and the Shannon entropy method, the three most widely used methods for CD-CAT (Huebner, 2010; Liu, You, Wang, Ding, & Chang, in press). The mutual information index, as originally proposed, requires several difficult and computationally demanding calculations. Therefore, we also derive a simplified calculation method intended to greatly reduce computational intensity.
The rest of the article is organized as follows. First, we discuss the CDM used in this study and introduce the three existing item selection algorithms for CD-CAT. Next, we introduce the mutual information method as applied to CDMs and derive a computationally simplified formula. We then evaluate the mutual information method (using simplified formula) against the existing item selection algorithms via two simulation studies. Finally, we discuss consequences of the simulation results and provide suggestions for further research.
The DINA Model
In cognitive diagnosis, one attempts to identify the tasks, subtasks, cognitive processes, and/or skills involved in responding to items on an assessment. Each task or skill is generally referred to as an attribute. The attributes of a math test might include, for example, converting mixed numbers to improper fractions, finding a common denominator, or multiplying fractions. Typically, content experts determine the attributes required for correct item responses. The general purpose of cognitive diagnosis is to identify which attributes each examinee has mastered based on the examinee’s responses.
A critical component underlying almost all cognitive diagnosis models is the Q-matrix (Tatsuoka, 1995), which links individual items with one or more of the attributes. Given a set of J test items and K total attributes, the element in row j and column k of the Q-matrix should be 1 if item j requires attribute k, and 0 otherwise. Researchers typically assume that the Q-matrix is constructed by subject matter experts and test developers, but, in practice, the development of the Q-matrix using these means has proven to be quite time consuming and costly (Roussos, Templin, & Henson, 2007). As a result, de la Torre (2008) and Liu, Xu, and Ying (2012) have recently proposed to estimate the Q-matrix using statistical methods.
One commonly used cognitive diagnosis model is the DINA model (Haertel, 1989; Junker & Sijtsma, 2001). The DINA model assumes that, in principal, an examinee must have mastered every attribute associated with a particular item to respond correctly to that item (“And Gate”). However, the model recognizes that examinees might respond contrary to predictions (“Noisy”). Certain examinees will slip on an item, that is answer the item incorrectly even though they have all of the required attributes, whereas other examinees will successfully guess on an item, that is answer the item correctly even though they miss at least one of the required attributes. Given these properties, the DINA model–predicted probability that examinee i will respond correctly to item j is given by
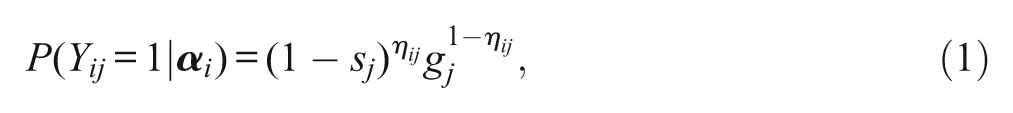
where
Current Item Selection Methods
When applying adaptive testing algorithms to CDMs, one must determine how to choose items to administer to examinees. With respect to traditional CAT, item selection methods generally involve either maximizing information near the estimated location of the examinee in ability space or minimizing the error in that estimation (Reckase, 2009). For example, the most widely used information measure in adaptive testing, Fisher information, measures the amount of information that an observable random variable X carries about the unknown parameter θ. Because Fisher information requires the conditional distribution of X given θ to be continuous with respect to θ, one must develop alternative information measures for CD-CAT. Several other information measures, such as KL information and mutual information, are directly applicable to models measuring discrete latent traits.
Kullback–Leibler Information Index
In CD-CAT, items should be sequentially selected to optimize an objective function of the estimated attribute profile
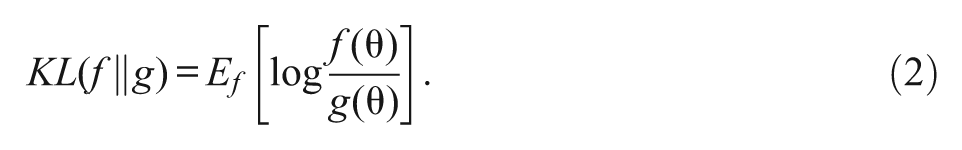
One generally thinks of Equation (2) as a distance-like measure in the sense that
To apply the KL Information Index to CD-CAT, we must determine distributions f and g in Equation (2). For examinee i, we seek to measure the unknown latent vector,

Because the true latent profile,
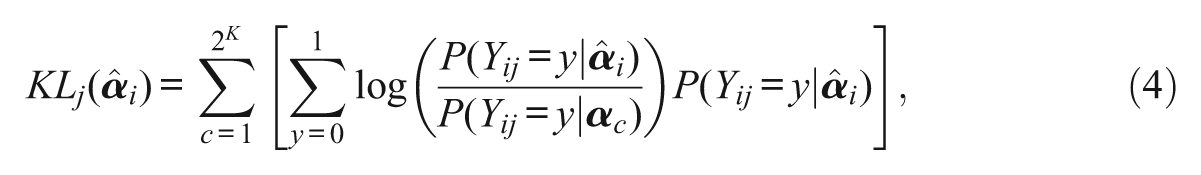
where c indexes attribute profile and runs from 1 to
Posterior Weighted Kullback–Leibler Information Index
One problem with the original KL Index, as defined by Equation (4) is that each
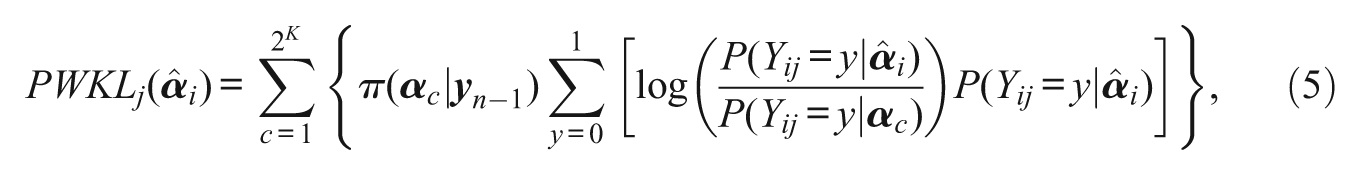
where
Shannon entropy method
An alternative information metric to KL-based measures is Shannon entropy. Shannon entropy quantifies the uncertainty inherent in the distribution of a single random variable (Shannon, 1948). Shannon entropy is maximized if distribution is uniform and minimized if the distribution is a single point mass. In CD-CAT, one would ideally like the posterior distribution of
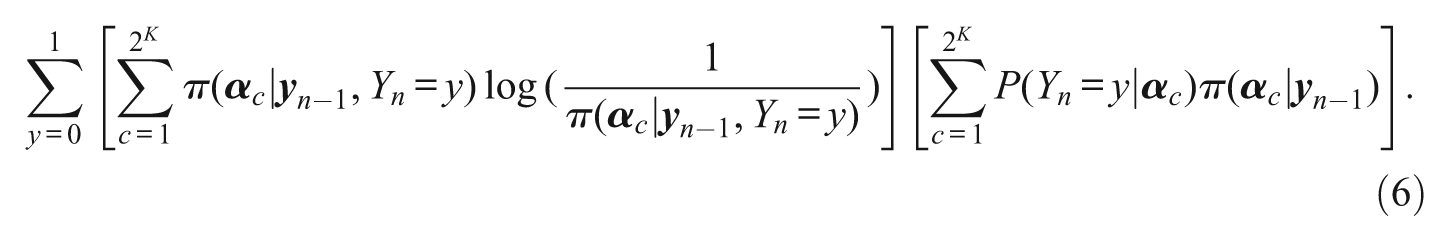
Tatsuoka (2002) has shown that selecting items to minimize (6) should outperform the KL approaches. Wang and Chang (2011) recently found that applying a Shannon entropy item selection algorithm to continuous trait-based multidimensional CAT resulted in accurate ability estimates. As shown by Wang and Chang, the Shannon entropy–based method can be viewed as a special case of mutual information. Therefore, one would expect the more general mutual information–based method to be at least as optimal as Shannon entropy. Because of the desirable properties of mutual information, we next introduce a mutual information–based index in CD-CAT.
Mutual Information in Cognitive Diagnostic Model
The Expected Mutual Information Index
Given two random variables, X and Y, mutual information is defined as the KL divergence between their joint distribution,
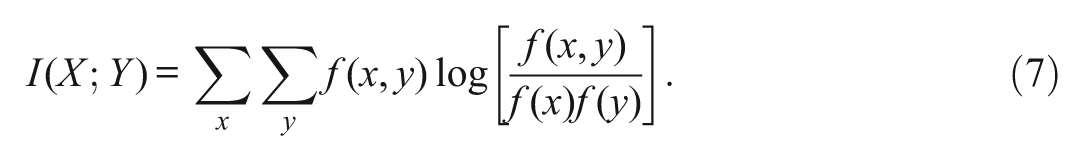
In CD-CAT, replace
We will now describe the explicit equation for mutual information in CDM. After administering the nth item, the posterior density is updated to a new posterior according to Bayes theorem,

where
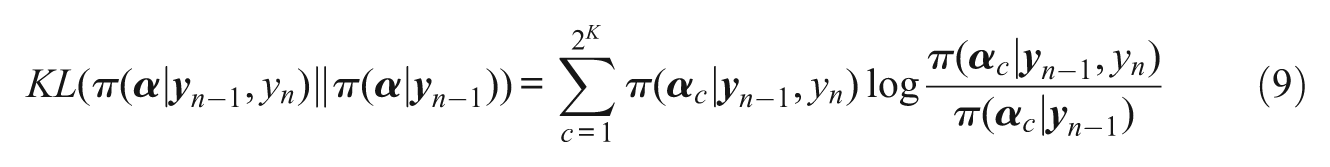
Unfortunately, we cannot calculate the previous equation because of the nth response being unknown. Therefore, we must take expectations to eliminiate the actual response. After modifying the previous equation, the expected KL distance between two subsequent posterior distributions is calculated as
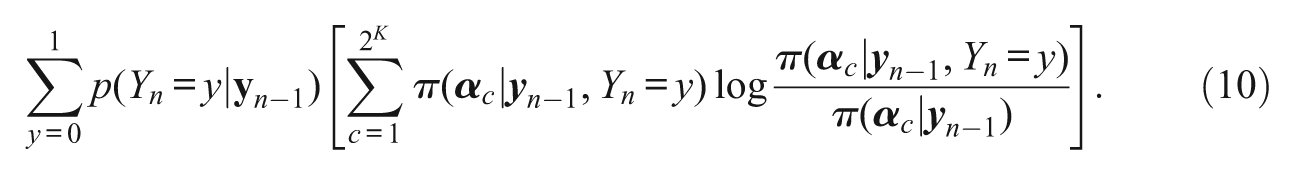
Any item that maximizes (10) will also maxmize the expected mutual information between
Computational Simplification
Although, in principle, mutual information has benificial properties, the corresponding equation is computationally intensive. Equation (10) requires a triple summation (because both

and

Next, define
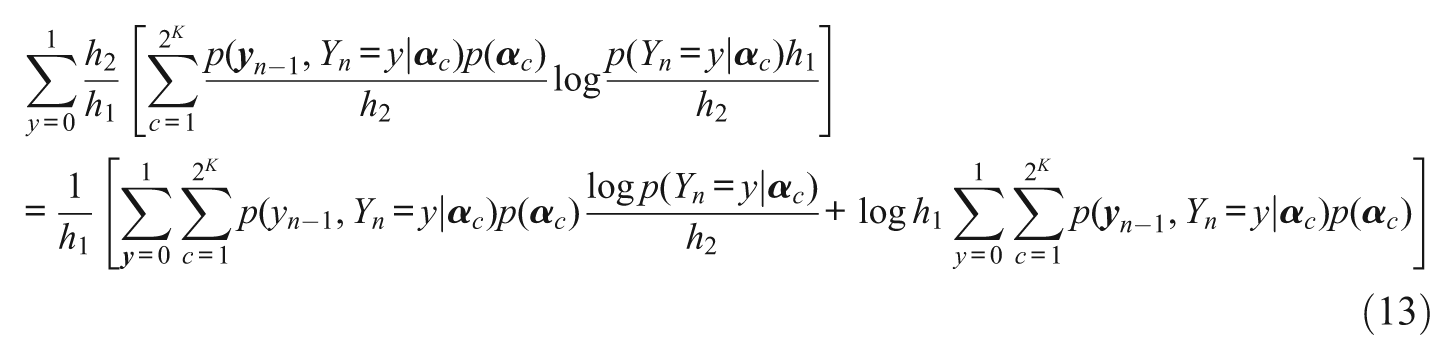
Note that
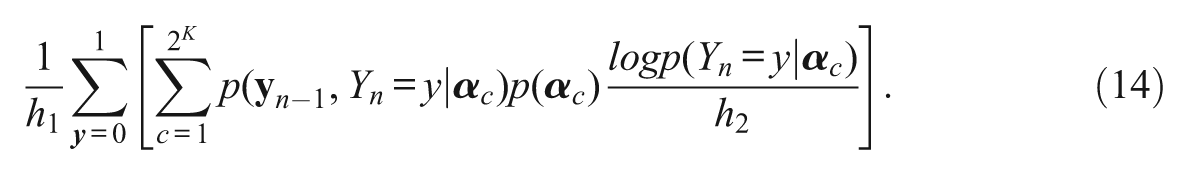
The rank ordering of prospective items will be the same regardless of whether using Equation (10) or (14). Although the mutual information Index will always be nonnegative by definition, (14) could be negative depending on the value of the constant term
Simulation Studies
We conducted two simulation studies to compare the mutual information item selection algorithm against three current item selection methods. The first simulation study assumed that a test measures five attributes (a medium number that is often considered in literature, see Cheng, 2009 or Chen, Xin, Wang, & Chang, 2012). However, five attributes might underestimate the dimensionality underlying a typical application of CDM. Therefore, the second simulation study assumed that the test measures eight attributes (a larger number that is more likely to be observed in real test data, e.g., DeCarlo, 2011; Liu et al., in press). In both studies, we simulated data using the DINA model because of its popularity and simplicity. However, all the discussed item selection algorithms can straightforwardly be applied to any CDM.
Simulation Design
In the first study, item banks differed primarily in Q-matrix structure. Half the banks obeyed simple structure, in which one fifth of the items exclusively measured each of the five attributes. The remaining banks followed complex structure, in which each attribute was roughly measured by half the items in the item bank. To form a complex Q-matrix, every item-by-attribute was accompanied by a random uniform number between 0 and 1. If the random number was smaller than 0.5, then the corresponding Q-matrix entry was 1, indicating that the attribute was measured by the item. Otherwise, the corresponding Q-matrix entry was forced to be 0. Finally, to prevent trivial rows in the Q-matrix, every item was constrained to measure at least one of the five attributes. The total number of items in the bank is 350.
Aside from Q-matrix structure, conditions also differed in item selection algorithm, bank information, and test length. We used five item-selection algorithms: (a) maximum KL information, (b) maximum PWKL information, (c) minimum Shannon entropy, (d) maximum MI, and (e) random selection. With respect to bank information, the DINA model evaluates item quality by the magnitude of item-level slipping and guessing parameters. In the “high” information condition, guessing parameters were generated from a uniform distribution with a minimum of .05 and a maximum of .2, and slipping parameters were generated from a uniform distribution with a minimum of .1 and a maximum of .3. In the “low” information condition, guessing parameters were generated from a uniform distribution with a minimum of .1 and a maximum of .3, and slipping parameters were generated from a uniform distribution with a minimum of .15 and a maximum of .4. Test length was either set to 5 or 10 items. Therefore, we had 2 (Q-matrix structure) × 5 (item selection algorithm) × 2 (bank information) × 2 (test length) = 40 total conditions for the first study.
Across conditions, we generated a 1000-by-5 (person-by-attribute)
Real tests normally contain a large number of skills, such as the eight-attribute structure identified from the fraction subtraction data (DeCarlo, 2011). Hence, we also wanted to estimate the performance of mutual information given a bank composed of a larger number of attributes. We therefore devised a second simulation study by using an item bank designed to measure eight attributes. The item bank size is the same as in the first study. We also varied the Q-matrix structure (between simple and complex) and attribute correlations (between all correlating .6 and all correlating 0). Unlike the first study, we fixed bank information to be high and adaptive test length to be 10 to keep the simulation study more focused and because item quality and test length are less interesting factors that have been previously and extensively studied (see Cheng, 2009 or Wang et al., 2012). Therefore, we had 2 (Q-matrix structure) × 5 (item selection algorithm) × 2 (correlation levels) = 20 total conditions for the second study.
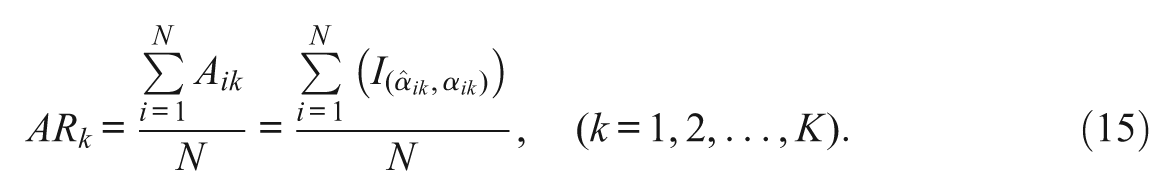
For both simulation studies, two measures were computed to evaluate both the attribute and pattern recovery rates. The attribute-level recovery rate (AR) is defined as the marginal proportion of attributes that are correctly identified, or
The pattern recovery rate (PR) is defined as the proportion of entire attribute patterns that are correctly identified, or
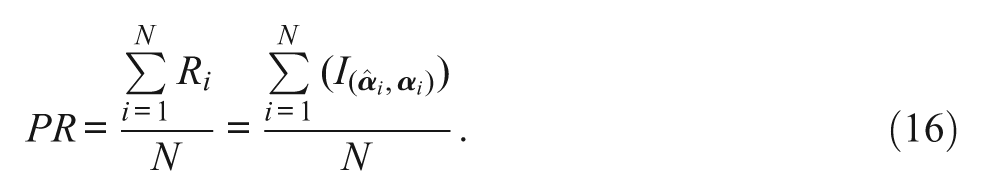
Note that for both Equations (15) and (16), I is an indicator function. Therefore, in Equation (14), when
In all conditions, the profile estimates,
Results
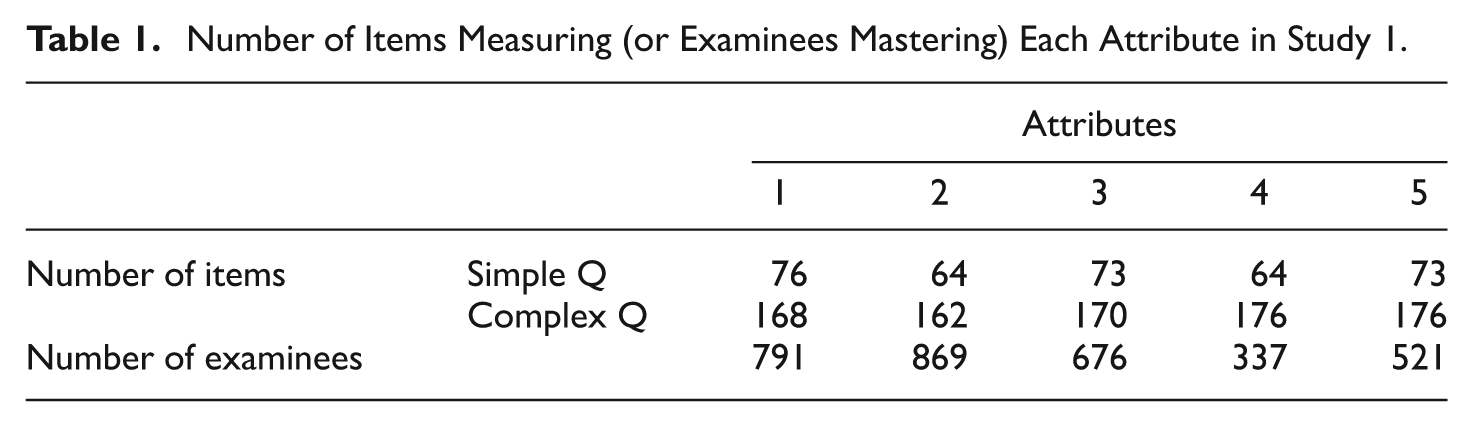
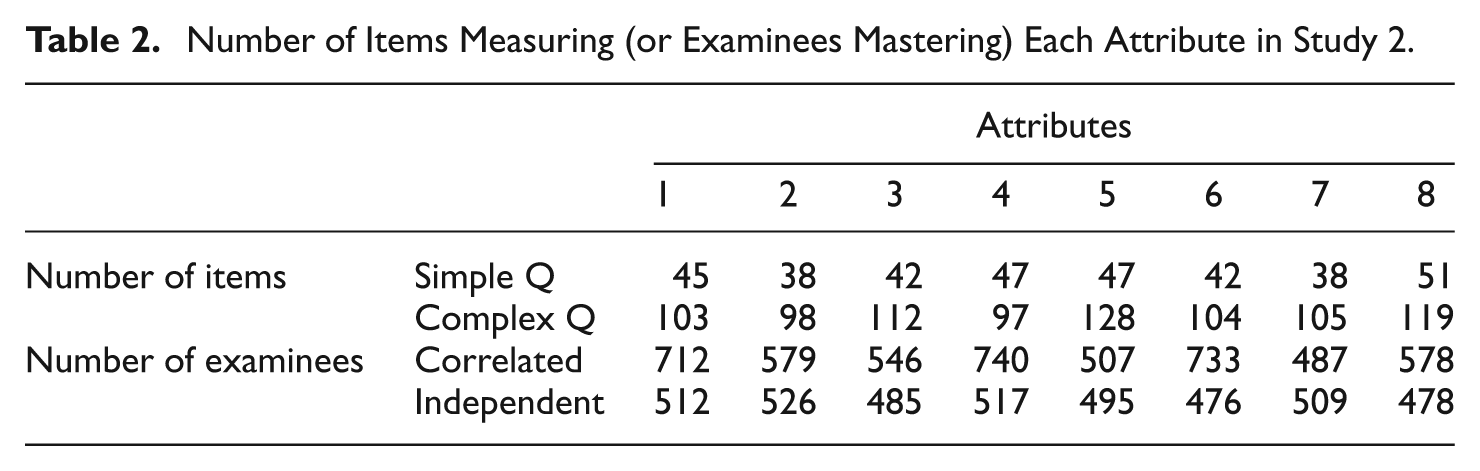
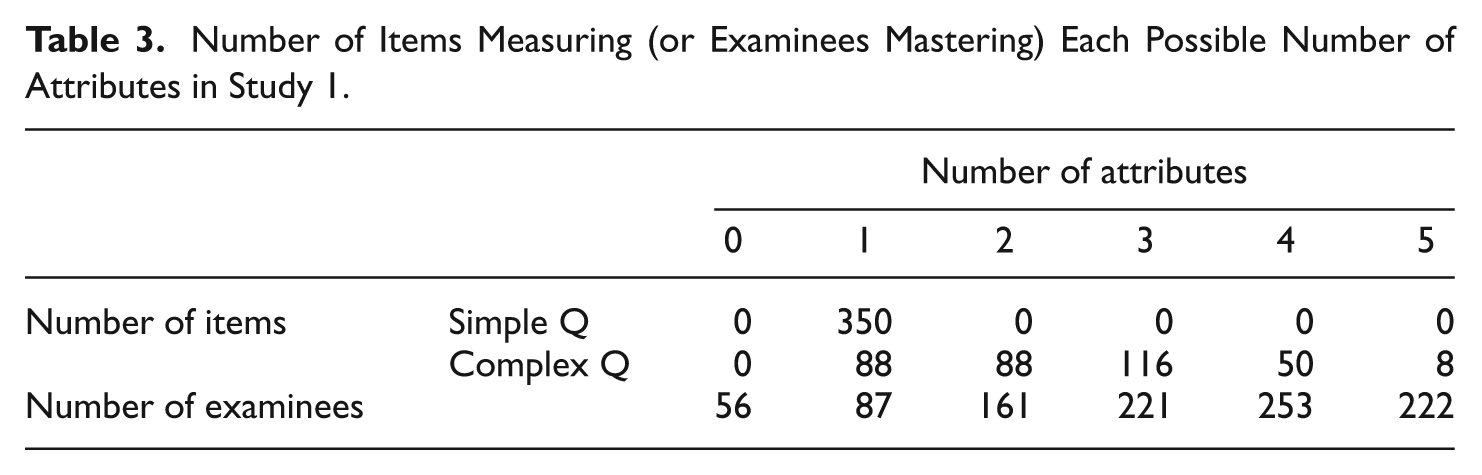
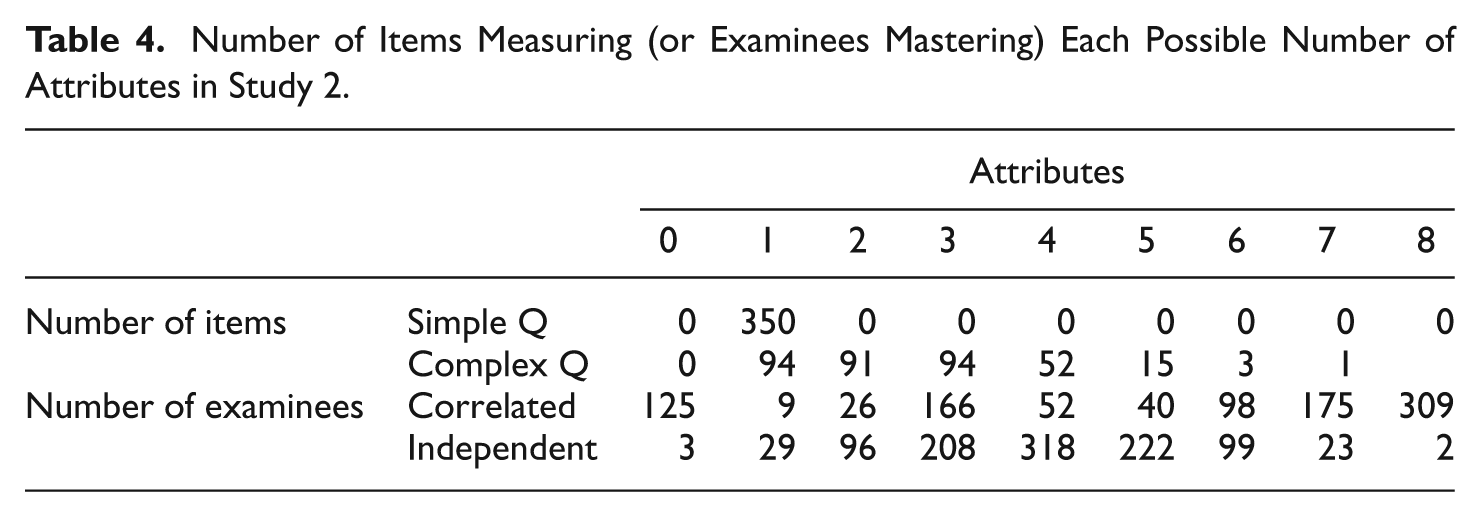
Tables 1 to 4 present the descriptive statistics of the Q- and
Number of Items Measuring (or Examinees Mastering) Each Attribute in Study 1.
Number of Items Measuring (or Examinees Mastering) Each Attribute in Study 2.
Number of Items Measuring (or Examinees Mastering) Each Possible Number of Attributes in Study 1.
Number of Items Measuring (or Examinees Mastering) Each Possible Number of Attributes in Study 2.
The attribute level and pattern recovery rates corresponding to Simulation 1 are shown in Table 5.
Attribute and Pattern Recovery Rate for Simulation Study 1.

Note. PWKL = posterior weighted Kullback–Leibler information method; Shannon = Shannon entropy method; KL = Kullback–Leibler Index method; Mutual = mutual information method; Random = random item selection method.
Notice that the pattern recovery rate is always smaller than the attribute recovery rate, as explained earlier. However, lengthening the test or improving the item bank information increases both recovery rates. Moreover, varying the Q-matrix structure does not seem to have a consistent effect on either recovery rate. Although strange at first blush, complex Q-matrices have counterbalancing effects on attribute recovery rates. On the one hand, allowing an item to measure more than one attribute results in an increased number of items measuring each attribute, as shown in Tables 1 and 2. If more items measure an attribute, then that attribute has additional, useful diagnostic information. On the other hand, allowing an item to measure more than one attribute results in a decreased discrimination of that item to differentiate two cognitive profiles. Henson and Douglas (2005) proposed a KL Information Index, as a generalization of Chang and Ying’s (1996) original idea, to quantify the discrimination power of item j (denoted as

with u and v indexing different cognitive profiles. If item j only measures attribute k, then
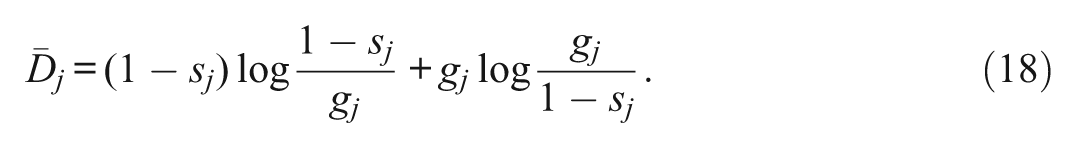
In (18),

because only
As shown in Table 5, the mutual information item selection algorithm generates nearly the most accurate attribute pattern recovery in more than half of the conditions. The advantage of mutual information over the other conditions is increased for short tests. This result is consistent with the performance of a mutual information item selection algorithm in multidimensional CAT (Wang & Chang, 2011). Because MI does not rely on intermediate estimates of
Results of the second simulation study are shown in Table 6. Based on Table 6, higher correlations lead to more accurate results regardless of the Q-matrix structure. These results are consistent with research in multidimensional item response theory: By using multidimensional models, one can obtain greater precision in estimating dimensional ability by “borrowing strength” from other dimensions (i.e., de la Torre & Patz, 2005; Wang, Chen, & Cheng, 2004). And as is clearly shown by de la Torre and Patz (2005), higher correlations among the dimensions results in improved estimation accuracy.
Attribute and Pattern Recovery Rate for Simulation Study 2.
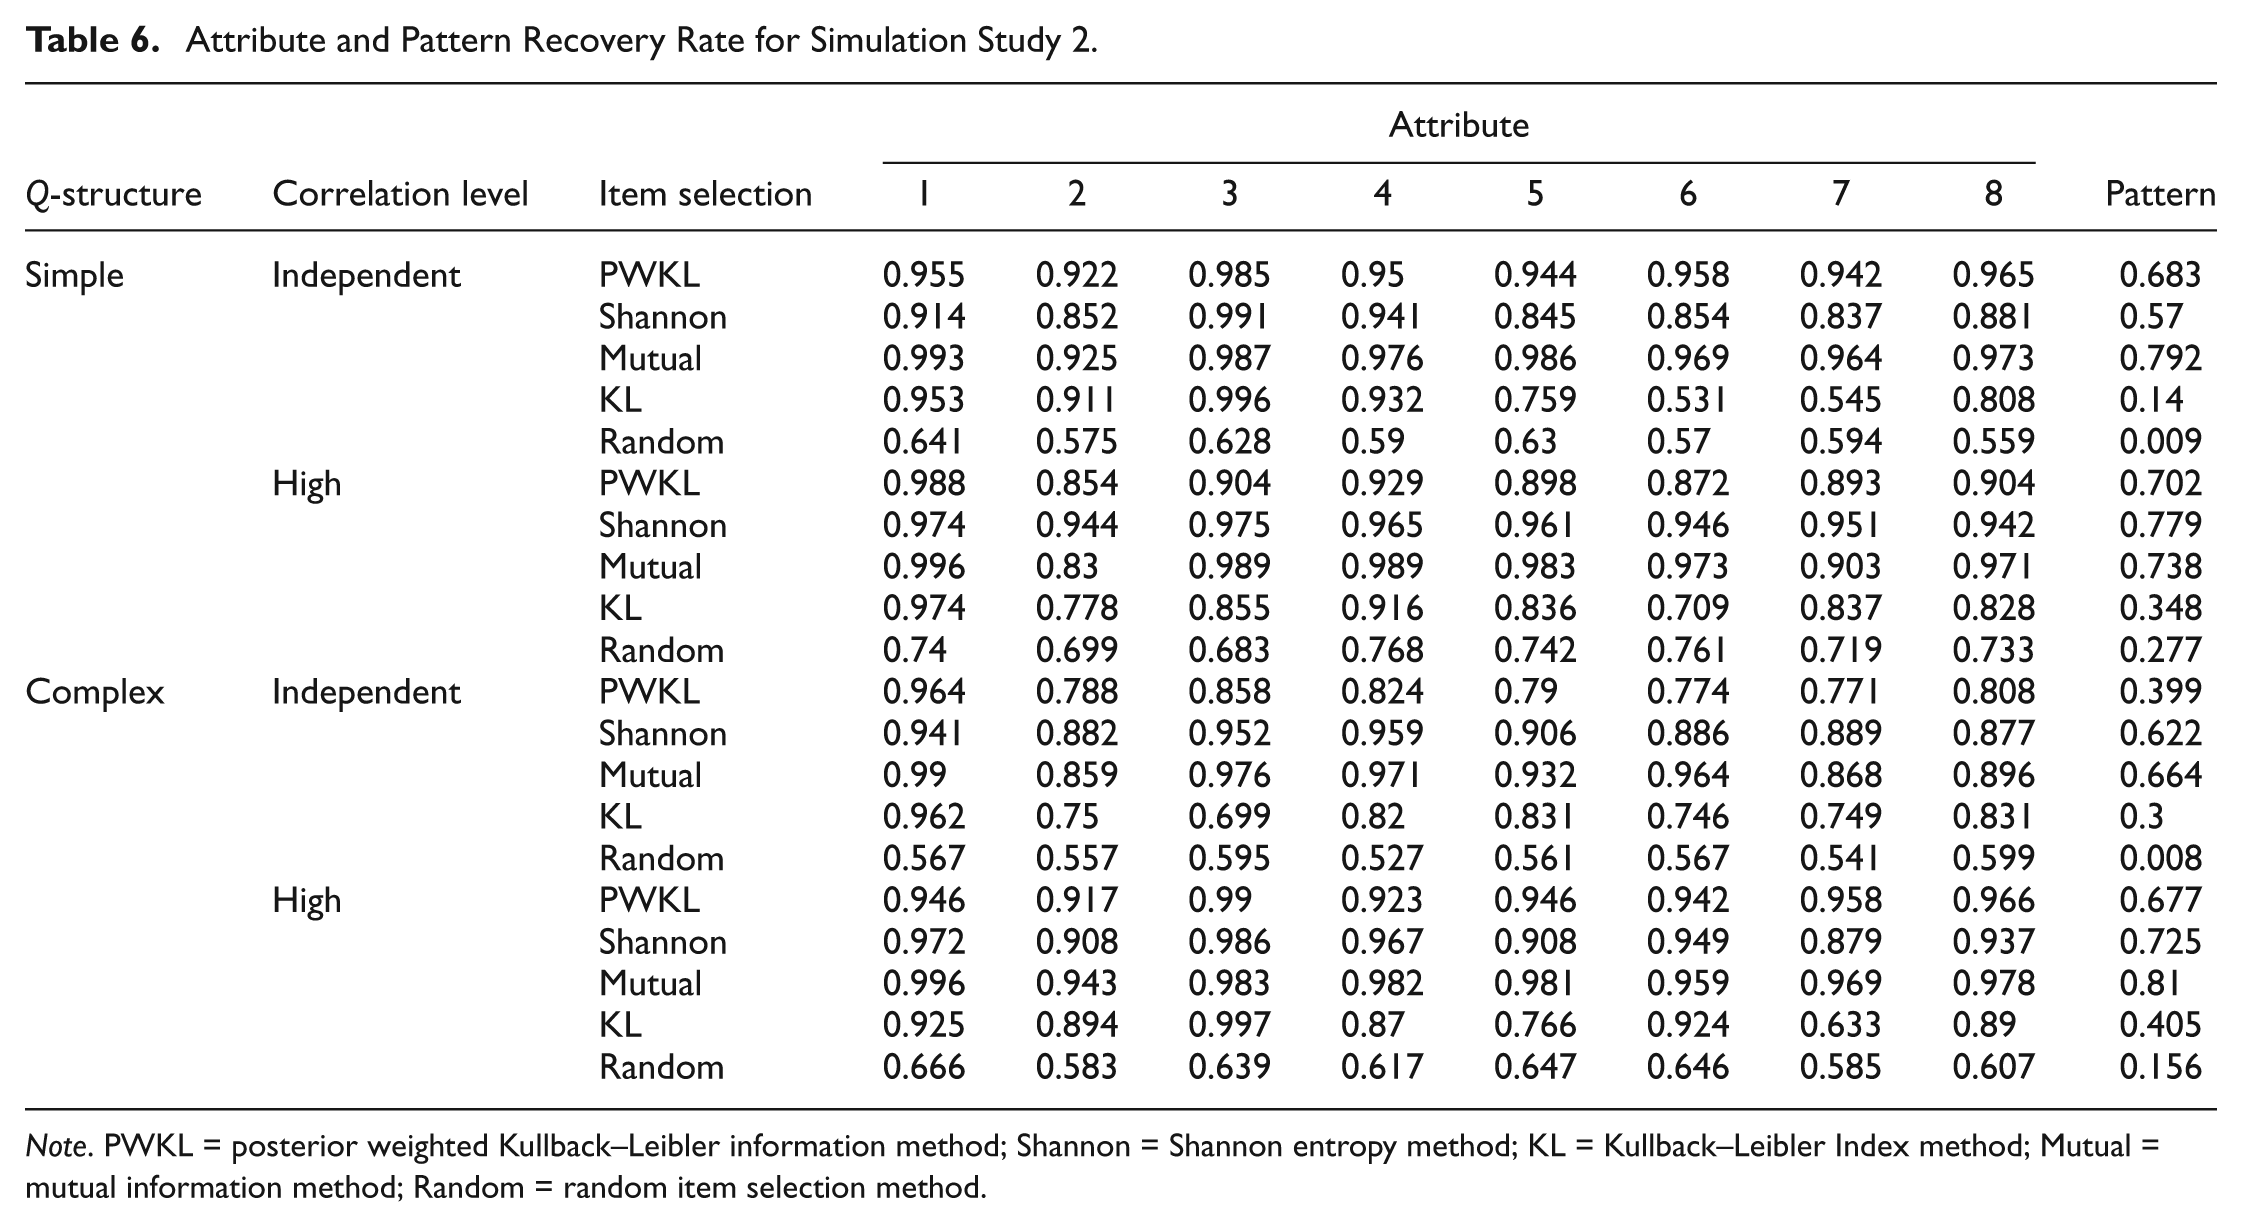
Note. PWKL = posterior weighted Kullback–Leibler information method; Shannon = Shannon entropy method; KL = Kullback–Leibler Index method; Mutual = mutual information method; Random = random item selection method.
Discussion and Conclusion
Most modern psychometrics focuses on tests designed to measure a unidimensional latent trait. These tests are often used to make summative decisions concerning admission, placement, and scholarships/fellowships. In the past few decades, teachers and administrators increasingly desire tests designed to assess several, finer-grained chunks of knowledge (DiBello & Stout, 2007). These “formative” assessments imply that their results are used to directly support teaching and learning. In contrast, “summative” testing evaluates students’ overall proficiency at the end of the instruction. To fulfill the demand for formative diagnostics and remedial instruction, one must efficiently and accurately pinpoint examinees’ strengths and weaknesses across one of a number of content areas. CD-CAT provides an intriguing solution to such a demand.
This article introduces a new item selection algorithm in CD-CAT, namely, the mutual information method. Because mutual information can be computationally intensive, this article also presents a simpler formula designed to make mutual information algorithms amenable in real-time CD-CAT.
We compared mutual information against already existing item selection algorithms for CD-CAT via two simulation studies. In these simulations, we manipulated several factors that might affect estimation accuracy, including number of attributes, test length, Q-matrix structure, item quality, and interattribute correlations. Not surprisingly, increasing the number of attributes measured by a CAT resulted in decreased reliability and accuracy. Because test length was limited, more attributes measured by a test implies fewer items per attribute. Moreover, increasing test length and item quality resulted in better recovery of the attribute profiles. Interestingly, one cannot easily predict the change in recovery rates for different Q-matrices. As explained in the previous section, a counterbalancing relationship exists between items measuring multiple attributes (more attributes for an item, worse measurement of each attribute) and more items measuring each attribute (more items for an attribute, more information for that attribute). DiBello and Stout (2007) explained that
the items, possibly including complex items or, even more generally, open-ended tasks, must be designed from a cross-disciplinary evidentiary perspective to effectively measure well all of the specified skills. An open research topic is whether fewer complex items or greater numbers of simple (perhaps multiple choice) items are most informative for a given assessment application, both from the validity and the reliability perspectives. (p. 287)
The “complex items” of their statement might indicate open-ended question but could also be interpreted as items measuring numerous skills. Whether including such “complex items” is beneficial to attribute recovery depends on the Q-matrix of the test as well as the test blueprint.
One might wonder why we chose very short test lengths for all our comparisons. DiBello and Stout (2007) wrote that “there is a stronger form of formative assessment called embedded assessment, which postulates that formative assessments should be seamlessly and periodically embedded in the curriculum for the purpose of improving teaching and learning” (p. 289). If giving students an “embedded assessment” at the end of each instruction period, one must prefer short tests to prevent unnecessary loss of lecture time. Therefore, the CD-CAT item selection algorithm must be able to recover examinees’ mastery profiles with short tests. Based on our simulations, the mutual information method generates more accurate results than competing methods in almost all conditions assuming relatively short tests.
The simulation studies discussed in this article are by no means exhaustive. Future simulations should be conducted to determine the effect of exposure control on profile recovery using the various item selection algorithms discussed in this article (Wang, Chang, & Huebener, 2011). Moreover, nonstatistical constraints, such as content constraints, word counts, or balancing item keys in the test, could also be added to fulfill the requirement in the test blueprint (Mao & Xin, 2013). Although we mainly used examples from educational measurement in this article, one could apply our results to CDM of psychological assessment and diagnosis. Templin and Henson (2006) demonstrated that various CDMs can aid accurate diagnosis of psychological disorders. Ensuring efficient and accurate psychological tests will allow more time to be spent on treating rather than diagnosing the disorder.
Footnotes
Declaration of Conflicting Interests
The author(s) declared no potential conflicts of interest with respect to the research, authorship, and/or publication of this article.
Funding
The author(s) received no financial support for the research, authorship, and/or publication of this article.