
Abstract
A challenge associated with traditional mixture regression models (MRMs), which rest on the assumption of normally distributed errors, is determining the number of unobserved groups. Specifically, even slight deviations from normality can lead to the detection of spurious classes. The current work aims to (a) examine how sensitive the commonly used model selection indices are in class enumeration of MRMs with nonnormal errors, (b) investigate whether a skew-normal MRM can accommodate nonnormality, and (c) illustrate the potential of this model with a real data analysis. Simulation results indicate that model information criteria are not useful for class determination in MRMs unless errors follow a perfect normal distribution. The skew-normal MRM can accurately identify the number of latent classes in the presence of normal or mildly skewed errors, but fails to do so in severely skewed conditions. Furthermore, across the experimental conditions it is seen that some parameter estimates provided by the skew-normal MRM become more biased as skewness increases whereas others remain unbiased. Discussion of these results in the context of the applicability of skew-normal MRMs is provided.
Normality-based mixture regression analysis has been widely used in marketing research over the past two decades and has been increasingly applied in other fields within the social and behavioral sciences (Wedel & DeSarbo, 1994). However, this type of analysis has been criticized for being too sensitive to the violation of its residual normality assumption, resulting in additional unobserved groups and thus misleading inference from data (e.g., Van Horn et al., 2012). In this article, we present a generalized form of mixture regression models (MRMs) based on the skew-normal distribution introduced by Azzalini (1985). The proposed model subsumes the traditional normality-based MRM as a special case and has the advantage of accommodating a nonnormal continuous response variable. Moreover, it is expected to have important implications for researchers who want to study complex human behaviors exhibiting different response patterns to environmental conditions.
This article begins with an overview of MRMs that includes their primary limitation and an alternative approach to tackle this problem. Next, to alleviate the negative consequences caused by nonnormality in MRMs, skew-normal mixture regression models (SNMRMs) are introduced and investigated through a designed simulation study. Finally, the potential utility of SNMRMs is illustrated with a real data set from psychology.
Overview of Mixture Regression Models
Regression analysis may be one of the most commonly used statistical techniques in social science research. Typically, this method tries to model the relation between a set of predictors (either categorical or continuous) and a dependent variable. Based on a sample of interest, regression coefficients are estimated and used to make inferences about a particular population. However, as numerous studies have shown, when the regression coefficients differ across various unobserved subgroups in the population, MRMs are more appropriate because they can simultaneously estimate separate regression equations for those subgroups and classify subjects into their various latent classes (DeSarbo & Corn, 1988; Wedel & Desarbo, 1994). Scenarios in which this model is an ideal approach include the absence of an observed grouping variable to explicate heterogeneity in the data, or when the group variable is available but many interaction/moderation effects are needed to capture this heterogeneity. In the latter scenario, model estimation and interpretation may be especially difficult (McClelland & Judd, 1993).
Mixture regression analysis was first introduced by Quandt (1972) and Quandt and Ramsey (1978) under the title switching regression, where the model was estimated with a somewhat inefficient moment-generating-function based method. Similarly, in what was referred to as clusterwise linear regression, Späth (1979) offered a more efficient ordinal least squares estimation method to minimize the overall sum of the sums of squared errors within each group. Finally, inspired by Dempster, Laird, and Rubin’s (1977) seminal work on the expectation-maximization (EM) algorithm, Aitkin and Wilson (1980) carried out the maximum likelihood estimation of MRMs treating group memberships as missing data within the EM framework. This more fine-tuned estimation method still serves as the basis for the estimation of mixture models today, and has been extended to a variety of more generalized scenarios with different parametric forms for a response variable: binary/dichotomous (Kamakura & Russell, 1989; Wong & Maffini, 2011; Zhu & Zhang, 2004), counts (Wedel, DeSarbo, Built, & Ramaswamy, 1993), or any other type from the exponential family (Wedel & DeSarbo, 1995).
Normality-based MRMs specifically have been widely applied in many fields. Applications include marketing (DeSarbo & Corn, 1988; DeSarbo, Wedel, Vriens, & Ramaswamy, 1992; Goldfeld & Quandt, 1973; Naik, Shi, & Tsai, 2007; Quandt & Ramsey, 1978), economics (Cosslett & Lee, 1985; Hamilton, 1989), finance (Engel & Hamilton, 1990), agriculture (Turner, 2000), psychogeriatrics (Kliegel, Zimprich, & Eschen, 2005), nutrition (Arellano-Valle, Castro, Genton, & Gómez, 2008), public health (Schmeige, Levin, & Bryan, 2009), and psychometrics (Liu, Hancock, & Harring, 2011). Despite its widespread applications in a variety of different fields, researchers in psychology, education, and other social and behavioral sciences have not commonly adopted MRMs, likely in part because of their computational difficulty. Tracing the history of MRM, we know the model is not new to education. Examples do exist, however. Aitkin, Anderson, and Hinde (1981), for instance, found that students in England achieve different proficiency levels when exposed to different teaching styles, where teaching style was modeled as a latent variable with three classes (formal, informal, and mixed style) inferred from 38 binary questionnaire items. More recently, Van Horn, Bellis, and Snyder (2001) assessed the differential effects of various family resources on students’ academic achievements, whereas Ding (2006) made a clear call for MRMs in education and illustrated their utility with a study on children’s math achievement. And this call has become more reasonable given the advances of convenient computer programs that can estimate MRMs, including Mplus (Muthén & Muthén, 2012), Latent Gold (Vermunt & Magidson, 2008), and the free R package Flexmix (Grün & Leisch, 2007).
Like other conventional normality-based mixture models, MRMs rely heavily on the assumption of the underlying distribution, taking the form of
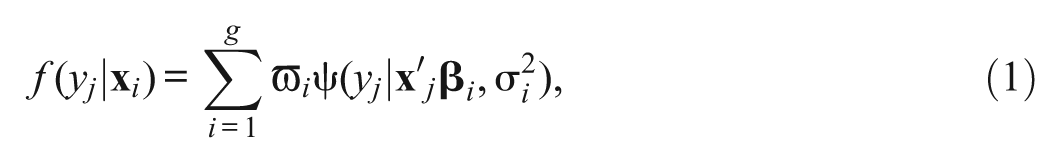
where
Even a mild violation of within-class normality in these MRMs may result in the overextraction of unobserved groups in an attempt to fit the data (Bauer & Curran, 2003, 2004; Maclean, Morton, Elston, & Yee, 1976; McLachlan & Peel, 2000). Recent work by Van Horn et al. (2012) demonstrated that even mild skewness of residuals in MRMs can lead to spurious classes being identified and biased parameter estimates. To cope with this problem, Van Horn et al. (2012) and George et al. (2012) applied an ordered polytomous approach (i.e., a proportional odds model) to handle mild and severe nonnormality in errors separately. More specifically, they simulated nonnormal response variables in R with varying degrees of skew in the residuals and recoded the nonnormal data into an ordinally scaled variable with six categories. Next, the polytomous MRM was applied to estimate the transformed data in Mplus. Because no specific distribution is assumed for this polytomous model, this method was expected to perform well in recovering the true number of latent classes and population parameters. Under very mild skew conditions, Van Horn et al. found that the true two-class model was correctly identified nearly 100% of the time. Comparing the thresholds, regression coefficients, and associated standard errors between the transformed polytomous model (representing true population setting) and estimated polytomous model results, these authors found that some parameter estimates were biased and some had fairly large standard errors. In a parallel study for severe skewed conditions, George et al. found that when intercept differences existed between two classes under conditions of mild skewness, among all model selection criteria they examined (Akaike’s information criterion [AIC], Bayesian information criterion [BIC], sample-adjusted BIC [SABIC], bootstrapping likelihood ratio test, entropy) the BIC performed best but still mistakenly selected a three-class model 11% of the time; meanwhile, under high skew conditions, the SABIC mistakenly supported the three-class model in 80% of total simulations. Furthermore, the parameter estimates for correctly selected two-class models were biased in most cases, with small thresholds being underestimated, large thresholds being overestimated, and the regression coefficients being overestimated in both classes in the presence of even mild to moderate skewness. Thus, although Van Horn et al. and George et al. took the first steps to address class identification issues in MRMs, their method is only applicable to very mildly skewed data with regard to class enumeration and, as a result of the dependent variable’s transformation into an ordinal scale, interpretation of results becomes more difficult.
Skew-Normal Mixture Regression Models
We propose a SNMRM in which skewness is captured by a separate parameter and normal error is encompassed as a special case. Skew-normal distributions were first proposed by Azzalini (1985) as a density function to “allow a ‘continuous’ variation from normality to non-normality” (p. 171). As defined, a skew-normal random variable Z has density function of
This idea has been used in conventional statistical techniques to accommodate slight deviation from normality, such as linear regression model (Arellano-Valle et al., 2008; Chen & Chen, 2003; Sahu, Dey, & Branco, 2003), nonlinear regression models (Cancho, Dey, Lachos, & Andrade, 2010; Cancho, Lachos, & Ortega, 2010; Xie, Weia, & Lina, 2009), and linear mixed models (Ghosh, Branco, & Chakraborty, 2007; Ma, Genton, & Davidian, 2004). The user-friendly R package “SN” (Azzalini, 2013) can estimate univariate or multivariate skew-normal distributions and skew-normal linear regression models. Very recently, skew-normal distributions have also been incorporated into mixture modelling (e.g., Lin, Lee, & Yen, 2007). However, no study has yet examined whether skew-normal distributions can effectively mitigate the overfit and biased parameter estimates in MRMs because of the spurious latent classes.
The SNMRM we proposed takes the form of
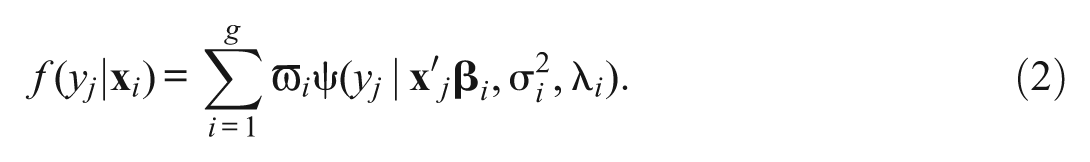
The key difference between Equations (1) and (2) lies in the one additional shape parameter λi. Here
The current study first aims to investigate how sensitive the commonly used model selection indices are in class determination, with regard to various degrees of violation of the assumption of normality in MRMs. Van Horn et al. (2012) had examined this problem and we expected our results to be similar to theirs. Second and more important, the SNMRM as a more robust extension of MRMs will be investigated in terms of its performance in accommodating both normal and nonnormal errors through a simulation study. Finally, the potential advantages of this flexible approach will be illustrated with a real data analysis.
Simulation Study
Data Generation Model
Consider that subjects may respond to the same intervention in two ways. Accordingly, the two simple linear regression functions
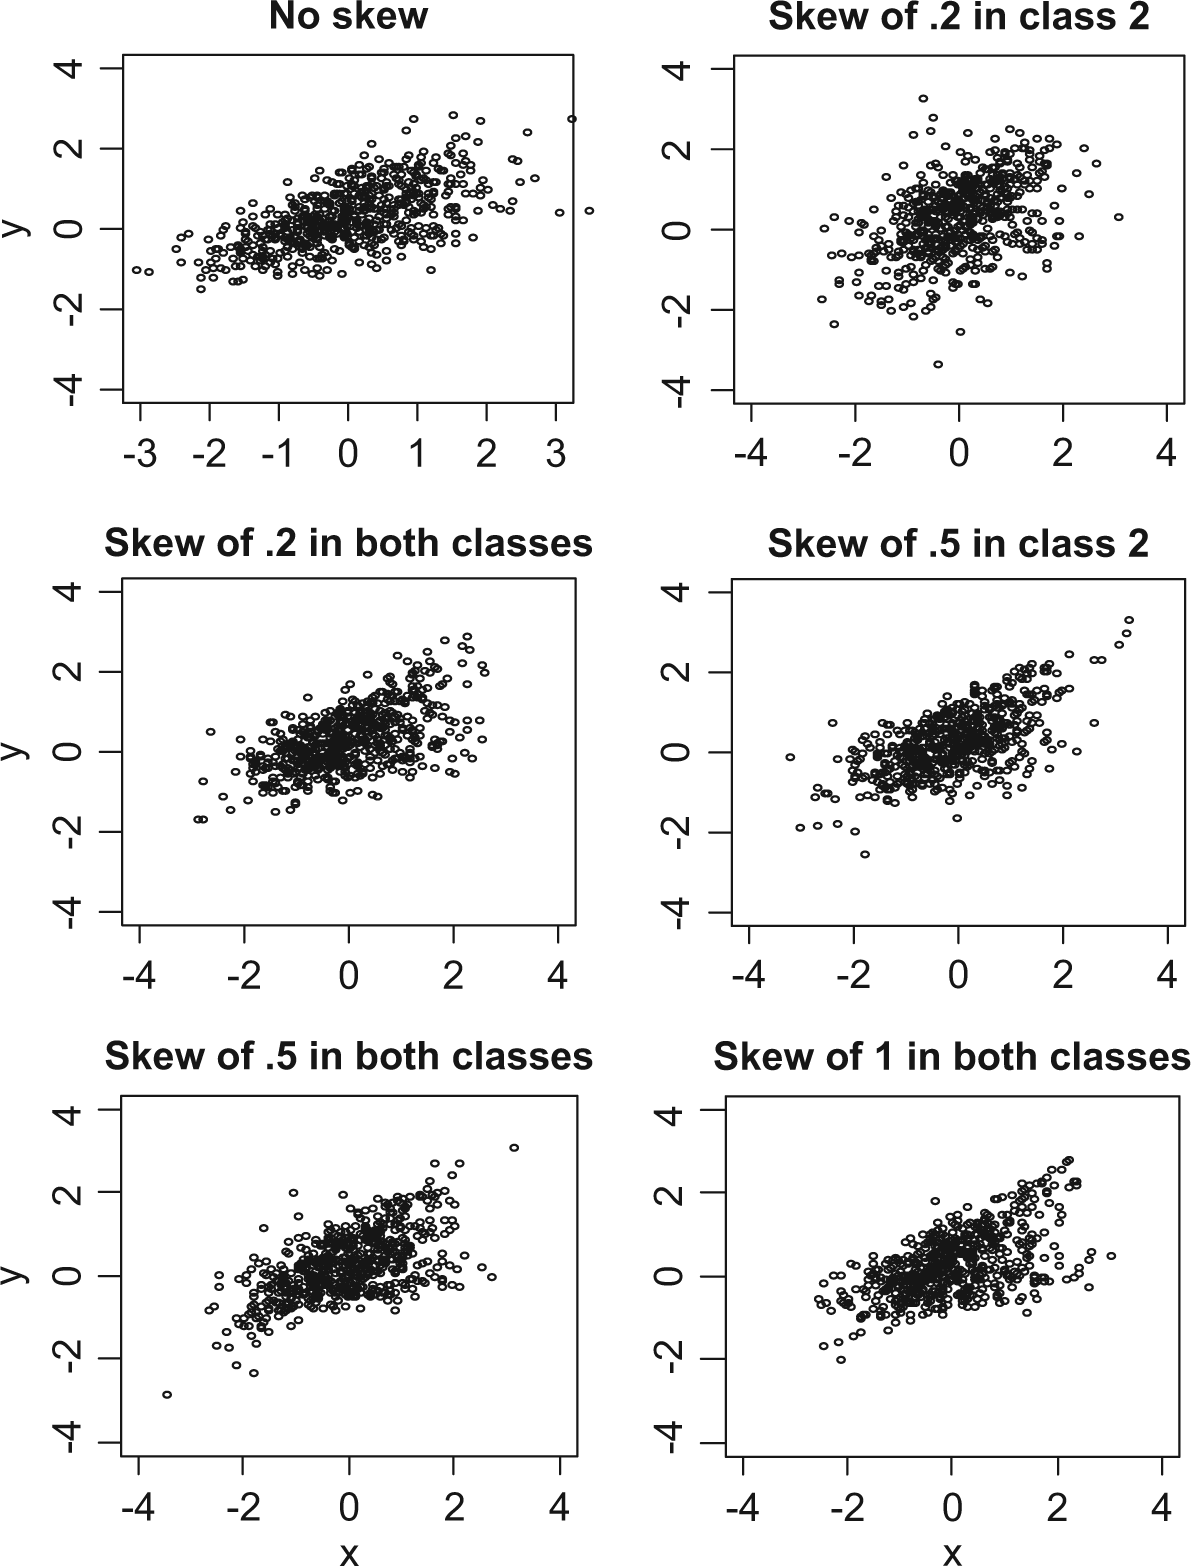
Scatterplot of each simulated condition.
It should be noted that when skewed error was placed into both groups, positive error was set in the first group and the negative error in the second to vary nonnormal conditions. This is different from the approach by Van Horn et al. (2012) and George et al. (2012), in which only positive skewness was manipulated. A total of 1000 subjects for each group were used to achieve reliable results for both models, and the R package (R Development Core Team, 2008) was used for generating the data.
Model Estimation and Model Selection
No existing program is available to estimate SNMRMs directly. Therefore, maximum likelihood estimation via the EM algorithm was implemented using R to estimate one-, two-, and three-class MRMs and SNMRMs for each simulated scenario (see the appendix for technical details 1 ). Furthermore, because there is no universal criterion for class enumeration in mixture modeling, we relied on two types of model fit indices for selecting the optimal model among one-, two-, and three-class mixture models: six information criteria include AIC (Akaike, 1987), consistent AIC (CAIC; Bozdogan, 1987), sample-adjusted CAIC (SACAIC; Tofighi & Enders, 2008), Bayesian information criterion (BIC; Schwarz, 1978), sample-adjusted BIC (SABIC; Sclove, 1987), and difference in BIC (DBIC; Draper, 1995); and two classification-based criteria are entropy (Celeux & Soromenho, 1996) and integrated completed likelihood (ICL; Biernacki, Celeux, & Govaert, 2000). Among them, Entropy, AIC, BIC, and SABIC were examined by Van Horn et al. (2012). The entropy criterion in the current study was developed by Celeux and Soromenho (1996) and is not the one defined by Ramaswamy, DeSarbo, Reibstein, and Robinson (1993) and used in Mplus.
To assess the quality of the classification function of each mixture model, two indices were used in the current study: correct classification rates (CCRs) based on the posterior probability assigned to each subject and the adjusted Rand index (ARI; Hubert & Arabie, 1985). ARI corrects for chance by accounting for the fact that classification performed randomly would be expected to correctly classify some cases. This index has expected values of 0 under random classification and 1 for perfect classification. For both CCR and ARI, larger values indicate better classification results.
In the mixture context, the likelihood is invariant under a permutation of the class labels in parameter vectors. Therefore, a label switching problem can occur when some labels of the mixture classes permute (McLachlan & Peel, 2000). Although the switching of class labels is not a concern in the general course of the maximum likelihood estimation via the EM algorithm for studies with only one replication, it was a serious problem in our simulation study because the same model was estimated iteratively for 500 replications per cell. To solve this problem, we used a simple strategy of considering all permutations of the class labels and the one with the lowest misclassification error was treated as the final class membership assignment (Lo, Brinkman, & Gottardo, 2008).
Results
For the purpose of comparing the performance of the MRM and SNMRM, the results of class enumeration, parameter estimation, and classification accuracy were summarized in pairs. Table 1 presents the percentages of one-, two-, and three-class models selected according to the eight aforementioned indices for the six simulated conditions examined. Tables 2 and 3 present the parameter estimates and classification accuracies averaged over 500 replications for each condition separately. All the one-, two-, and three-class MRM and SNMRM solutions converged properly. No offending parameter estimates (e.g., negative variances) were found in the estimated results.
Class Identification Results in Percentages for Six Simulation Conditions With Varying Degrees of Skewness.

Note. MRM = mixture regression model; SN = skew-normal; AIC = Akaike’s information criterion; BIC = Bayesian information criterion; CAIC = consistent AIC; SACIC= sample-adjusted CAIC; SABIC = sample-adjusted BIC; DBIC = difference in BIC; ICL = integrated completed likelihood.
Parameter Estimates and Associated Standard Errors for Six Simulation Conditions With Varying Degrees of Skewness.
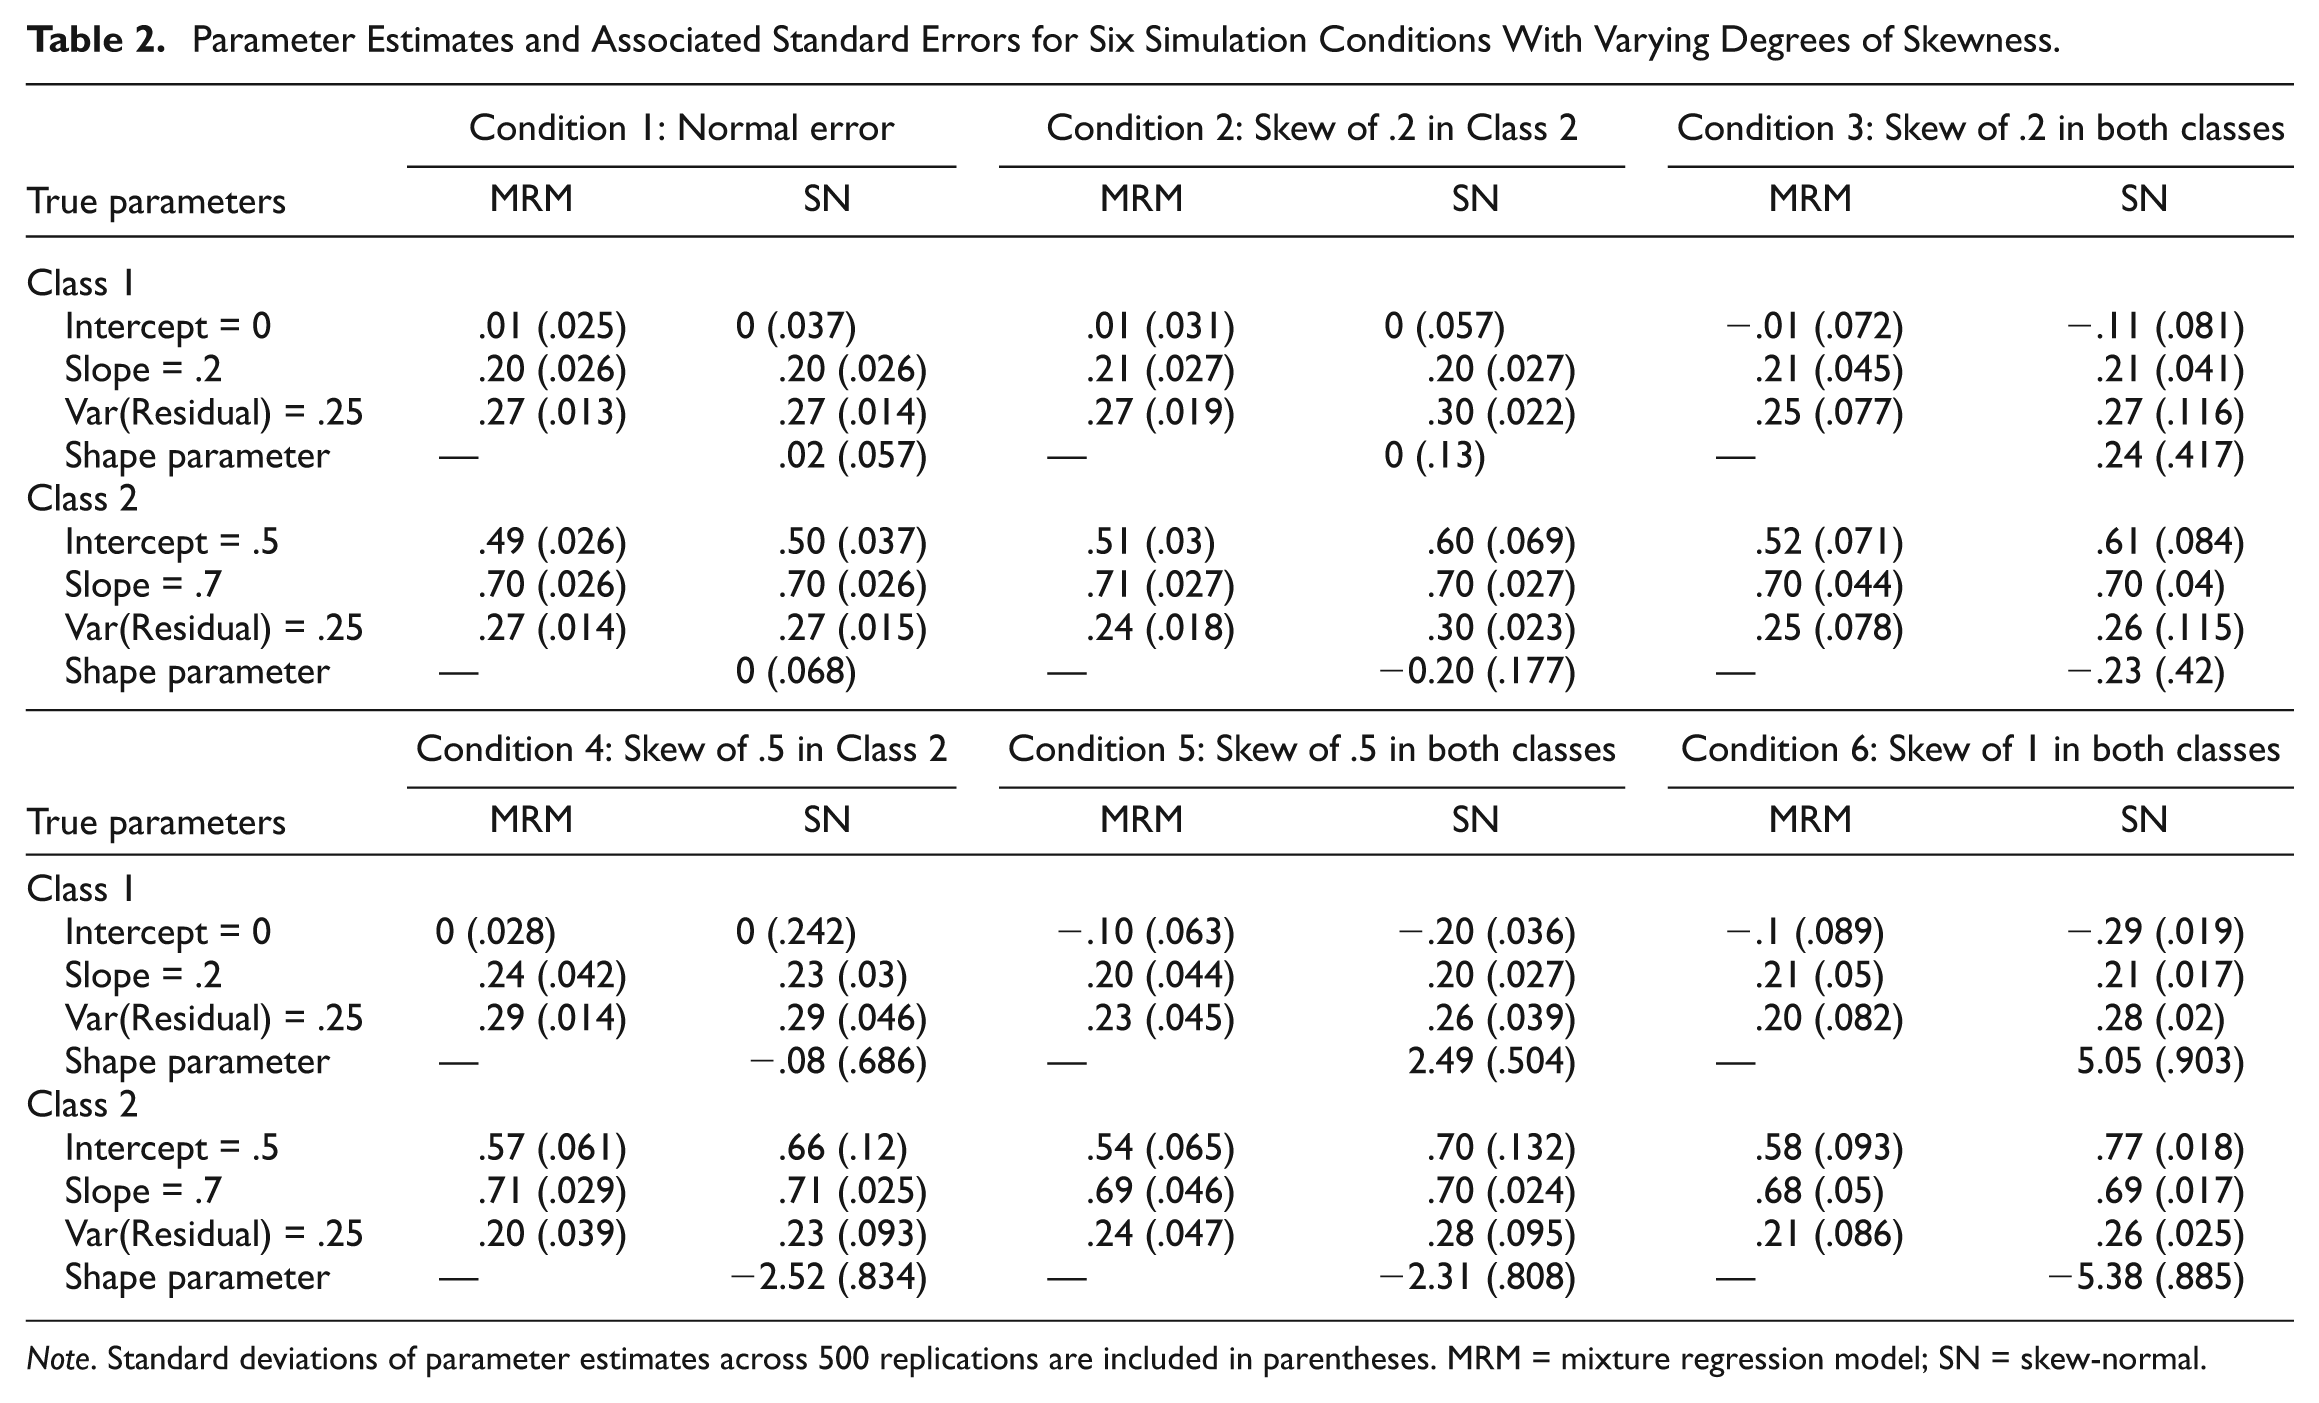
Note. Standard deviations of parameter estimates across 500 replications are included in parentheses. MRM = mixture regression model; SN = skew-normal.
Classification Results for Six Simulation Conditions With Varying Degrees of Skewness.
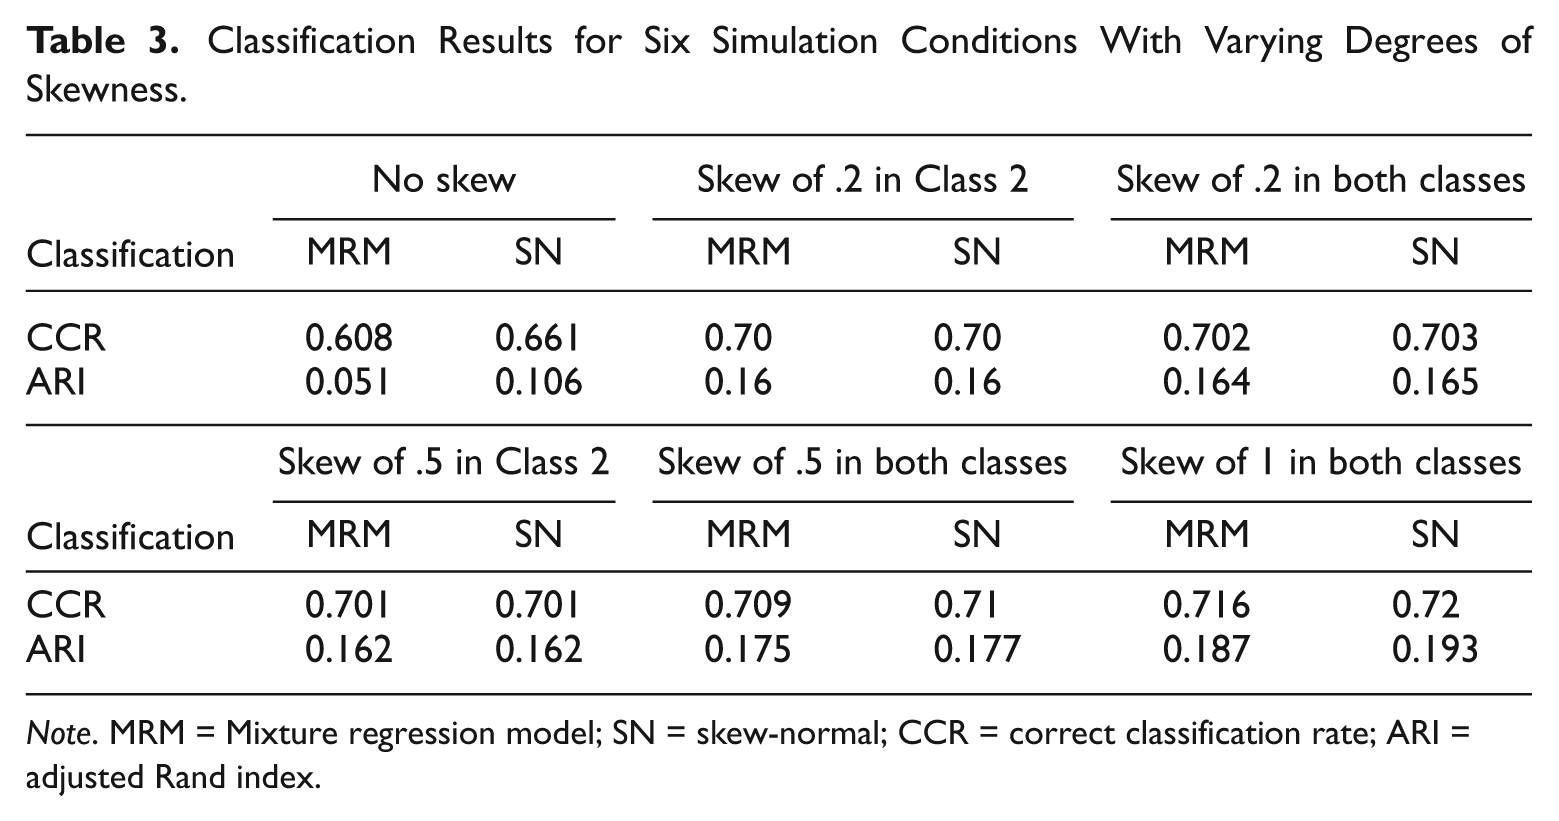
Note. MRM = Mixture regression model; SN = skew-normal; CCR = correct classification rate; ARI = adjusted Rand index.
Our first consideration was the accuracy of class identification. Inspecting the results of the six conditions with various degrees of skewed errors in either one or two groups, we found that all six information criteria tended to select three-class models to overfit the data as the degree of nonnormality increases. This result was consistent with previous findings (George et al., 2012; Van Horn et al., 2012). As shown in Table 1, when the normality assumption was met in Condition 1, by all criteria except AIC two-class models were correctly selected in more than 95% of the replications in both MRM and SNMRM. As a consequence, the SNMRM can be used as an alternative to the MRM in class enumeration under normal condition.
When mildly skewed errors of .2 were embedded in one or both groups, as demonstrated in Conditions 2 and 3 separately, the SNMRM was better than the MRM in terms of the performance of all model selection criteria. Moreover, BIC, DBIC, CAIC, SACAIC, Entropy, and ICL were prone to select the correct two-class model in the SNMRM with accuracy rates exceeding 95%. In contrast to the SNMRM results, model selection indices in the MRM were more likely to select the three-class model, especially when both classes had skewed errors, resulting in unacceptable rates of accuracy. A similar pattern was revealed in Conditions 4 and 5, in which skewness increases to .5 for one or both groups, revealing accuracy rates by most model fit indices in the SNMRM to decrease but still remain much higher than those in the MRM. Comparing Conditions 4 and 5, again, the selection rates of two-class models dropped down when both classes had skewed error. This considerable decrease indicated that all the model fit indices in the MRM were particularly sensitive to the change in skewed errors from one group to both groups. The results of Condition 2 through Condition 5 indicate that the SNMRM is a more robust model to mild skewness as compared with the MRM.
When the errors with skewness of .5 were in only one group in Condition 4, CAIC, BIC, entropy, and ICL selected the two-class SNMRM more than 95% of the time. However, with the same degree of skewness operating in both groups, none of the model fit criteria provided a sufficient rate of accuracy in determining the number of groups. When nonnormality reaches skewness of 1 in Condition 6, no model fit index performs well in class enumeration, although all the information criteria have a slightly better chance of selecting the two-class model in the SNMRM than in the MRM. Clearly, neither the SNMRM nor the MRM can effectively salvage nonnormal data when the skewness of error becomes large, although model fit indices in SNMRM generally outperform their counterparts in MRM.
For replications where the two-class model was correctly selected, our next inquiry concerned the model parameter estimates for the two-class MRM and SNMRM. When errors were normally distributed as shown in Condition 1 of Table 2, both types of two-class mixture models on average provided unbiased estimates for the intercept and slopes whereas both slightly overestimated the residual variance. The shape parameter estimates in the SNMRM are close to 0, which is reasonable given that the residuals meet the assumption of normality. However, as errors become more skewed, most estimates are more distorted as evidenced by the increasing magnitude of bias reflected by Table 2. In Condition 2 with very mild skewness of .2 in one group, the MRM and the SNMRM provide similar estimates for the group with normal error whereas SNMRM slightly overestimates the intercept for the other group with skewed error. The shape parameter estimates accurately capture that skewed residuals occurred in Class 2 with nonzero values. When both classes of residuals are skewed in Condition 3, the SNMRM overestimates both the intercept and residual variance noticeably.
As for the two conditions with skewness of .5, a similar pattern is observed: The two models tend to provide comparable and good estimates of the slopes, slightly biased but comparable estimates of the residuals variance, unbiased estimates of the intercepts for the group with normal error, and somewhat biased estimates of the intercepts for the group with skewed error. In the last condition with the severely skewed errors of 1 in both classes, slope estimates are similar in the MRM and the SNMRM and both models underestimate the intercept in Class 1 and overestimate the intercept in Class 2. The magnitude of bias is relatively larger in the SNMRM. Moreover, the MRM is prone to underestimate the residual variance whereas the SNMRM produces an inflated estimate of residual variance. The sign and magnitude of the estimated shape parameters are consistent with the specified model settings. Overall, once the two-class model was correctly identified, both the MRM and the SNMRM can provide comparable and reasonable estimates of the slopes but somewhat biased estimates for intercepts and residual variance across all six conditions. As the degree of skewness increases, the magnitude of bias of estimating intercepts in the SNMRM becomes larger than its counterparts in the MRM.
The empirical standard errors of these estimates, that is, the standard deviations of parameter estimates over the 500 replications, were also included in the parentheses of Table 2. Comparing these two mixture models, we found that as long as the estimates of intercepts and residual variance are not too biased (like those in Condition 6), the SNMRM generally provides estimates with less certainty across samples since their empirical standard errors are larger than those in the MRM. However, the SNMRM can provide the same or more accurate estimates for slope parameters with less uncertainty, as evidenced by the smaller standard errors across all the six conditions.
Finally, because of unavoidable prediction errors in regression, membership classification is not expected to be perfect. Comparing the MRM and the SNMRM in the CCR (see Table 3), the average posterior probability in SNMRM is greater than or equal to its counterpart in the MRM across all the conditions, implying that the SNMRM assigns membership to the subjects more accurately. The same results are seen with the ARI. Overall, the SNMRM can achieve better classification results than the MRM does once the number of latent classes is correctly identified.
Applied Example
Data for the applied study came from the National Survey of Child and Adolescent Well-Being (U.S. Department of Health and Human Services, Administration for Children, Youth and Families, 2003). This survey included children (newborn to 12 years) who were subject to child abuse or neglect, including a wide variety of physiological and psychological variables. Among them, one key variable was the head circumference for children from newborn up to 4 years of age. An inspection of the histogram of the variable as shown in Figure 2 indicated that some researchers might have measured the head circumference in inches even though they were instructed to use centimeters as the measurement units. Although the principal researchers were unable to contact individual field researchers to confirm this suspicion, a series of general linear model analyses using this variable (Liu et al., 2011) also suggest that the systematic measurement errors did occur and could be accommodated by mixture models. Taking into considerations of the possible consequence due to the systematic measurement error, we screened out observations with missing data or unrealistic values probably because of coding errors, and kept 2,013 children in the final sample. The sample has a mean of 39.10 cm and a standard deviation of 12.25 cm, which was inconsistent with prior finding regarding the head circumference in this age range. Thus, the apparently compromised first and second moment information could not be used directly for our focal regression analysis in which age is considered a useful predictor. Fortunately, mixture modeling is a promising technique to deal with such systematic measurement error. The two distinct linear patterns in the scatterplot of head circumference and age in month again implied the existence of the two latent classes. Therefore, class determination was not a substantial issue in this example but could serve as a means to compare the MRM and the SNMRM in effectiveness.
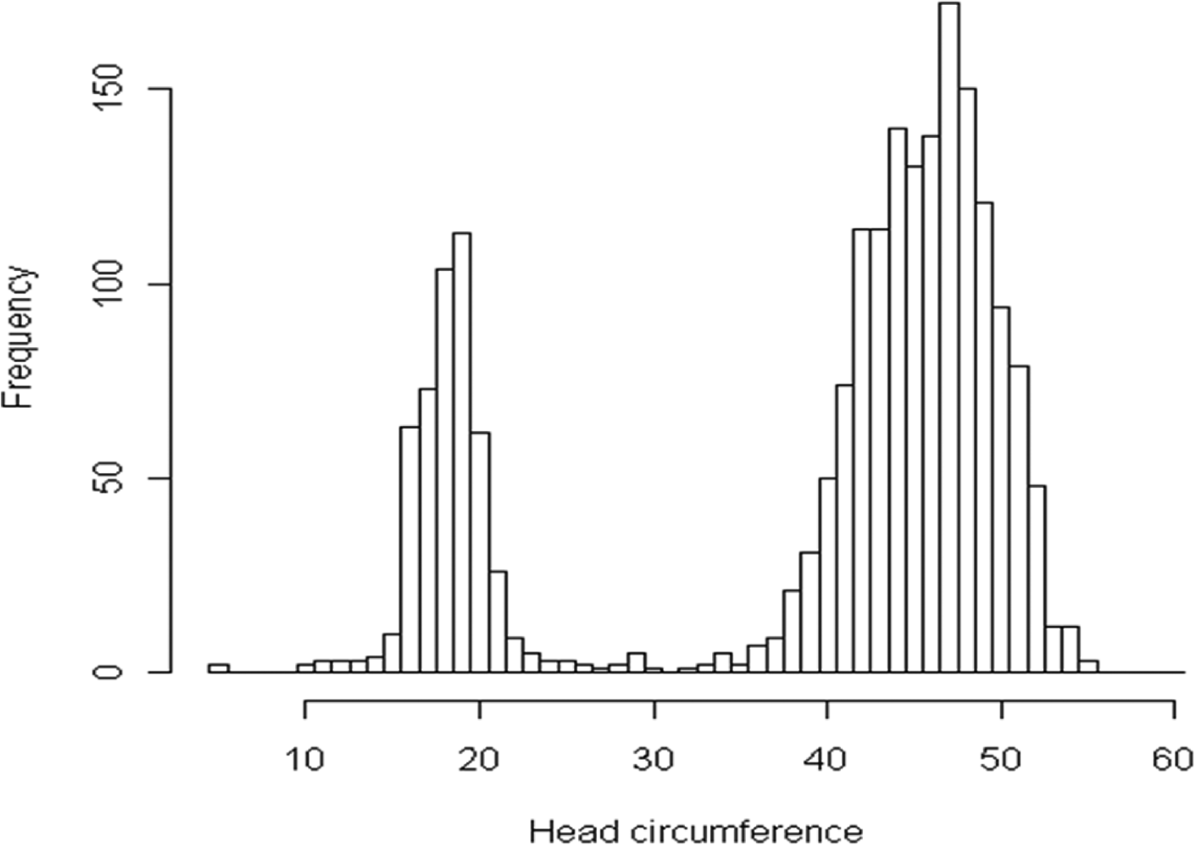
Histogram of head circumference.
In practice, the number of latent classes needs to be determined first for the MRM. Without a sound theoretical reason, a number of statistical indices are used together for this purpose. Despite the fact that the two-class model is believed to be the true condition in this case (cases measured in inches and cases measured in centimeters), all the model information criteria support the four-class models over the two-class model as Table 4 shows. In addition, both the bootstrap likelihood ratio test and the Lo-Mendell–Rubin likelihood ratio test supported the four-class model as well. (Because of computational intensity, the two tests were not included in our simulation study.) Consistent with previous findings, ICL and Entropy are more robust to nonnormal data in general. They serve better in the SNMRM than in the MRM with regard to class determination.
Class Identification Results for the Real Data Analysis.
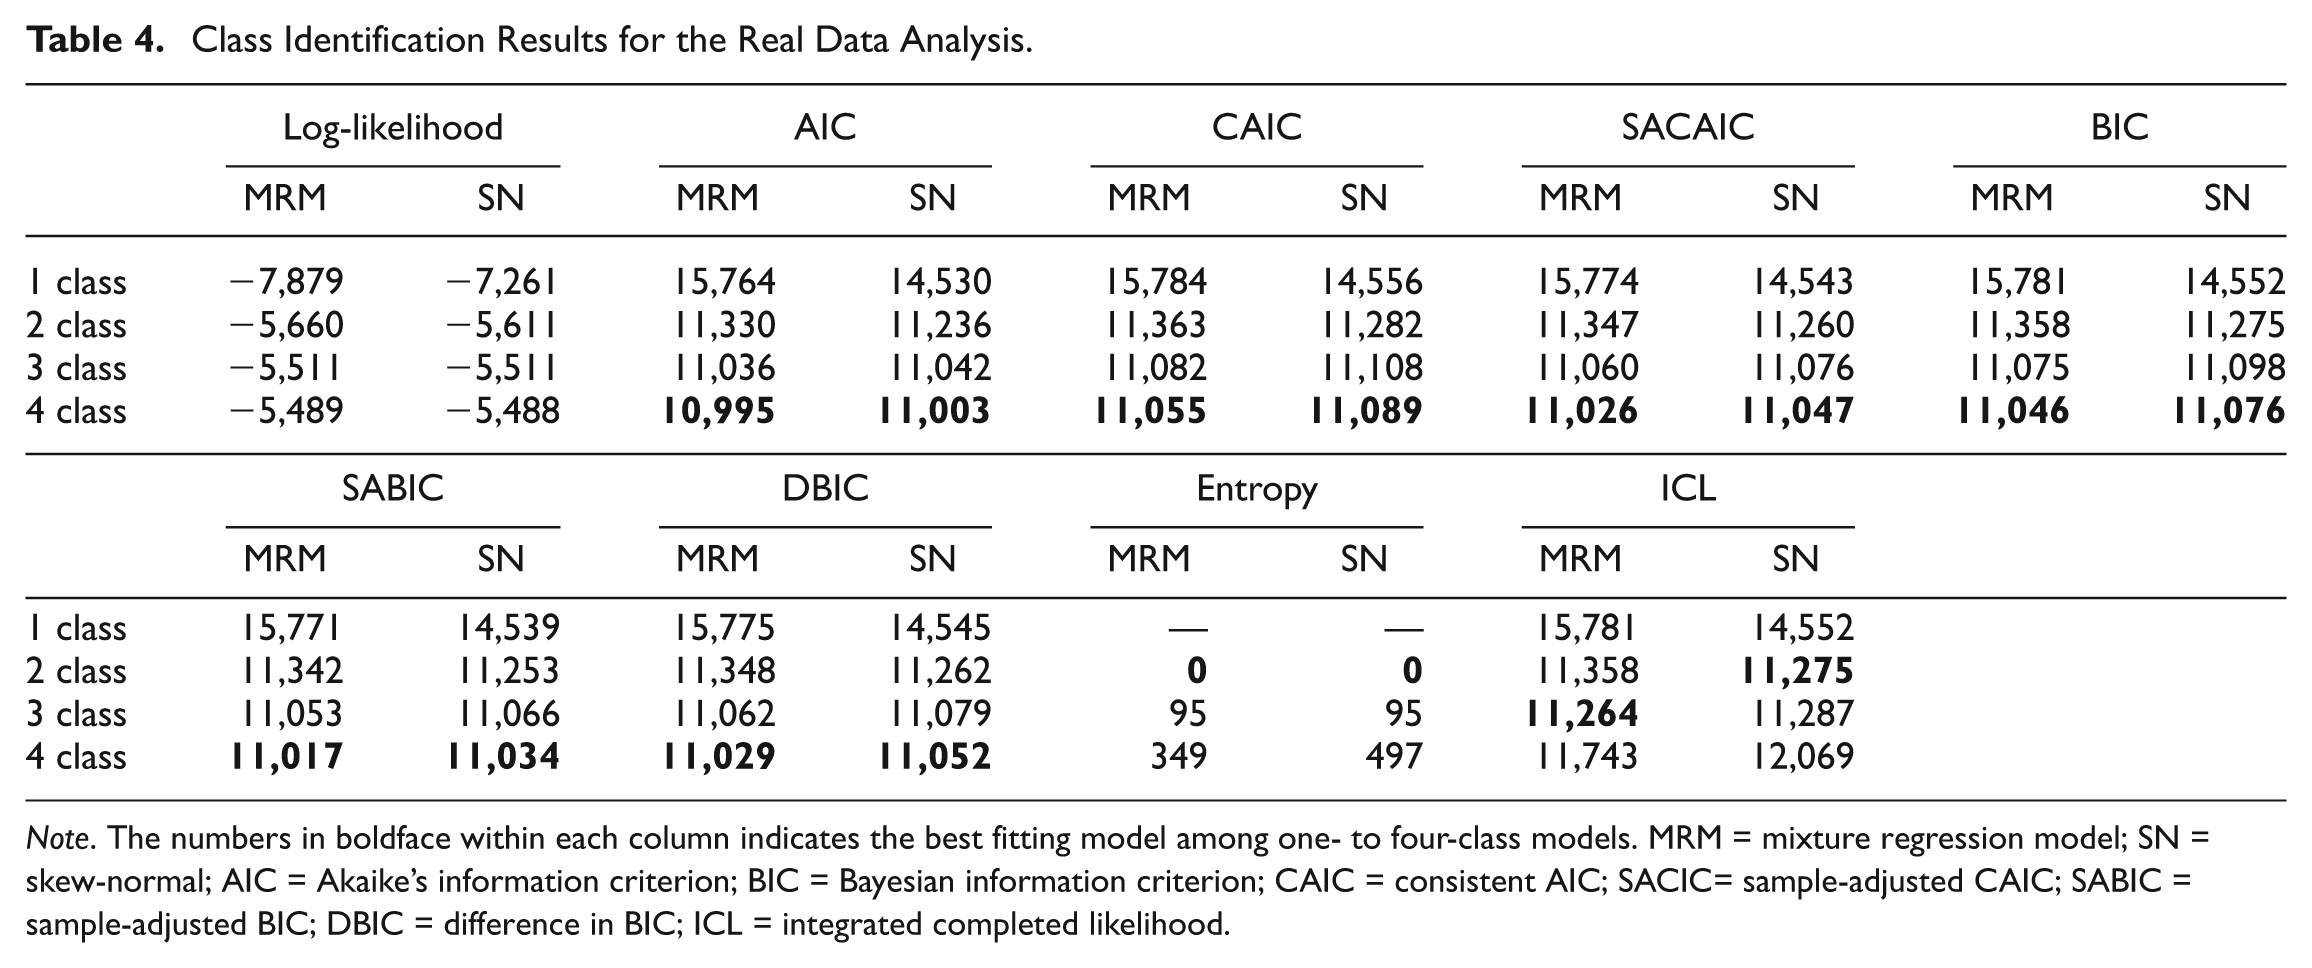
Note. The numbers in boldface within each column indicates the best fitting model among one- to four-class models. MRM = mixture regression model; SN = skew-normal; AIC = Akaike’s information criterion; BIC = Bayesian information criterion; CAIC = consistent AIC; SACIC= sample-adjusted CAIC; SABIC = sample-adjusted BIC; DBIC = difference in BIC; ICL = integrated completed likelihood.
A post hoc analysis showed that the two groups identified according to the two-class MRM estimated results exhibit a slight deviation from normality: The “inch” group had a skewness of −.5 and kurtosis of 2.2 whereas the “centimeter” group had a skewness of −.3 and kurtosis of −.1. This finding demonstrated that additional classes in the three- or four-class MRM might reflect a violation of the normality assumption even though the nonnormality may seem trivial. It is this negative finding that furthered our curiosity about the more robust SNMRM.
As seen in Table 5, the MRM and the SNMRM provided almost identical slope estimates and similar intercept estimates but considerably different estimates of the error variance. The estimated nonzero shape parameters for both classes indicate that the residuals were not normally distributed. In sum, the proposed SNMRM performed reasonably well for this data set.
Parameter Estimates for the Real Data Analysis.
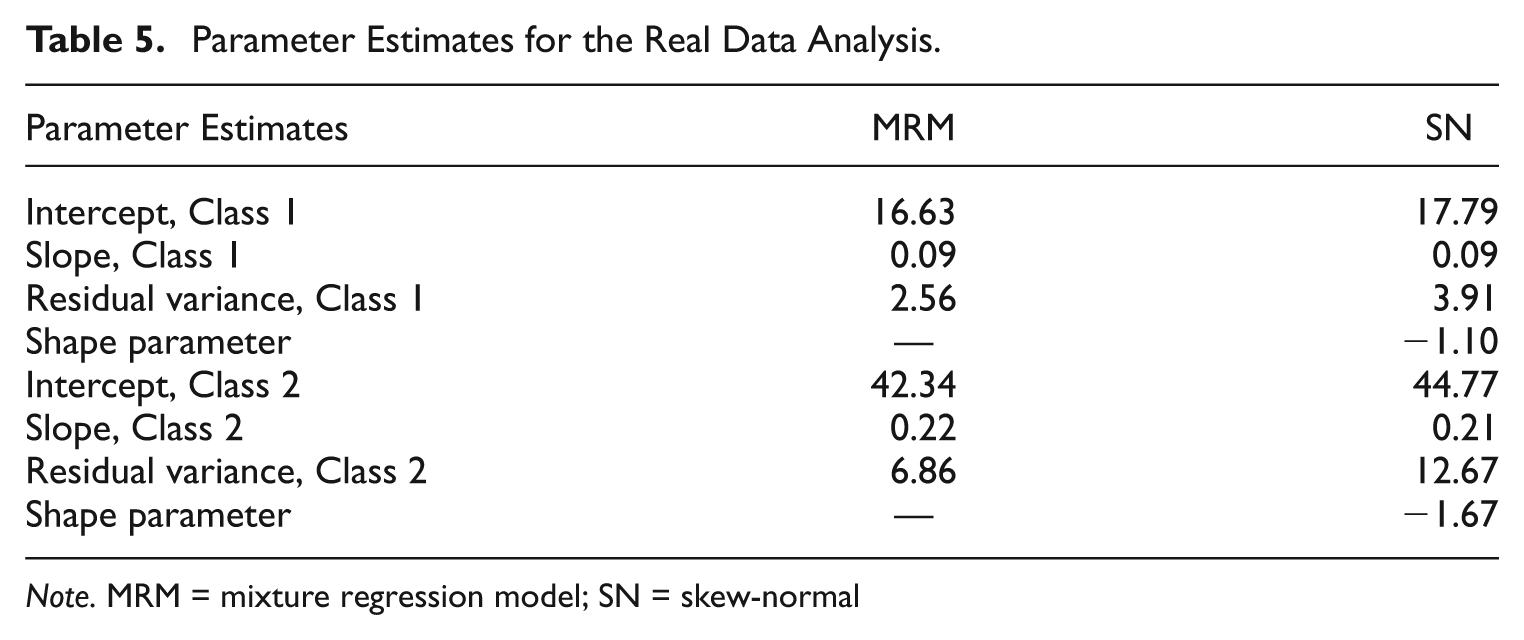
Note. MRM = mixture regression model; SN = skew-normal
Discussion
Human behaviors are complex. Human actions and reactions in environmental contexts might be heterogeneous. For example, students might differ in their ways responding to the same educational treatment/intervention that they receive. Considering differential effectiveness may help researchers to better understand the complex interactions between individuals and treatment and thereby better promote positive changes in different individuals. In light of more recognition of heterogeneous regression patterns underlying data and the capability of MRM in revealing such heterogeneity, the MRM is expected to have an increasingly widespread application in studying educational or other social and behavioral phenomena.
However, as exemplified in Figure 1, visual inspection of scatterplot may not be an effective way to detect heterogeneous regression patterns, which makes the communication and collaboration between quantitative researchers and content experts extremely necessary and important to apply this model validly in practice. Unfortunately, when it comes to class determination, unless researchers have clear theoretical expectation, very often they rely on model fit indices to find the optimal number of groups for MRM. As the current study and some other researchers (George et al., 2012; Van Horn et al., 2012) revealed, the MRM requires almost a perfect assumption of normality. Otherwise, it tends to overextract the number of groups to compensate the nonnormal errors. Because of this oversensitivity, the MRM is rendered useless for practitioners who need to explore the heterogeneous regression patterns underlying data. Therefore, as a robust version of the MRM, the SNMRM appears to be a more theoretically compelling modeling tool for practitioners because it can investigate differential effects of covariates and accommodate moderately nonnormal errors as well.
This study used both simulated and real data to investigate the performance of the SNMRM in comparison of MRM in the presence of skewed errors. Our first finding is that commonly used model selection information criteria in the MRM are all prone to enumerate spurious latent classes to fit the data even when the skewness is mild. As the degree of nonnormality increases, the chance of overextraction is inflated. In practice, even large samples may not guarantee that the residuals perfectly follow the hypothetical normal distribution. Moreover, in scenarios where one or more key covariates are missing from the linear composite of predictors, this assumption is even more likely to be violated. Entropy and ICL-BIC are relatively robust to mildly skewed errors but do not work well in more severe skewness conditions. As such, we suggest that practitioners be cautious when using information criteria–based indices for class enumeration in the MRM although they might be useful in this regard in other types of mixture modeling.
Both simulation results and real data analysis demonstrated that the SNMRM is more accurate in selecting the true number of latent classes under conditions with normal or mildly skewed errors. Unfortunately, the SNMRM fails to achieve satisfactory results in the presence of severely skewed errors, although it still outperforms the MRM in class determination. Once the number of latent classes is correctly identified, the SNMRM can estimate the slopes of the identified classes with more accuracy and certainty than the MRM whereas the MRM provided less biased estimates of the intercepts and residual variance than those in the SNMRM across the simulated skewed conditions. As such, given the correct number of latent classes, if researchers’ focal interest is the relation between covariate and dependent variables, that is, the regression coefficient, the SNMRM is a better option than the MRM since this skewed model can provide unbiased estimate of slope with better certainty across samples. But if the researchers are also interested to know the intercept or residual variance, the MRM is preferred because of the less biased estimates it can provide.
Although the SNMRM appears to be a flexible tool in regulating departures from normality, this conclusion has been drawn from the simulated scenarios included in this work. Generalizability to other conditions may be problematic. Additional research is necessary to understand the SNMRM further. To this end, more factors’ effects may be considered, such as mixture proportions, magnitude of the differential effects of covariate and residual variance, and so forth.
Another potential future work is that the robustness of the SNMRM against outliers might still be insufficient when data involve strongly heavy-tailed observations. Such weakness might be tackled by adopting a broader mixture family of component densities such as mixtures of skew t (Lin, 2010; Lin, Lee, & Hsieh, 2007) and mixtures of skew Student’s t-normal distributions (Lin, Ho, & Lee, 2013). Undoubtedly, the emergence of this more robust SNMRM to nonnormal errors is good news for practitioners who aim to investigate differential effects of intervention program on participants.
Footnotes
Appendix
Declaration of Conflicting Interests
The author(s) declared no potential conflicts of interest with respect to the research, authorship, and/or publication of this article.
Funding
The author(s) declared receipt of the following financial support for the research, authorship, and/or publication of this article: This research was supported by the National Science Council of Taiwan (Grant no. NSC101-2118-M-005-006-MY2).