
Abstract
There are well-defined theoretical differences between the classical test theory (CTT) and item response theory (IRT) frameworks. It is understood that in the CTT framework, person and item statistics are test- and sample-dependent. This is not the perception with IRT. For this reason, the IRT framework is considered to be theoretically superior to the CTT framework for the purpose of estimating person and item parameters. In previous simulation studies, IRT models were used both as generating and as fitting models. Hence, results favoring the IRT framework could be attributed to IRT being the data-generation framework. Moreover, previous studies only considered the traditional CTT framework for the comparison, yet there is considerable literature suggesting that it may be more appropriate to use CTT statistics based on an underlying normal variable (UNV) assumption. The current study relates the class of CTT-based models with the UNV assumption to that of IRT, using confirmatory factor analysis to delineate the connections. A small Monte Carlo study was carried out to assess the comparability between the item and person statistics obtained from the frameworks of IRT and CTT with UNV assumption. Results show the frameworks of IRT and CTT with UNV assumption to be quite comparable, with neither framework showing an advantage over the other.
Classical test theory (CTT) has been prominent in the field of educational measurement since the 1920s; however, for the last three decades, item response theory (IRT) has been the primary framework for educational measurement and psychometric issues. A commonly held belief is that the IRT framework is theoretically superior to the CTT framework for the estimation of person and item parameters because the person and item statistics based on the CTT framework are test- and sample-dependent, respectively. Specifically, the item statistics derived from the CTT-based models, item difficulty and item discrimination, are dependent on the sample of respondents selected to answer the items. If the same items are given to a different sample, and the item difficulty and item discrimination indices are computed on CTT-based models, they may vary substantially depending on the nature of the sample. Similarly, the scores earned by test takers depend on the items they have been asked to answer. If the test takers are given another set of more or less difficult items, their number-correct test scores likely are going to be lower or higher, respectively, than their number-correct scores on the original set of items.
In contrast to CTT, the person and item statistics based on IRT are considered to be stable across different samples of items and persons, respectively. As explained by Lord (1980), this perspective on the ability variable follows from viewing the item response function as a regression function of the observed test outcomes on the ability variable. The probability of observing a particular outcome likely is unaffected by how many among the test subjects has a particular level of ability. The invariance of the item parameters follows conceptually from this framing of the item response function as a regression function, with other elements in the function conceived as fixed parameters.
We have found nothing in the literature that examines this item parameter estimate stability via simulation, that is to say, that examines variation in parameter estimates at moderate sample sizes. Nonetheless, this conceptual stability property often seems attributed to parameter estimates as well.
In previous simulation studies, researchers have used IRT models both as generating and as fitting models, which confounds comparability between CTT and IRT frameworks with data-model congruity. An alternate explanation for results favoring the IRT framework is that IRT was used to generate the data, and thus, the data will more naturally fit this model. In addition, researchers have chosen traditional CTT item statistics, proportion correct and point–biserial correlations, and a traditional person-statistic, unweighted total scores, for the comparability comparison. But there is considerable literature suggesting that it may be more appropriate to use statistics based on an underlying normal variable (UNV) assumption, such as thresholds and biserial correlations.
Despite well-defined theoretical differences between the CTT and IRT frameworks, the empirical research comparing the two frameworks has failed to exhibit differences between the two in terms of person and item parameter estimates. To explore the distinctions between the two frameworks in greater depth, we first present a review of the empirical literature comparing them. Prior simulation studies have exclusively used IRT models to generate the data, and the literature does not consider models with an UNV assumption common in factor analytic models for categorical data. However, recent literature has introduced models with an UNV assumption as an extension of the CTT framework. As both IRT models and CTT-based models with the UNV assumption have been demonstrated to be members of the class of confirmatory factor analysis models, we expect a high level of comparability between results obtained under related member models. To test this theory, we compare item and person statistics for the extended CTT framework and the IRT framework using data generated under both frameworks. That we simulate data under each framework is, to our knowledge, a unique contribution.
Literature Review
Prior studies comparing CTT and IRT frameworks have not found that differences between the two translate to advantage of one framework over another. Many works have mentioned IRT parameter invariance as part of a general introduction of the IRT model (see, e.g., Hambleton & Jones, 1993; Sharkness & DeAngelo, 2011). Rudner (1983) examined how the magnitude of an item discrimination value should change if the location of the ability variable is not the same for two groups of examinees. Cook, Eignor, and Hessy (1988) compared three administrations of a Biology achievement test in part to examine stability of IRT item parameter estimates. They found lack of stability, noting that it is affected by the advancement in skill level of the test-takers. We have found no prior literature examining IRT parameter invariance via simulation. Prior studies comparing estimates under CTT and IRT paradigms show high correlations between CTT and IRT not only for person ability but also for item difficulty (Courville, 2004; Fan, 1998; Lawson, 1991). Fan’s (1998) research in particular “failed to support the IRT framework for its ostensible superiority over CTT in producing invariant item statistics” (p. 378). Item discrimination indices are less highly correlated between the two frameworks, dipping as low as 0.60, particularly when the range of difficulty parameter values exceeds 0.5 in absolute value (Fan, 1998; MacDonald & Paunonen, 2002). These correspondences are highest when the traditional CTT statistics are compared to the corresponding item statistics in one- and two-parameter logistic IRT models (Fan, 1998; MacDonald & Paunonen, 2002). All these studies use IRT as the data generation model.
Some attempts have been made to relate one framework to the other (Hambleton & Jones, 1993; Lord, 1980; Miyazaki, 2005). Lord (1980) presented approximate expressions for IRT item discrimination parameter and item difficulty parameter as functions of CTT item–biserial correlation and pass/fail threshold parameter. He called these relations “crude” and added that they “are given . . . not for practical use but rather to give an idea of the nature of the item discrimination parameter” (pp. 33-34). Miyazaki (2005) used two-level hierarchical generalized linear models as the intermediate framework to relate these two approaches, which additionally requires a normal distributional assumption on the observed test scores and the use of the identity link. This distributional assumption is not part of the core framework of CTT, making this approach for associating the two classes of model more restrictive.
Despite the empirically demonstrated similarities between the two modeling frameworks, the results have led some researchers to nonetheless conclude that the IRT framework is superior to the CTT framework (MacDonald & Paunonen, 2002). We see two problems with the body of prior research comparing the CTT and IRT frameworks. First, prior empirical studies have exclusively used IRT to generate the data; thus, empirical results favoring IRT might be due to the design of the study. Second, prior studies comparing CTT and IRT have not considered CTT-based models or statistics with a UNV assumption. However, recent literature has presented CTT-based models with a UNV assumption as legitimate, desirable extensions of the CTT framework (Raykov & Marcoulides, 2011).
Whereas previous efforts have sought to connect IRT to CTT with approximate expressions or with hierarchical models, other research supports a relation between a class of CTT models and some IRT models using confirmatory factor analysis to delineate the associations. This approach does not require a distributional assumption on the response as with Miyazaki (2005). Where CTT observed scores are considered as a result of tests containing a single, binary item, CTT can be applied to scored responses to individual items. This is possible because CTT assumes only the existence of the mathematical expectation of the observed score not that the observed score be continuous, contrary to popular misconception (Raykov & Marcoulides, 2011). Furthermore, the item scores from several such single item tests can be assumed to fit either parallel, tau-equivalent, or congeneric 1 CTT-based models, and these CTT-based models have been demonstrated as members within the family of confirmatory factor analysis models (DeVellis, 1991; Graham, 2006; Jöreskog, 1971). An extension, CTT-based models with a UNV assumption (Ferrando, 2000; Raykov & Marcoulides, 2011), has produced models shown to be members of the family of nonlinear confirmatory factor analysis models (Raykov & Marcoulides, 2011). The two-parameter IRT model (and the one-parameter model nested within it) has likewise been shown to be mathematically equivalent to nonlinear confirmatory factor analysis model (Kamata & Bauer, 2008; McDonald, 1999; Takane & de Leeuw, 1987; Wirth & Edwards, 2007).
As both the CTT-based models with a UNV assumption and the one- and two-parameter IRT models have been demonstrated to be members of the class of nonlinear confirmatory factor analysis models, we expect a high level of similarity between results when the two frameworks are assessed under comparable conditions. We compare the two formulations using simulated data generated in each framework and compare that framework’s parameter estimates to those resulting from the fit of the analogous model in the other framework. We thereby show relations between the two classes under conditions of parity.
Method
Overview
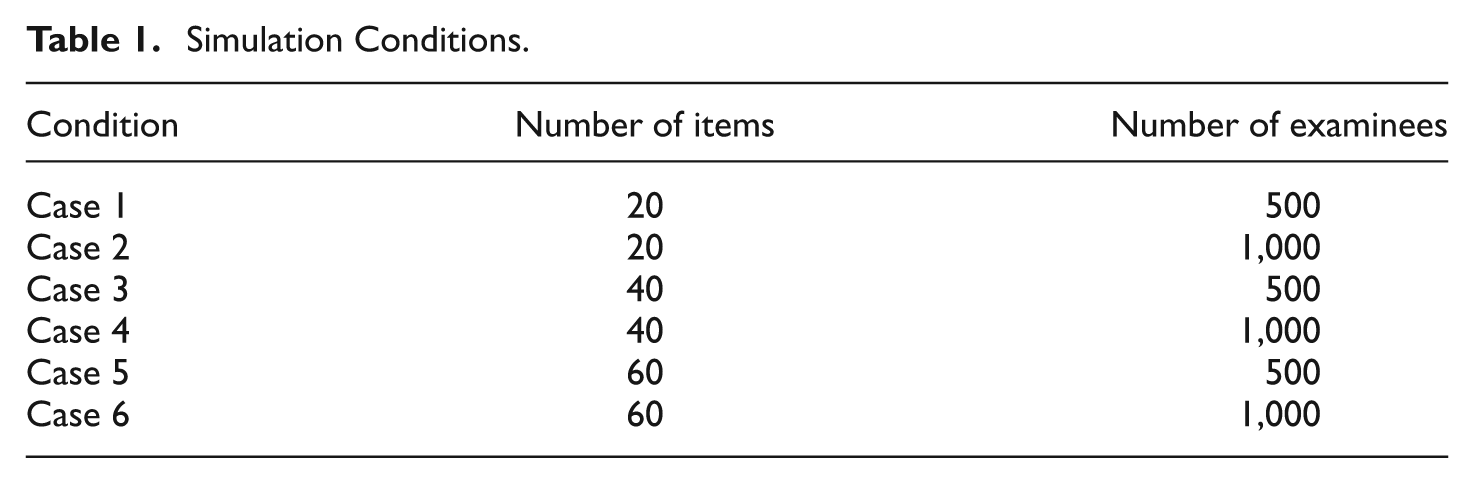
A small Monte Carlo simulation study was carried out to examine whether results reported in the literature held when the data generation model was varied (i.e., data were generated under both IRT framework and CTT with UNV assumption framework). The simulation design was composed of two conditions/factors: test length (total number of items) and number of examinees. We chose these two factors for the simulation design because we expect them to affect the magnitude of comparability between the item and person statistics arising from the CTT with UNV assumption framework and those from the IRT framework. Small sample sizes are known to affect item parameter estimates adversely, and short tests are known to affect person ability estimates adversely. The test length factor took values of 20, 40, and 60 items, whereas the number of examinees factor took values of 500 and 1,000 examinees. Thus, the combination of manipulated factors
Simulation Conditions.
Within each manipulated condition, data sets were generated for each of four models: two models from CTT with UNV assumption, the parallel and the congeneric models, and two from IRT, the one-parameter logistic (1PL) and two-parameter logistic (2PL) models. The tau-equivalent CTT-based model with the UNV assumption was not used in the simulation study, because with the UNV assumption, the tau-equivalent model is functionally equivalent to the parallel model. This is due to the fact that constraining the loadings also results in the error variances being equal to one another. The four models used in the study are explained in detail in the following sections.
The One-Parameter Logistic Rasch Model
This model is the more restrictive of the two IRT models. All items are given the same weight in determining the level of the latent construct for an individual. This model is typically presented in its logistic form for an individual as
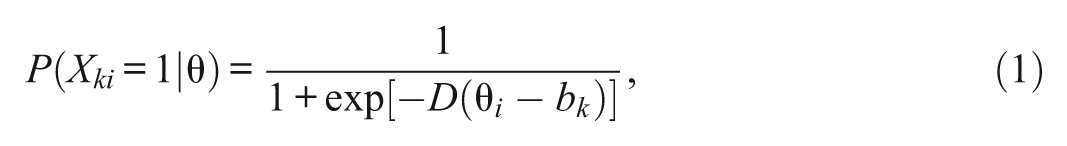
where
In the 1PL model, the relevant person statistic is an estimate of
The Two-Parameter Birnbaum Model
This model is considered to be the less restrictive model of the two IRT models. Items that are more discriminating are given greater weight in determining the level of the latent construct for an individual. This model typically is presented in its logistic form as

where
In the 2PL model, the relevant person statistic is an estimate of
The Underlying Normal Variable Assumption
The UNV assumption is a popular approach in the latent variable modeling literature (Jöreskog, 1990; Mislevy, 1986; Muthén, 1978, 1984; Muthén & Christoffersson, 1981; Takane & de Leeuw, 1987). Each observed binary item score variable
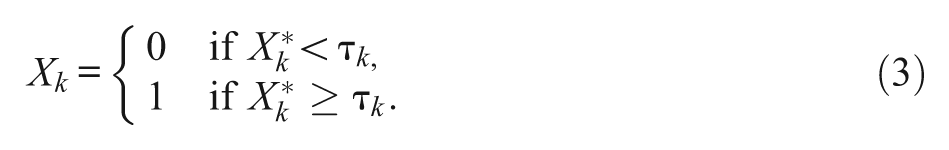
The UNV
The Parallel Model With the UNV Assumption
Applying the UNV assumption to the parallel model concept (Ferrando, 2000),

and
where
The Congeneric Model With the UNV Assumption
Applying the UNV assumption to the congeneric model concept (Ferrando, 2000), the UNV item scores
where
In the congeneric model with the UNV assumption, the relevant person statistic is an estimate of
Data Generation
The discrimination parameter,
and
Thus, for the parallel model with the UNV assumption, the threshold,
Analysis
On fitting the models, the correlations of person and item estimates were calculated. Correlations were computed across pairings of two sets of statistics: the IRT statistics and the CTT with UNV assumption model statistics. The correlation of theta,
Results
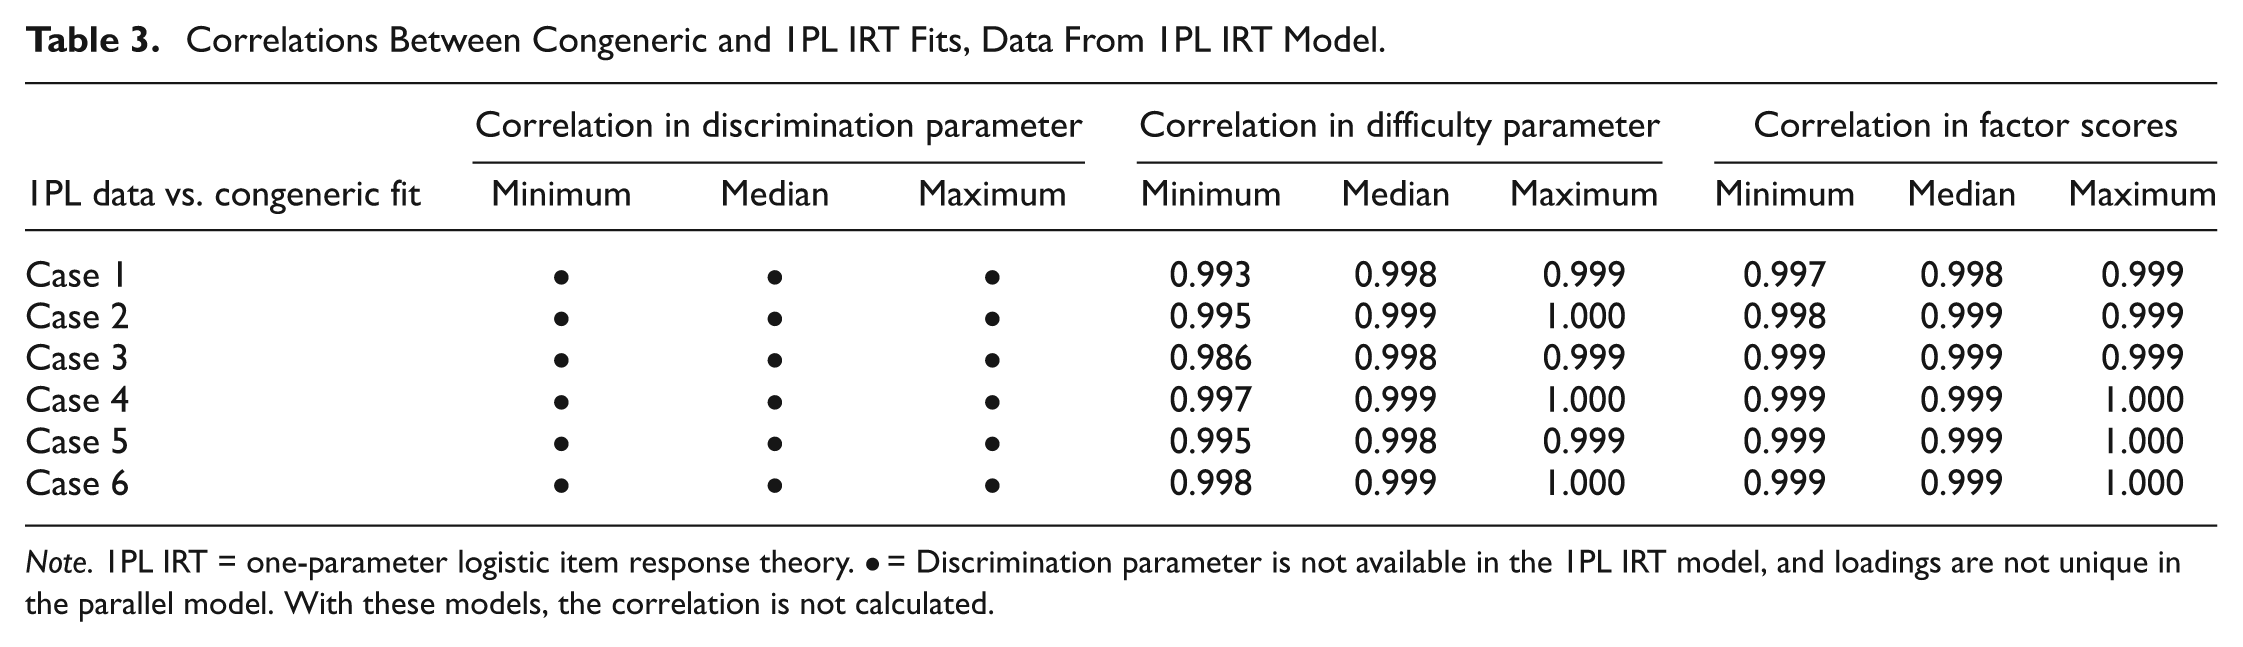
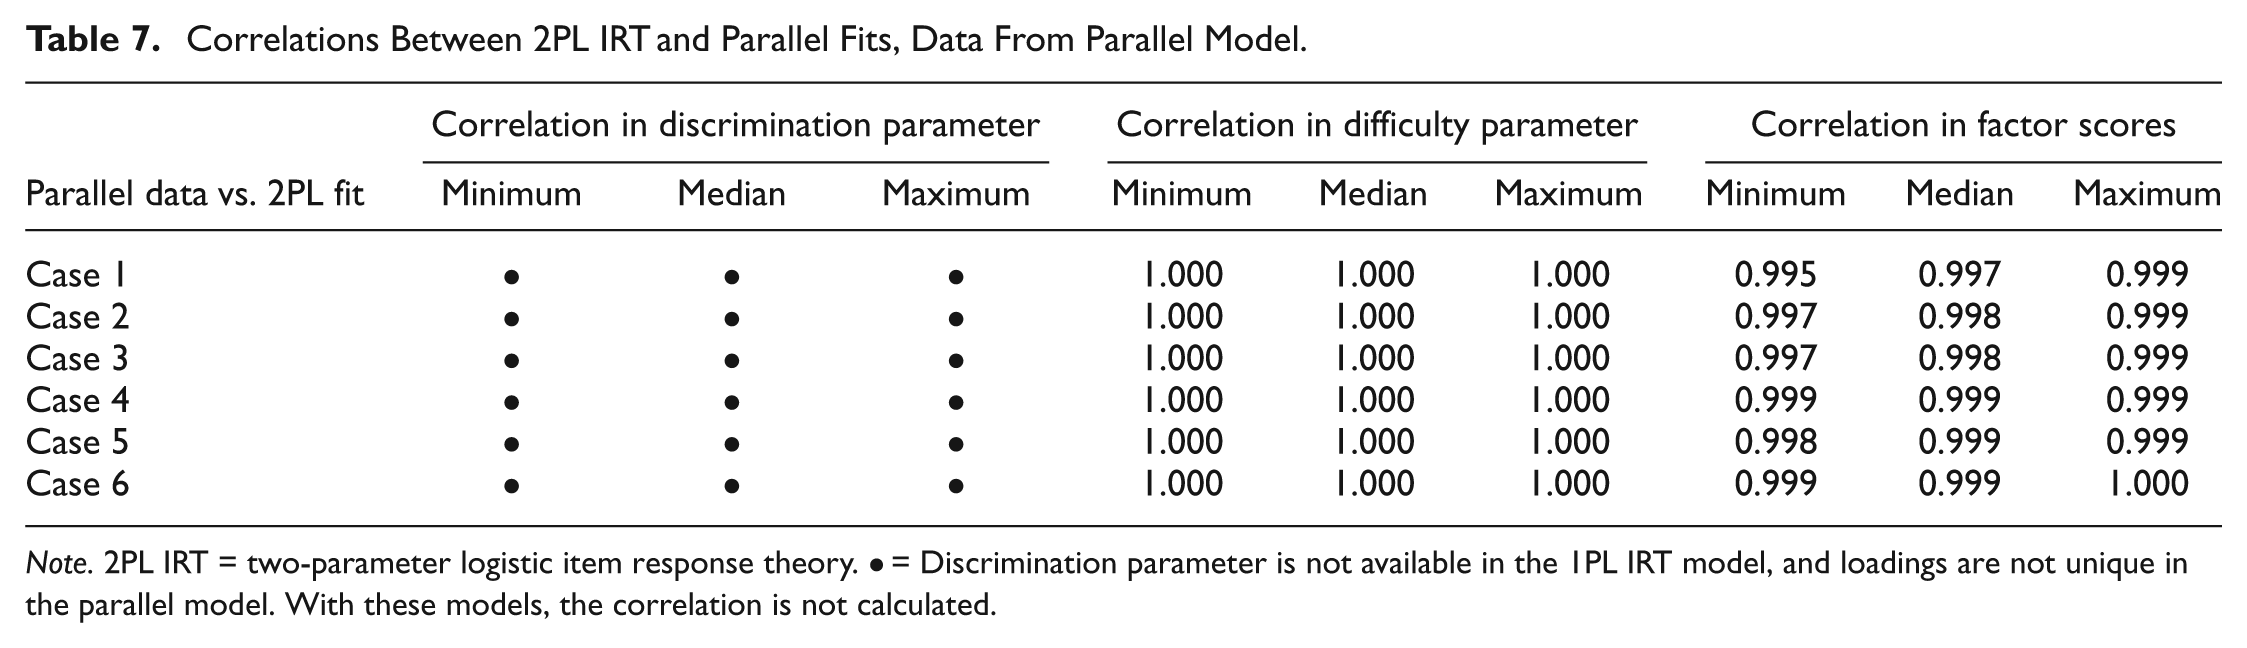
Results appear in Tables 2 to 9. Each table presents results for one of the model pairings. The same model used to generate the data was fit back to the data, and the resulting estimates were compared to another model. Tables 2 and 3 concern data generated by the 1PL IRT model. The 1PL IRT model fit is compared with the parallel CTT with UNV assumption model in Table 2 and to the congeneric CTT with UNV assumption model in Table 3. Tables 4 and 5 concern data generated by the 2PL IRT model, compared again to the parallel and congeneric CTT with UNV assumption models.
Correlation Between 1PL IRT and Parallel Fits, Data From 1PL IRT Model.
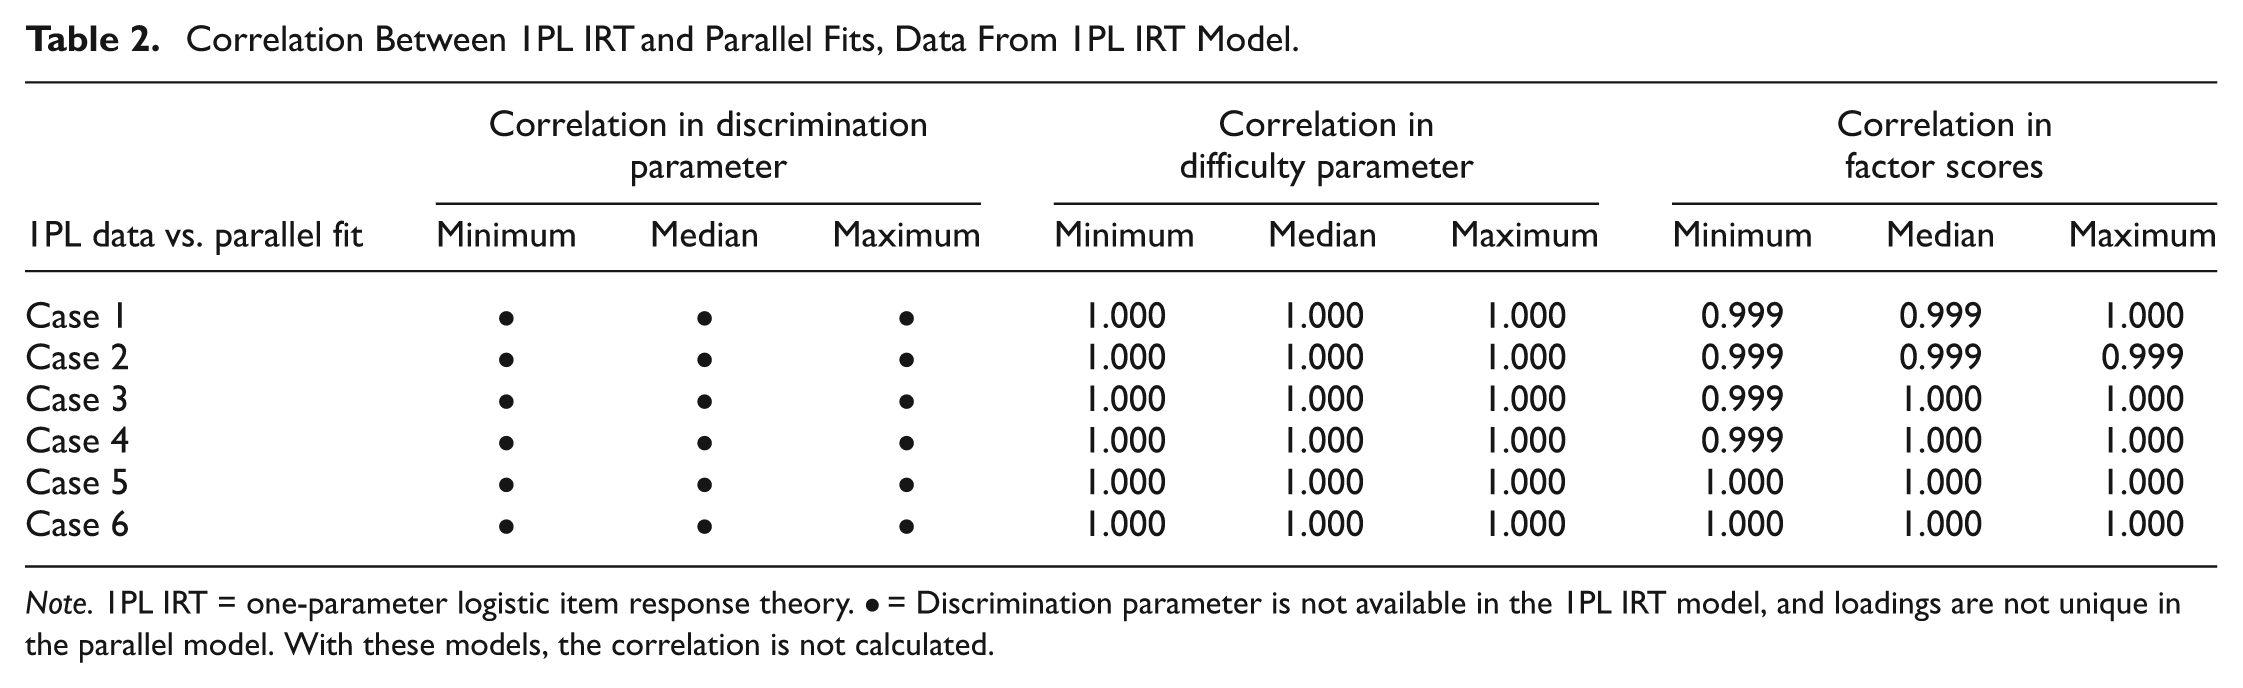
Note. 1PL IRT = one-parameter logistic item response theory. • = Discrimination parameter is not available in the 1PL IRT model, and loadings are not unique in the parallel model. With these models, the correlation is not calculated.
Correlations Between Congeneric and 1PL IRT Fits, Data From 1PL IRT Model.
Note. 1PL IRT = one-parameter logistic item response theory. • = Discrimination parameter is not available in the 1PL IRT model, and loadings are not unique in the parallel model. With these models, the correlation is not calculated.
Correlations Between Parallel and 2PL IRT Fits, Data From 2PL IRT Model.

Note. 2PL IRT = two-parameter logistic item response theory. • = Discrimination parameter is not available in the 1PL IRT model, and loadings are not unique in the parallel model. With these models, the correlation is not calculated.
Correlations Between Congeneric and 2PL IRT Fits, Data From 2PL IRT Model.

Note. 2PL IRT = two-parameter logistic item response theory.
Correlations Between 1PL IRT and Parallel Fits, Data From Parallel Model.

Note. 1PL IRT = one-parameter logistic item response theory. • = Discrimination parameter is not available in the 1PL IRT model, and loadings are not unique in the parallel model. With these models, the correlation is not calculated.
Correlations Between 2PL IRT and Parallel Fits, Data From Parallel Model.
Note. 2PL IRT = two-parameter logistic item response theory. • = Discrimination parameter is not available in the 1PL IRT model, and loadings are not unique in the parallel model. With these models, the correlation is not calculated.
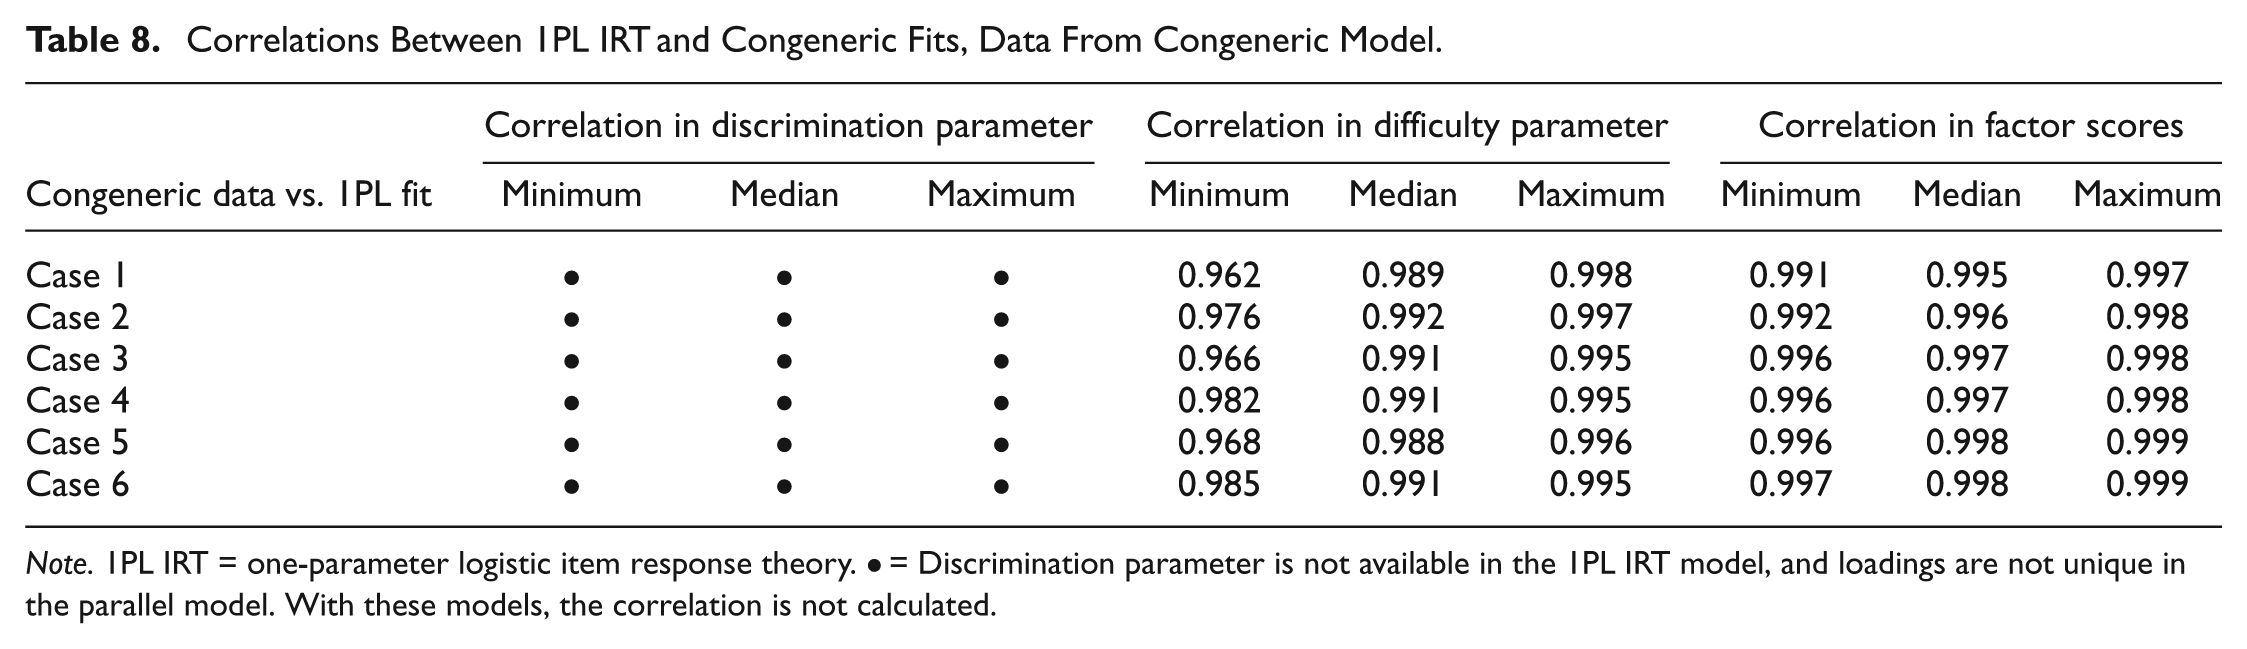
Correlations Between 1PL IRT and Congeneric Fits, Data From Congeneric Model.
Note. 1PL IRT = one-parameter logistic item response theory. • = Discrimination parameter is not available in the 1PL IRT model, and loadings are not unique in the parallel model. With these models, the correlation is not calculated.
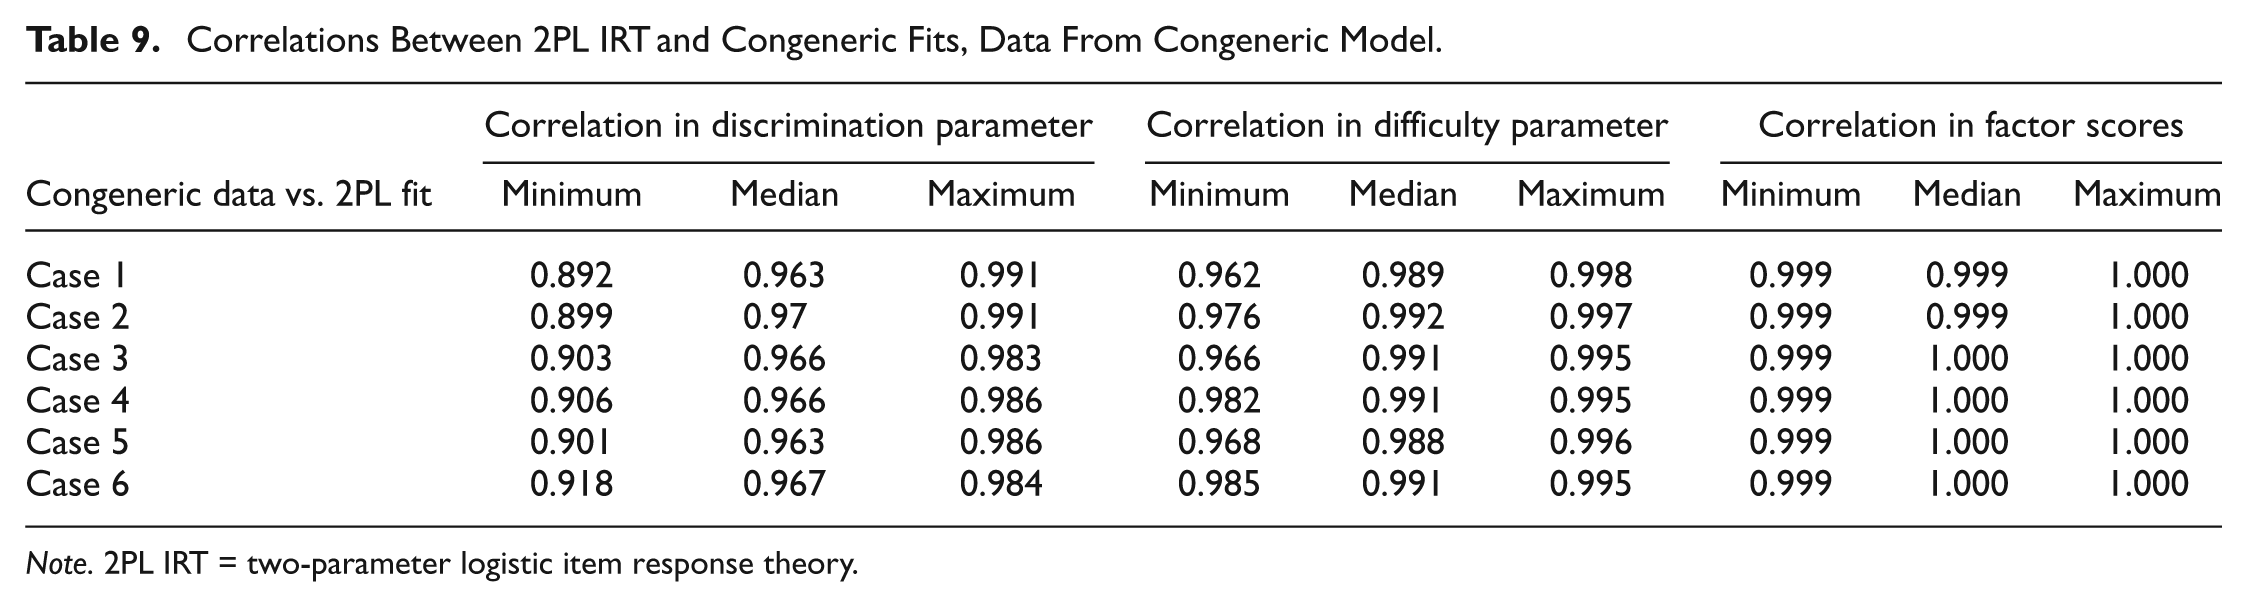
Correlations Between 2PL IRT and Congeneric Fits, Data From Congeneric Model.
Note. 2PL IRT = two-parameter logistic item response theory.
Tables 6 and 7 use data generated under the parallel CTT with UNV assumption model. The fit of the parallel model was compared with estimates from the 1PL IRT model in Table 6 and the 2PL IRT model in Table 7. Tables 8 and 9 make similar comparisons using data generated under the congeneric CTT with UNV assumption model.
Thus, Tables 2 and 6 make the same comparisons, estimates from the 1PL IRT model and the parallel CTT with UNV assumption model. In Table 2, the data originate from the 1PL IRT model, whereas in Table 6, the data originate from the parallel CTT with UNV assumption model. Analogous pairings occur for Tables 3 and 7, Tables 4 and 8, and Tables 5 and 9.
The results of the analyses comparing IRT item difficulty parameter estimates with those for item threshold
The results of the analysis comparing IRT item discrimination parameter estimates with those for factor loading
Finally, correlations of factor score estimates to those for ability parameter, the last three columns in each of Tables 2 to 9, also are quite strong across all conditions and model pairings.
There was almost no difference in correlation values for analogous pairings regardless of the model from which the data were generated. For example, the correlations calculated between the difficulty parameter estimate for 1PL IRT and threshold parameter estimate for congeneric CTT with UNV assumption when the data were generated from the 1PL IRT model, Table 2, were quite similar to correlations calculated between those parameters for those models when the data were generated from the congeneric model, Table 6. The exception is with discrimination parameter estimates; correlations were slightly lower when the data were generated with the 2PL IRT model, Table 5, than when the data were generated with the congeneric CTT with UNV assumption model, Table 9.
Discussion
The findings of this study reflect results in the literature. Item difficulty parameter estimates obtained from the IRT and the CTT with UNV assumption models were highly comparable across all conditions and model pairings. This is consistent with the findings of Fan (1998) and MacDonald and Paunonen (2002). The correlation for item discrimination parameter estimates obtained from the IRT and the CTT with UNV assumption models were lower, also reflected by Fan (1998) and MacDonald and Paunonen (2002). We find greater sensitivity to sample size than to test length, though the difference between small and large sample size is more pronounced for shorter tests.
For the most part, the correlations were high for all model pairings regardless of which element in the pair had served as the data generation model. Only in the discrimination parameter estimate correlations is any noticeable difference seen. This finding lends support to the idea that the two modeling frameworks have equal merit.
MacDonald and Paunonen (2002) suggested high accuracy for the discrimination parameter, as measured by correlation of estimate to true value, only when the difficulty parameter is restricted to a narrow range. Such a finding can be expected in light of the characterization by McCullagh and Nelder (1989) of the relationship between logistic and probit functions as “almost linearly related over the interval
The accepted view of IRT item parameter invariance is founded on the parameters’ function in the abstract model concept. In contrast, the understood susceptibility of item statistics in the CTT framework to variations in data concerns specific sample estimates. Purported superiority results from a comparison of unlike concepts. In this article, we show comparability between the CTT with UNV assumption and IRT, both in concept and through correlation of analogous parameter estimates. The implication of this comparability is that the strength of the model concept in IRT can apply equally to a CTT-based model with UNV assumption. Conversely, cautions regarding parameter estimation in CTT-based models with UNV assumption apply to parameter estimation in IRT models as well.
The invariance of IRT item parameters at the conceptual level is not, actually, absolute. Lord (1980) notes that the location and scale of the ability variable is arbitrary. This fact means that, as noted by Rupp and Zumbo (2006), item parameters actually are invariant only up to a linear transformation unless the location and scale of the ability variable are held constant from test group to test group.
Moreover, the fact that parameter estimates often are sensitive to the sample on which the estimates are based is not inherently a defect. Such an attribute can allow the researcher to uncover variations that affect the outcome of interest and thus advance the field. Researchers need simply to keep this feature in mind when interpreting model results.
High correlations cannot distinguish the scenario of stable estimates between the two frameworks and the drift that is the same in each framework. This is a limitation of the present study. This study also does not directly examine parameter estimate stability as functions of either ability distribution of the test sample or sample size. An investigation focusing on the latter would represent an important contribution, since most performance attributes regarding parameter estimation rely on an assumption of a sufficiently large, yet unquantified, sample size. But real data are always limited in number.
The theoretical framework used here along with the correlation results show the frameworks of IRT and CTT with UNV assumption to be quite comparable, with neither framework showing an advantage over the other. This finding presents the opportunity for CTT with UNV models to be applied in contexts where they had not been considered previously.
Footnotes
Declaration of Conflicting Interests
The author(s) declared no potential conflicts of interest with respect to the research, authorship, and/or publication of this article.
Funding
The author(s) received no financial support for the research, authorship, and/or publication of this article.