
Abstract
When constructing multiple test forms, the number of items and the total test difficulty are often equivalent. Not all test developers match the number of items and/or average item difficulty within subcontent areas. In this simulation study, six test forms were constructed having an equal number of items and average item difficulty overall. Manipulated variables were the number of items and average item difficulty within subsets of items primarily measuring one of two dimensions. Data sets were simulated at four levels of correlation (0, .3, .6, and .9). Item parameters were estimated using the Rasch and two-parameter logistic unidimensional item response theory models. Estimated discrimination and difficulty were compared across forms and to the true item parameters. The average unidimensional estimated discrimination was consistent across forms having the same correlation. Forms having a larger set of easy items measuring one dimension were estimated as being more difficult than forms having a larger set of hard items. Estimates were also investigated within subsets of items, and measures of bias were reported. This study encourages test developers to not only maintain consistent test specifications across forms as a whole but also within subcontent areas.
Keywords
Large-scale testing companies often administer multiple test forms during a given administration to a set of examinees. Each form is intended to assess the same set of content at a similar cognitive level but with a different set of items. Oftentimes, a test does not measure a single content area, but it is composed of multiple, related subcontent areas (i.e., a mathematics test composed of algebra and geometry items), creating the potential of multidimensional data. Researchers have concluded that under certain criteria, the data may still be analyzed in a unidimensional context (Reckase, 1990). However, when item difficulty is confounded within multiple dimensions, the resulting unidimensional parameter estimates may be biased (Ackerman, 1987a, 1987b, 1989; Reckase, Ackerman, & Carlson, 1988). Many test developers are careful to maintain an equal number of items and total test difficulty when constructing multiple test forms, but not all maintain an equal number of items and/or average item difficulty within subcontent areas, for example, the American College Testing (ACT, 2007), the Iowa Test of Basic Skills (ITBS; Dunbar et al., 2008), and the Oklahoma Core Curriculum Tests (OCCT; Oklahoma State Department of Education [OSDE], 2013). The purpose of this study was to investigate the effects of estimating unidimensional item parameters across test forms that have the same number of items and total test difficulty overall, yet have confounding length and difficulty within subcontent areas. Item specifications for the current simulation study were taken from the ACT Mathematics Usage Test Form 24B (Reckase & McKinley, 1991); additional forms were constructed by altering the discrimination and/or difficulty of items within sets of items primarily measuring one of two dimensions, while maintaining equal total test difficulty across all forms.
Previous studies have simulated a real testing situation where a single test is composed of subsets of items that have confounding discrimination and/or difficulty within sets, but few have compared the results across multiple test forms that are known to have equal difficulty overall. Additionally, comparisons have not been made between the unidimensional estimated discrimination and difficulty with the multidimensional MDISC and MDIFF values, respectively.
In studies of a single data set, the estimated item discrimination and difficulty were not highly biased when a test was balanced, that is, the number of items primarily measuring one dimension was equal to the number of items primarily measuring a second dimension, even when the difficulty of the of the two sets of items was different (Ackerman, 1987a). On tests having an unequal number of items within sets of items measuring only one dimension or some combination of two dimensions, the estimated item discrimination and difficulty were biased (Reckase et al., 1988). The magnitude of the bias tended to differ across studies due to the inconsistencies in true specifications. Tests with items that discriminated more heavily on one dimension than the other tended to have an estimated discrimination equal to or slightly less than the average of the true values (Ansley & Forsyth, 1985; Reckase et al., 1988; Song, 2010) or equal to the sum of the true values (Way, Ansley, & Forsyth, 1988). Tests with items equally discriminating on the two dimensions were reported to be a lower estimate than both of the true discrimination values (Ackerman, 1987b) or a higher estimate than both of the true values (Song, 2010).
The estimated unidimensional difficulty within all sets of items was an unbiased estimate of the true multidimensional difficulty (d) in some cases (Reckase et al., 1988; Song, 2010) or an overestimate of the average of true unidimensional difficulty values (Ansley & Forsyth, 1985; Way et al., 1988). As the correlation between dimensions increased, measure of bias for item parameters tended to increase in some cases (Finch, 2010; Way et al., 1988) or decrease in others (Ansley & Forsyth, 1985; Way et al., 1988). Comparisons across studies could not be made because of inconsistent simulation specifications, models used, and software operated.
The ITBS (Dunbar et al., 2008) and the OCCT (OSDE, 2013) technical manuals indicate that the number of items within subcontent areas may differ across forms. Furthermore, few developers clearly state that difficulty for an entire test and within subcontent areas is matched across forms (Texas Education Agency [TEA], 2015a). When overall difficulty is not equal across forms, methods of equating are used to put all forms on the same scale (ACT, 2007; TEA, 2015b). Forms are equated as a whole, but not within subcontent areas, creating the potential still of subcontent areas that differ in difficulty across forms.
Current Study
In this study, six test forms were simulated; each had the same number of items and average item difficulty. Within sets of items primarily measuring one of the two dimensions, the item discrimination and/or difficulty was slightly adjusted. The goal was to create a realistic setting of multiple forms of a test that measures two content areas. For example, consider two forms of a mathematics test with items measuring both algebra and geometry. Overall, the forms had the same total number of items and average item difficulty. Form A had more algebra items at a high difficulty level and fewer easy geometry items; Form B had fewer easy algebra items and more geometry items that are hard. Even though these forms were similar overall, they differ within subcontent areas. If the same set of examinees interacted with all test forms, and the data were analyzed with the same model using the same software, how might item parameters be estimated differently across these forms? Would the average estimated total test difficulty be similar across all forms? Would the average estimated difficulty within subsets of items be affected by the confounding of the number of items and true item difficulty within dimensions? This study aims to address these questions.
A simulation study is valuable to address these research questions. By simulating data based on true parameters and analyzing the data under the same conditions, the estimated parameters can be directly compared across data sets and to the known true parameters. In practice, when test forms do not have equal average item difficulty overall, test forms are equated. However, in this simulation study, equating was unnecessary due to the construction of forms that were truly equivalent overall. This allowed for the investigation of the effects of the estimated item parameters across forms that were truly equivalent.
Unidimensional Item Response Theory
Item response theory (IRT) applies a probability model to response data in order to estimate item parameters, such as discrimination and difficulty, and to estimate examinees’ ability scores. The unidimensional model assumes that the items measure a single dominant factor. The two-parameter logistic model (2PL), Equation (1), from Rizopoulos (2010), estimates the probability of a correct response to item i for an examinee with a specific ability level, θ:
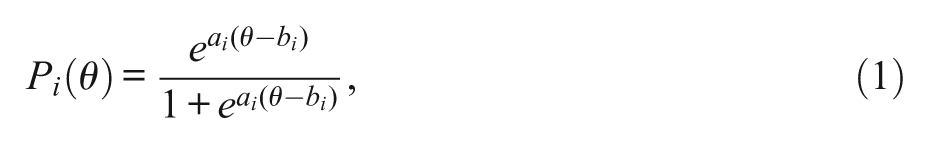
where Pi (θ) is the probability of a correct response to item i from an examinee with ability θ, ai is the discrimination parameter of item i, bi is the difficulty parameter of item i, and θ is the ability score of the examinee. A Rasch model is the case where the discrimination factor of all items is fixed to one.
Various unidimensional IRT models are used in practice. Items on the PISA test (Kastberg, Roey, Lemanski, Chan, & Murray, 2014) and the Texas Assessment of Knowledge and Skills test (TEA, 2015a, 2015b) are evaluated using an extension of the Rasch model. Items are analyzed using a 2PL model on the Upper-Elementary Mathematics Assessment Modules administered by Educational Testing Services (Hickman, Fu, & Hill, 2012). The Rasch and the 2PL models are applied in the current study because of their common uses by large-scale testing companies both nationally and internationally.
A common algorithm for estimating item parameters is the marginal maximum likelihood estimate (MMLE) based on an assumption of the ability distribution (Bock & Leiberman, 1970). Following the MMLE, the item parameter estimates are fixed, and the ability scores are estimated using maximum likelihood estimate or some Bayesian method (de Ayala, 2009). In this study, parameters were estimated with the methods of MMLE and the Bayesian procedure of expected a priori with the expectation-maximization and quasi-Newton algorithms.
Multidimensional Item Response Theory
Equation (2) (Reckase, 2009) represents the multidimensional IRT model where the exponent is in slope–intercept form. Here, the multidimensional item difficulty parameter takes into account the discrimination and difficulty across n dimensions:
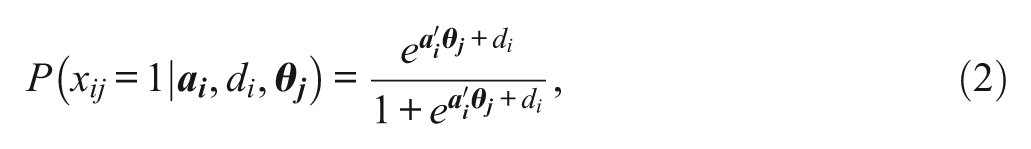
where

And
The maximum amount of discrimination for item i, or MDISCi , is provided in Equation (4):

The degree to which an item measures each dimension corresponds to an angle in the θ-space. This is a measure of the composite of abilities necessary to answer an item correctly. Equation (5) provides the degree to which an item measures each dimension, relative to θ 1:
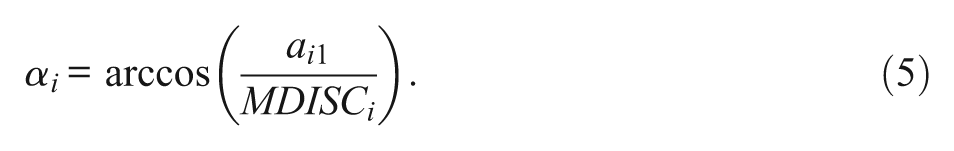
For the two-dimensional case, an item with αi = 45° equally measures the two dimensions, and requires an equal ability in each dimension to correctly respond to item i. An item with αi < 45° measures the first dimension more than the second, and an item with αi > 45° measures the second dimension more than the first. In the current study, items are grouped into sets of items which primarily measure one dimension or that almost equally measure the two dimensions based on this measure of αi .
The MDIFFi value, presented in Equation (6) (Reckase, 1985), takes into account the item discrimination and difficulty parameters across n dimensions:

The interpretation of the unidimensional difficulty parameter (bi ) is the opposite of the interpretation of the multidimensional item difficulty (di ) value, and the same as the interpretation of the MDIFFi value. An easier item, having a negative bi value, would have a positive di value and a negative MDIFFi value. A more difficult item, having a positive bi value, would have a negative di value and a positive MDIFFi value.
Method
Sample
Four two-dimensional true ability data sets of 1,000 examinees were created. Each followed a two-dimensional standard normal distribution and had a correlation of 0, .3, .6, or .9 between dimensions.
Data
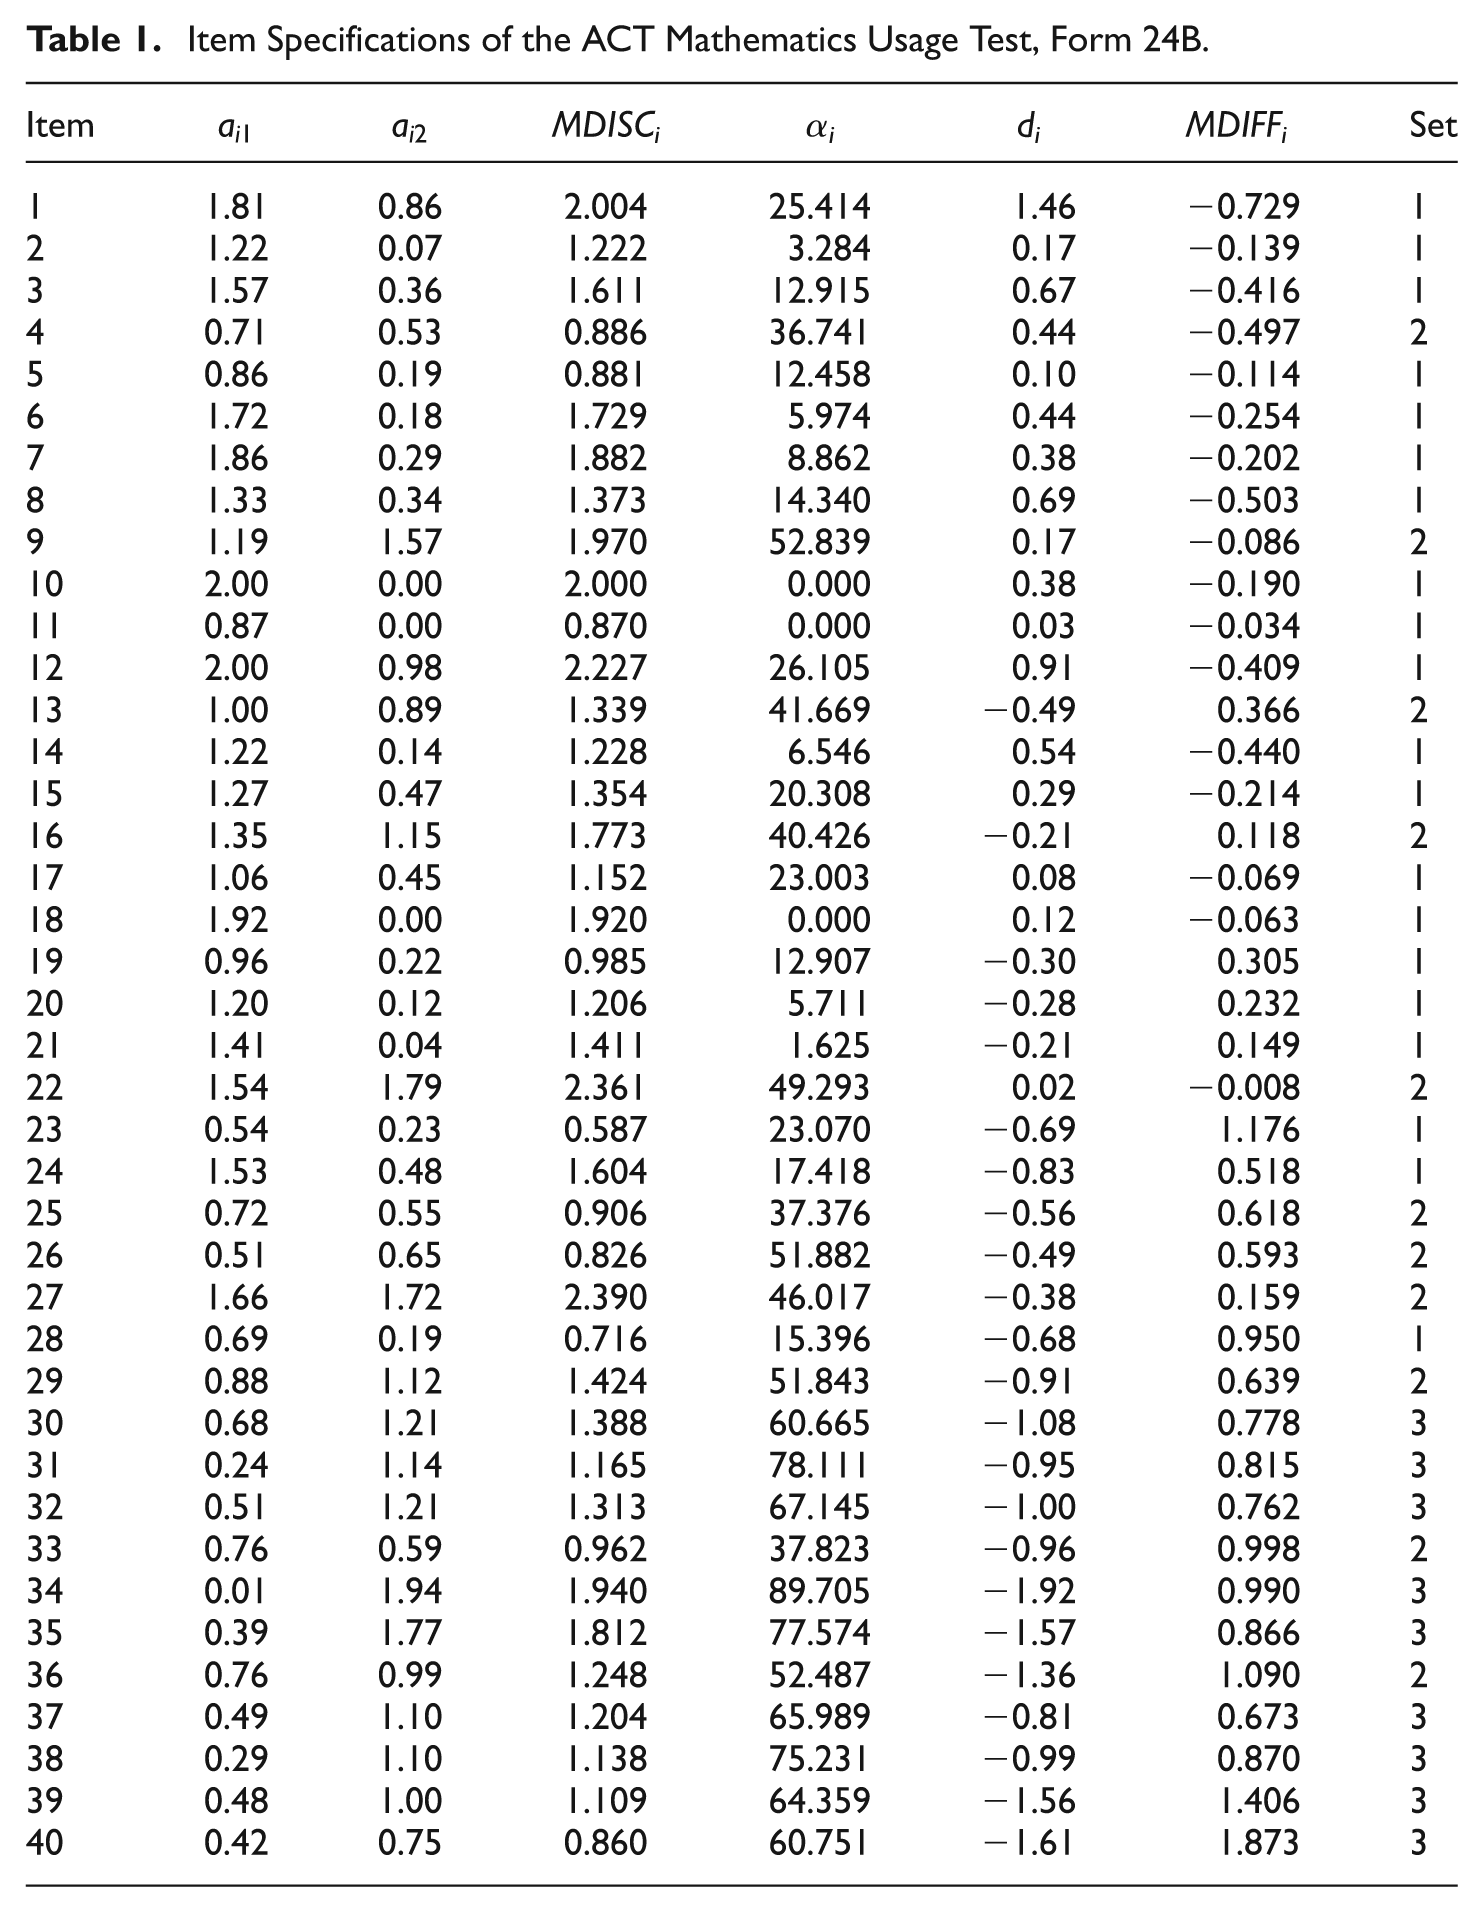
Specifications for the first test form were taken from Form 24B of the ACT Mathematics Usage Test (Reckase & McKinley, 1991). The item specifications are provided in Table 1. The degree to which each item measured one of the two dimensions was determined by αi (Equation 5). The items were divided into three sets where (1) items discriminated more on the first dimension, αi < 30, (2), items discriminated on the two dimensions somewhat equally, 30 ≤ αi ≤ 60, or (3) items discriminated more on the second dimension, α i > 60. On the first form, 20 items were in Set 1, 11 items were in Set 2, and 9 items were in Set 3. Based on the specifications of the original ACT Form 24B, items discriminating considerably more on the first dimension (Set 1) were the easiest, as measured by the multidimensional difficulty d (M = 0.15, SD = 0.57); items discriminating on the two dimensions somewhat equally (Set 2) were moderately hard (M = −0.43, SD = 0.53); items discriminating more on the second dimension (Set 3) were very difficult (M = −1.28, SD = 0.39).
Item Specifications of the ACT Mathematics Usage Test, Form 24B.
Five additional forms were constructed by altering the difficulty and/or discrimination values within sets of items. An important feature is that the original form and the additional five forms had an equal number of items and average item difficulty overall, and that the forms only varied in the number of items and/or average difficulty within the sets of items primarily measuring one of the two dimensions.
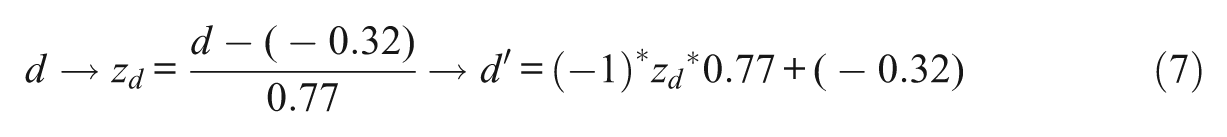
To maintain an equal total test difficulty and alter the difficulty within subsets of items on some forms, the difficulty values of the original form were first standardized. Then the values were placed at a similar location on the opposite end of the distribution (Equation 7). In this manner, items within Set 1 (which were easier) became more difficult, and items within Set 3 (which were difficult) became easier; still, the overall distribution of item difficulties remained the same.
The odd numbered forms (1, 3, and 5) had the original specifications of item difficulty. The even numbered forms (2, 4, and 6) had the transformed difficulty values.
The number of items within sets was also manipulated by switching the a
1 and a
2 values of selected items. Forms 1 and 2 had 20 items in Set 1 and nine items in Set 3. The discrimination values of two randomly selected items in Set 3 (Items 20 and 21) were interchanged on Forms 3 and 4 so that these items were a part of Set 1; as a result, Forms 3 and 4 had 18 and 11 items in Sets 1 and 3, respectively. Forms 5 and 6 had the same two plus three additional randomly selected items from Set 3 switched (Items 11, 19, 20, 21, and 28). Forms 5 and 6 had an almost equal number of items measuring each dimension, with the number of items being 15 and 14 in Sets 1 and 3, respectively. The number of items in Set 2 did not change across forms. All forms maintained an equal average item discrimination (
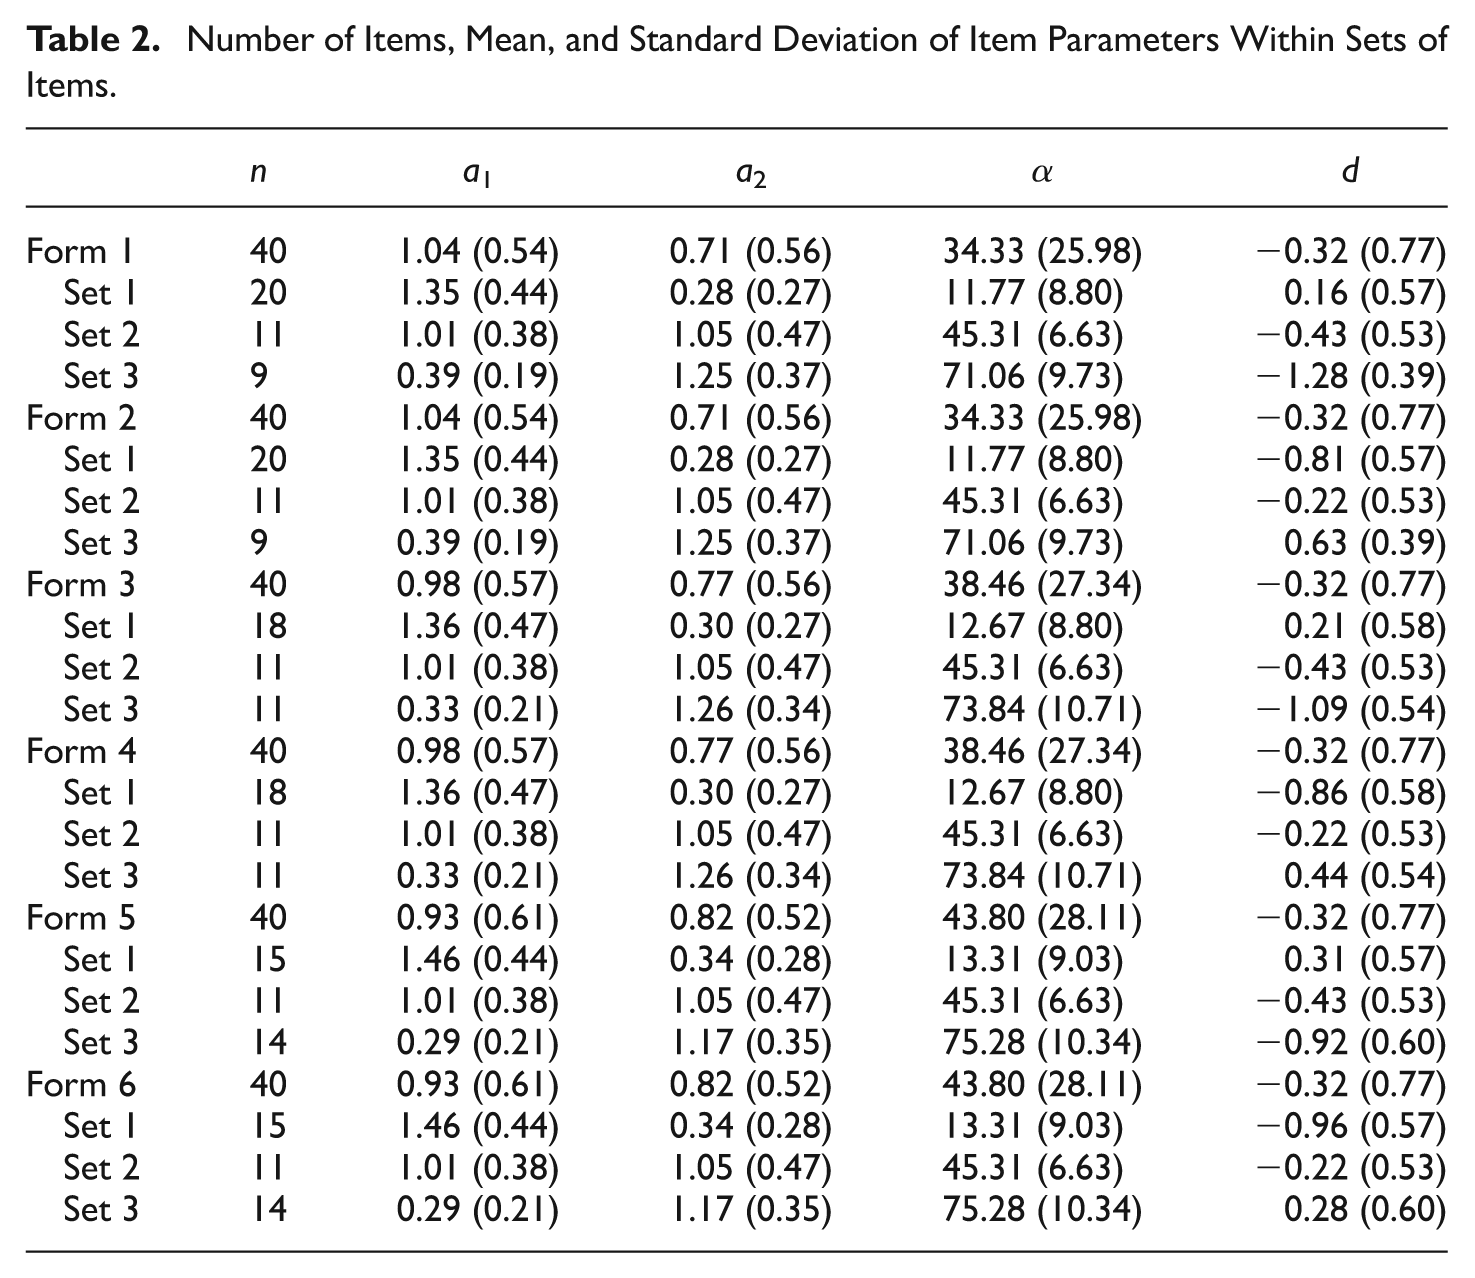
The summary statistics of items for the test forms as a whole and within each set of items are provided in Table 2. All six test forms as a whole had similar average discriminations, equal average item difficulty, and the same number of items. Within sets of items, the number of items, average discrimination, and average difficulty were adjusted. On Forms 1, 3, and 5, the first set of items primarily measuring the first dimension was easier, while the third set of items primarily measuring the second dimension was harder. On Forms 2, 4, and 6, the first set of items primarily measuring the first dimension was hard, and the third set of items primarily measuring the second dimension was easy. Forms 1 and 2 had a very unbalanced number of items measuring each dimension, Forms 3 and 4 were slightly unbalanced, and Forms 5 and 6 had an almost equal number of items primarily measuring each dimension.
Number of Items, Mean, and Standard Deviation of Item Parameters Within Sets of Items.
Analysis
Parameters were estimated using the Rasch model and the 2PL model (Rizopoulos, 2010) using the “ltm” package in R (Rizopoulos, 2006). Each set of item response data (six forms across four set of examinees for a total of 24 data sets) was replicated 500 times and analyzed. For each data set, the estimated item parameters were averaged across the replications for forms as a whole and within the first, second, and third sets of items. The confounding effects of the number of items and item difficulty within dimensions were evaluated by comparing the true measures of discrimination and difficulty with the estimated unidimensional values, measured by the average bias.
According to Reckase et al. (1988), data that measure multiple dimensions may be considered unidimensional under special criteria. Prior to estimating item parameters using a unidimensional model, each data set was evaluated using the Q 3 statistic. Small negative values of Q 3 with small standard deviations indicate that the assumption of unidimensionality does hold; positive values or those with large standard deviations signify a violation. The values of the Q 3 statistic for all simulated data sets were approximately −0.025, with a standard deviation between 0.035 and 0.080. This confirmed that though forms were simulated using a two-dimensional model, the data could be analyzed using a unidimensional model, as is the case with many educational data sets (Kastberg et al., 2014; OSDE, 2013; TEA, 2015b; U. S. Department of Education, 2001).
Results
Discrimination
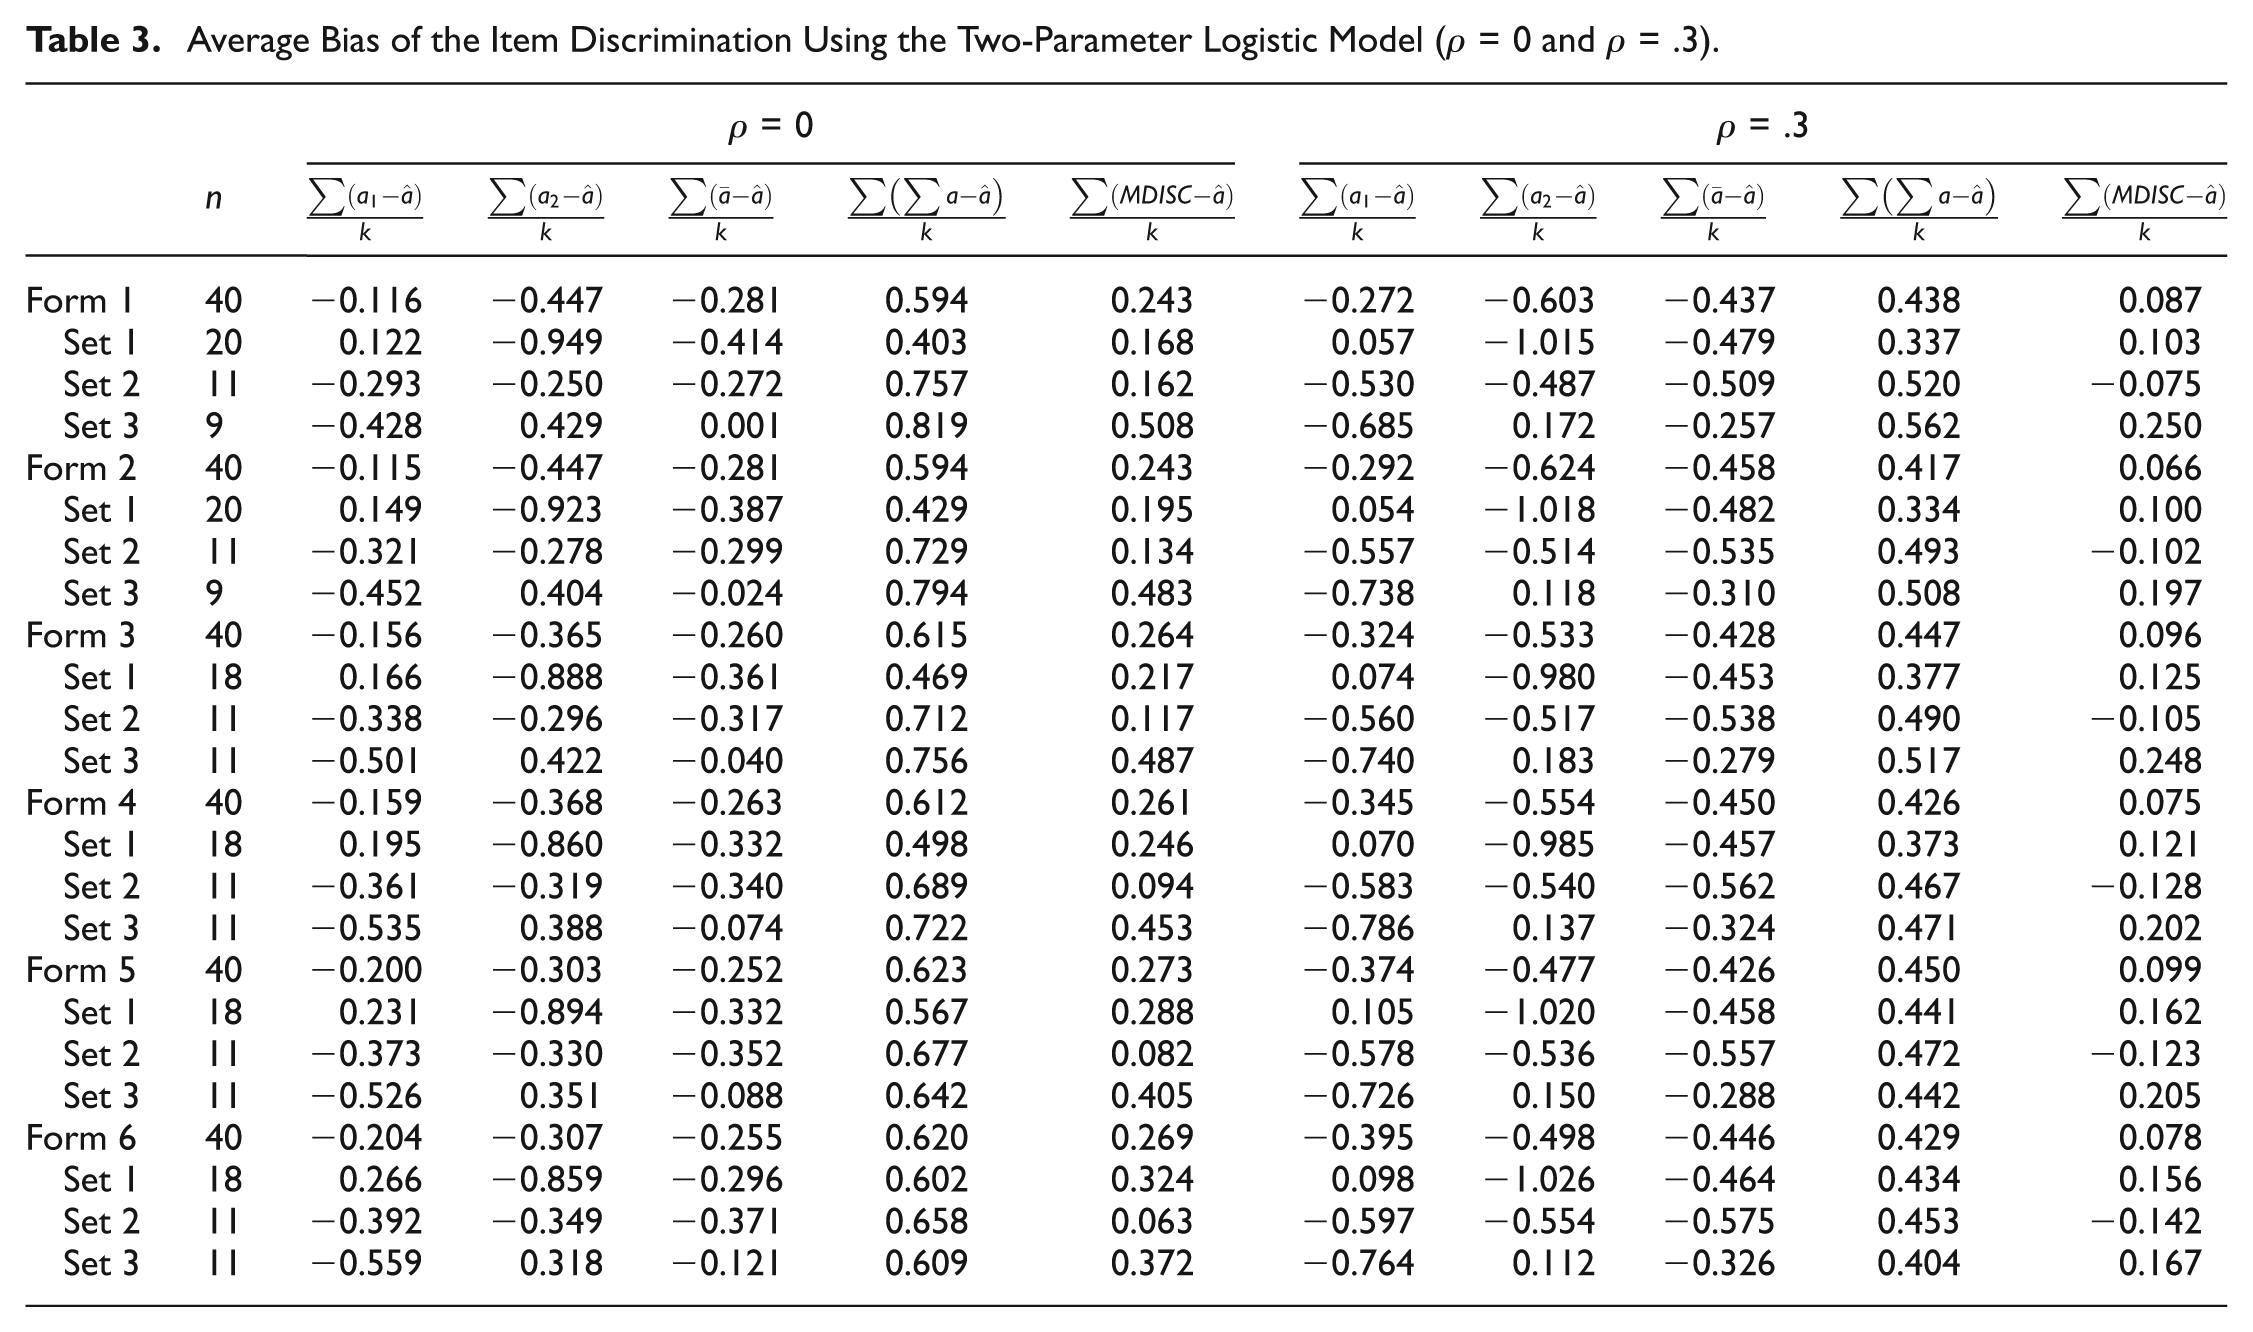
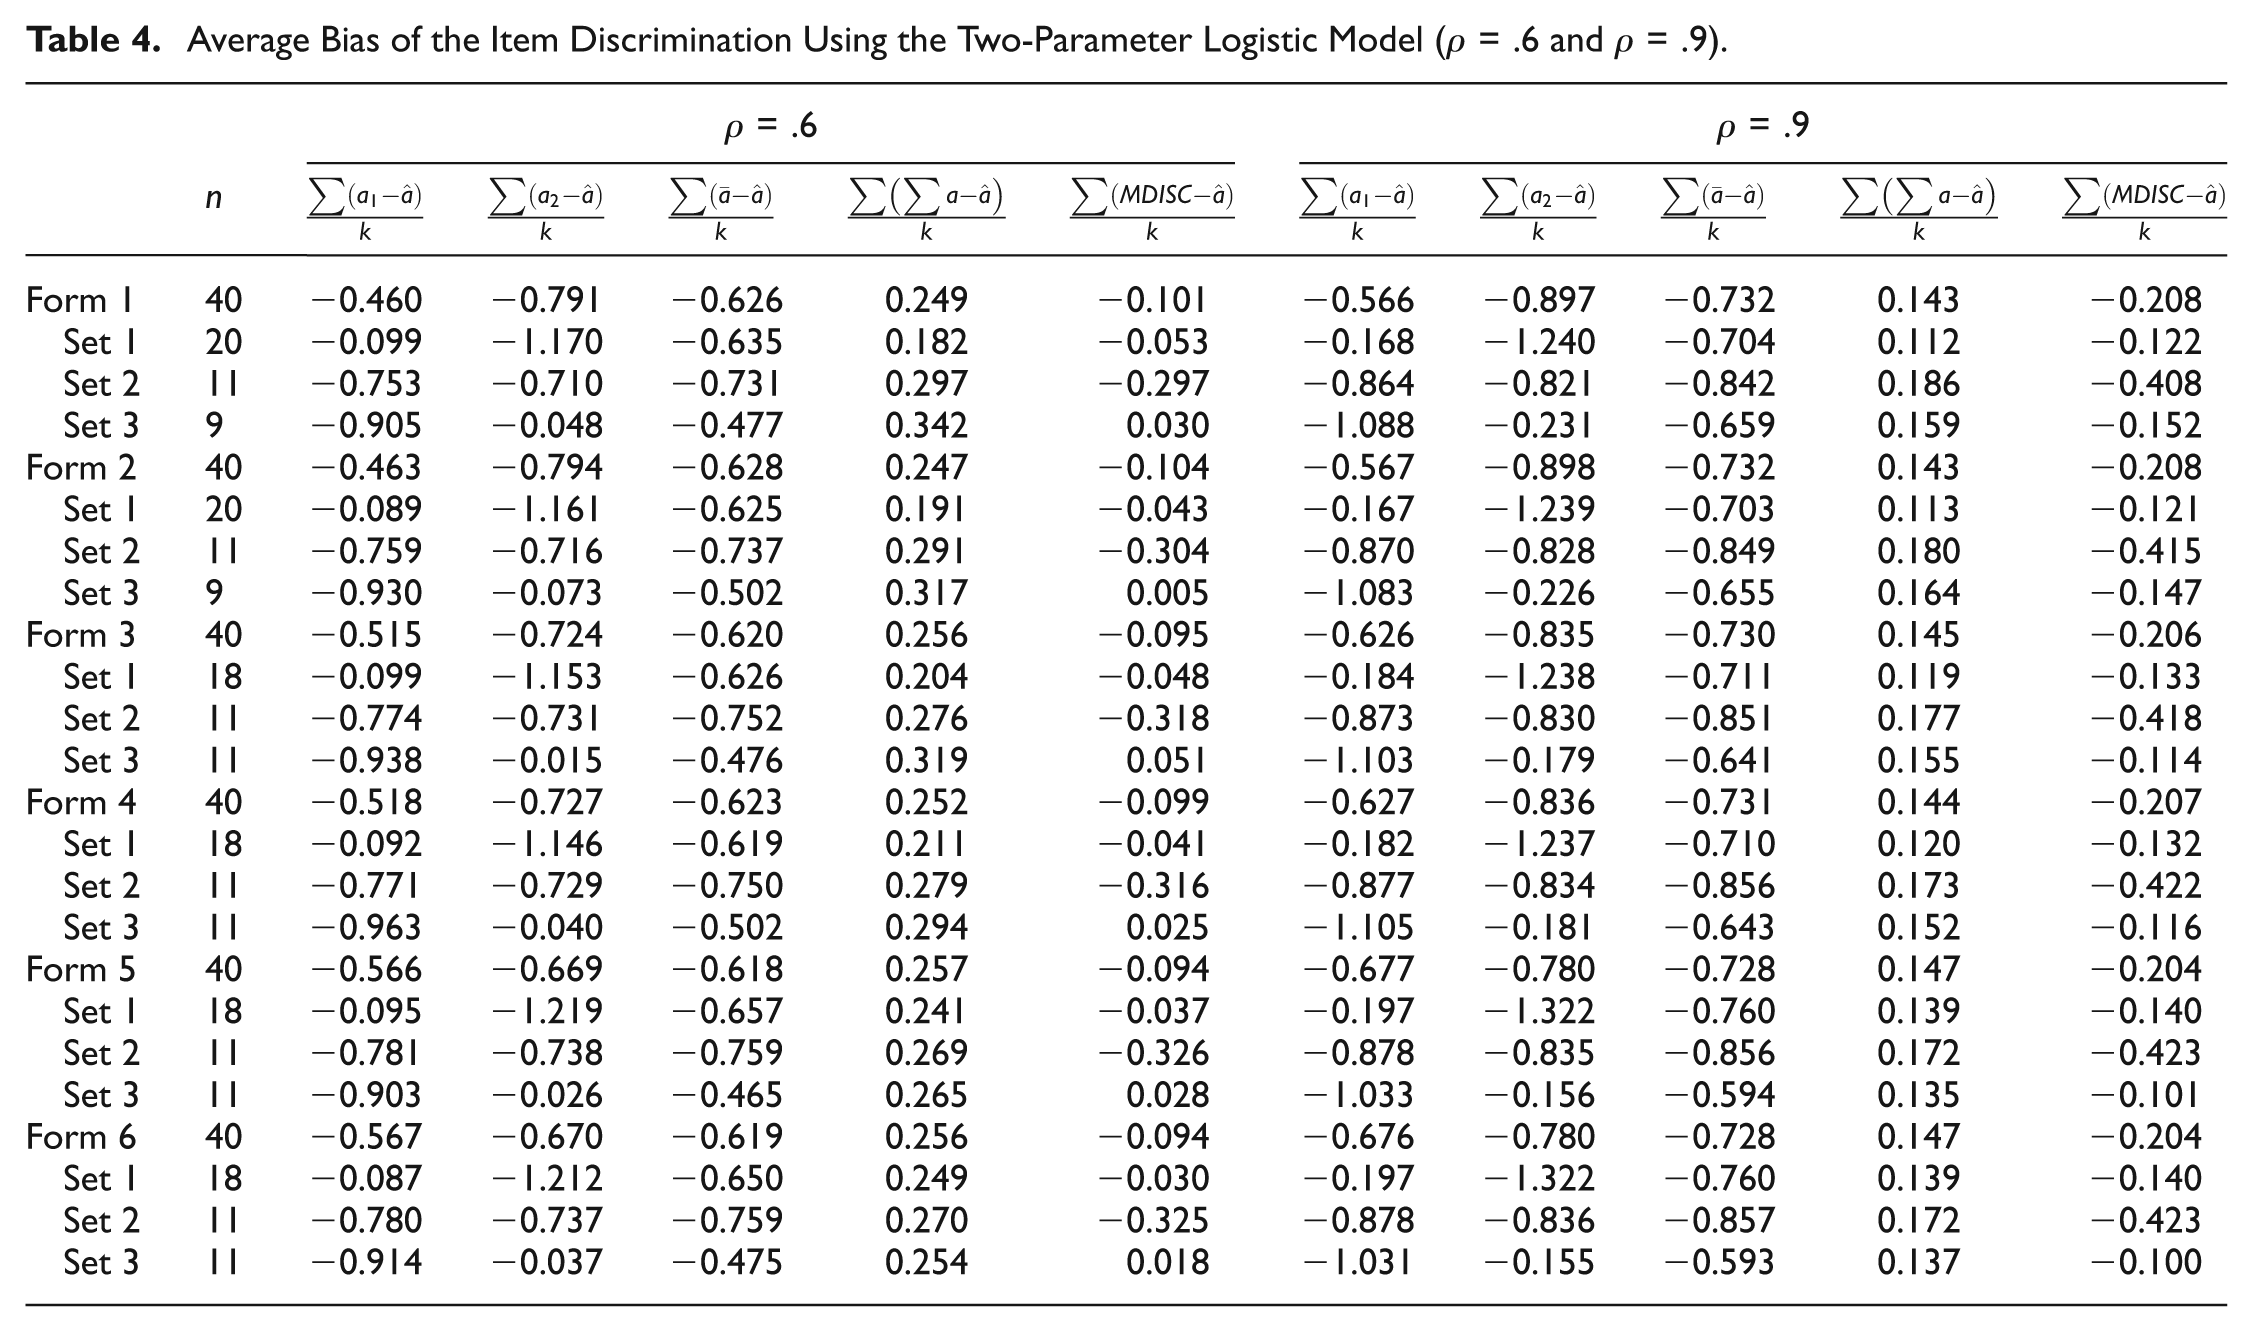
The estimated item discriminations when analyzed with the 2PL model are discussed here. Those from the Rasch model are not discussed, since the parameter was fixed to the value of one for all items. Tables 3 and 4 report the average bias of the 2PL unidimensional estimated discrimination from the true a 1, true a 2, average of true values, sum of true values, and MDISC within sets of items and across all forms; Table 3 contains the measures of bias for the uncorrelated data set and the data set with low correlation between dimensions (ρ = .3), and Table 4 reports measures of bias for data sets of higher correlation (ρ = .6 and ρ = .9). Figure 1 displays the trends of the estimated bias across forms.
Average Bias of the Item Discrimination Using the Two-Parameter Logistic Model (ρ = 0 and ρ = .3).
Average Bias of the Item Discrimination Using the Two-Parameter Logistic Model (ρ = .6 and ρ = .9).
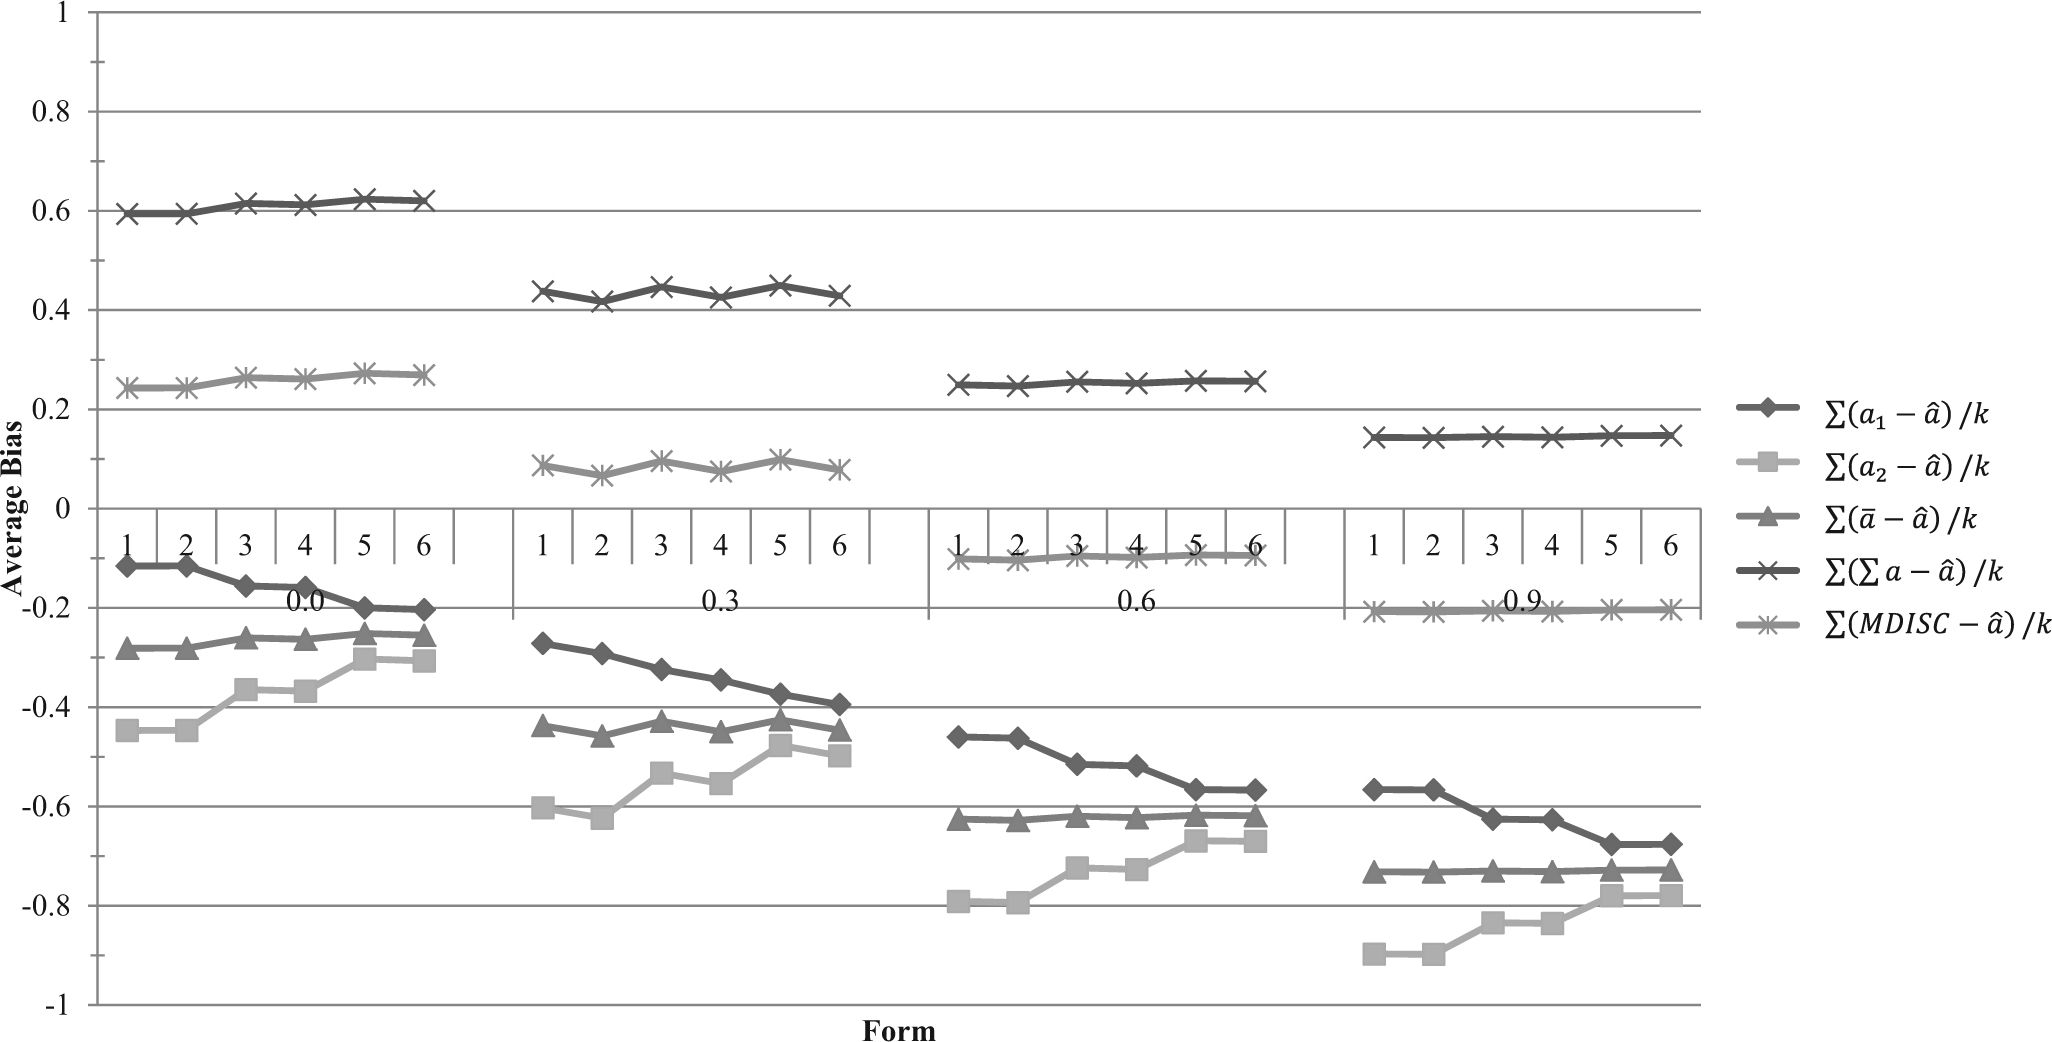
Line graph of the average bias between true and estimated measures of discrimination across six forms at four levels of correlation. A value greater than zero indicates that the true value was underestimated; a value less than zero indicates that the true value was overestimated.
For forms as a whole, the average estimated discrimination was larger than the true a
1, a
2, and
The estimated discrimination of items within Set 1 (primarily measuring the first dimension) was less bias of and a small underestimate of a
1 and a large overestimate of a
2. The measures of bias of items within Set 2 (measuring each dimension somewhat equally) was a closer estimate of MDISC when ρ ≤ .3, a close estimate of MDISC and a
1 + a
2 when ρ = .6, and a closer estimate of a
1 + a
2 when ρ = .9; the measures of bias of items within Set 2 were almost equal between
Across forms at the same level of correlation, as forms became more balanced, the measure of bias between
Difficulty
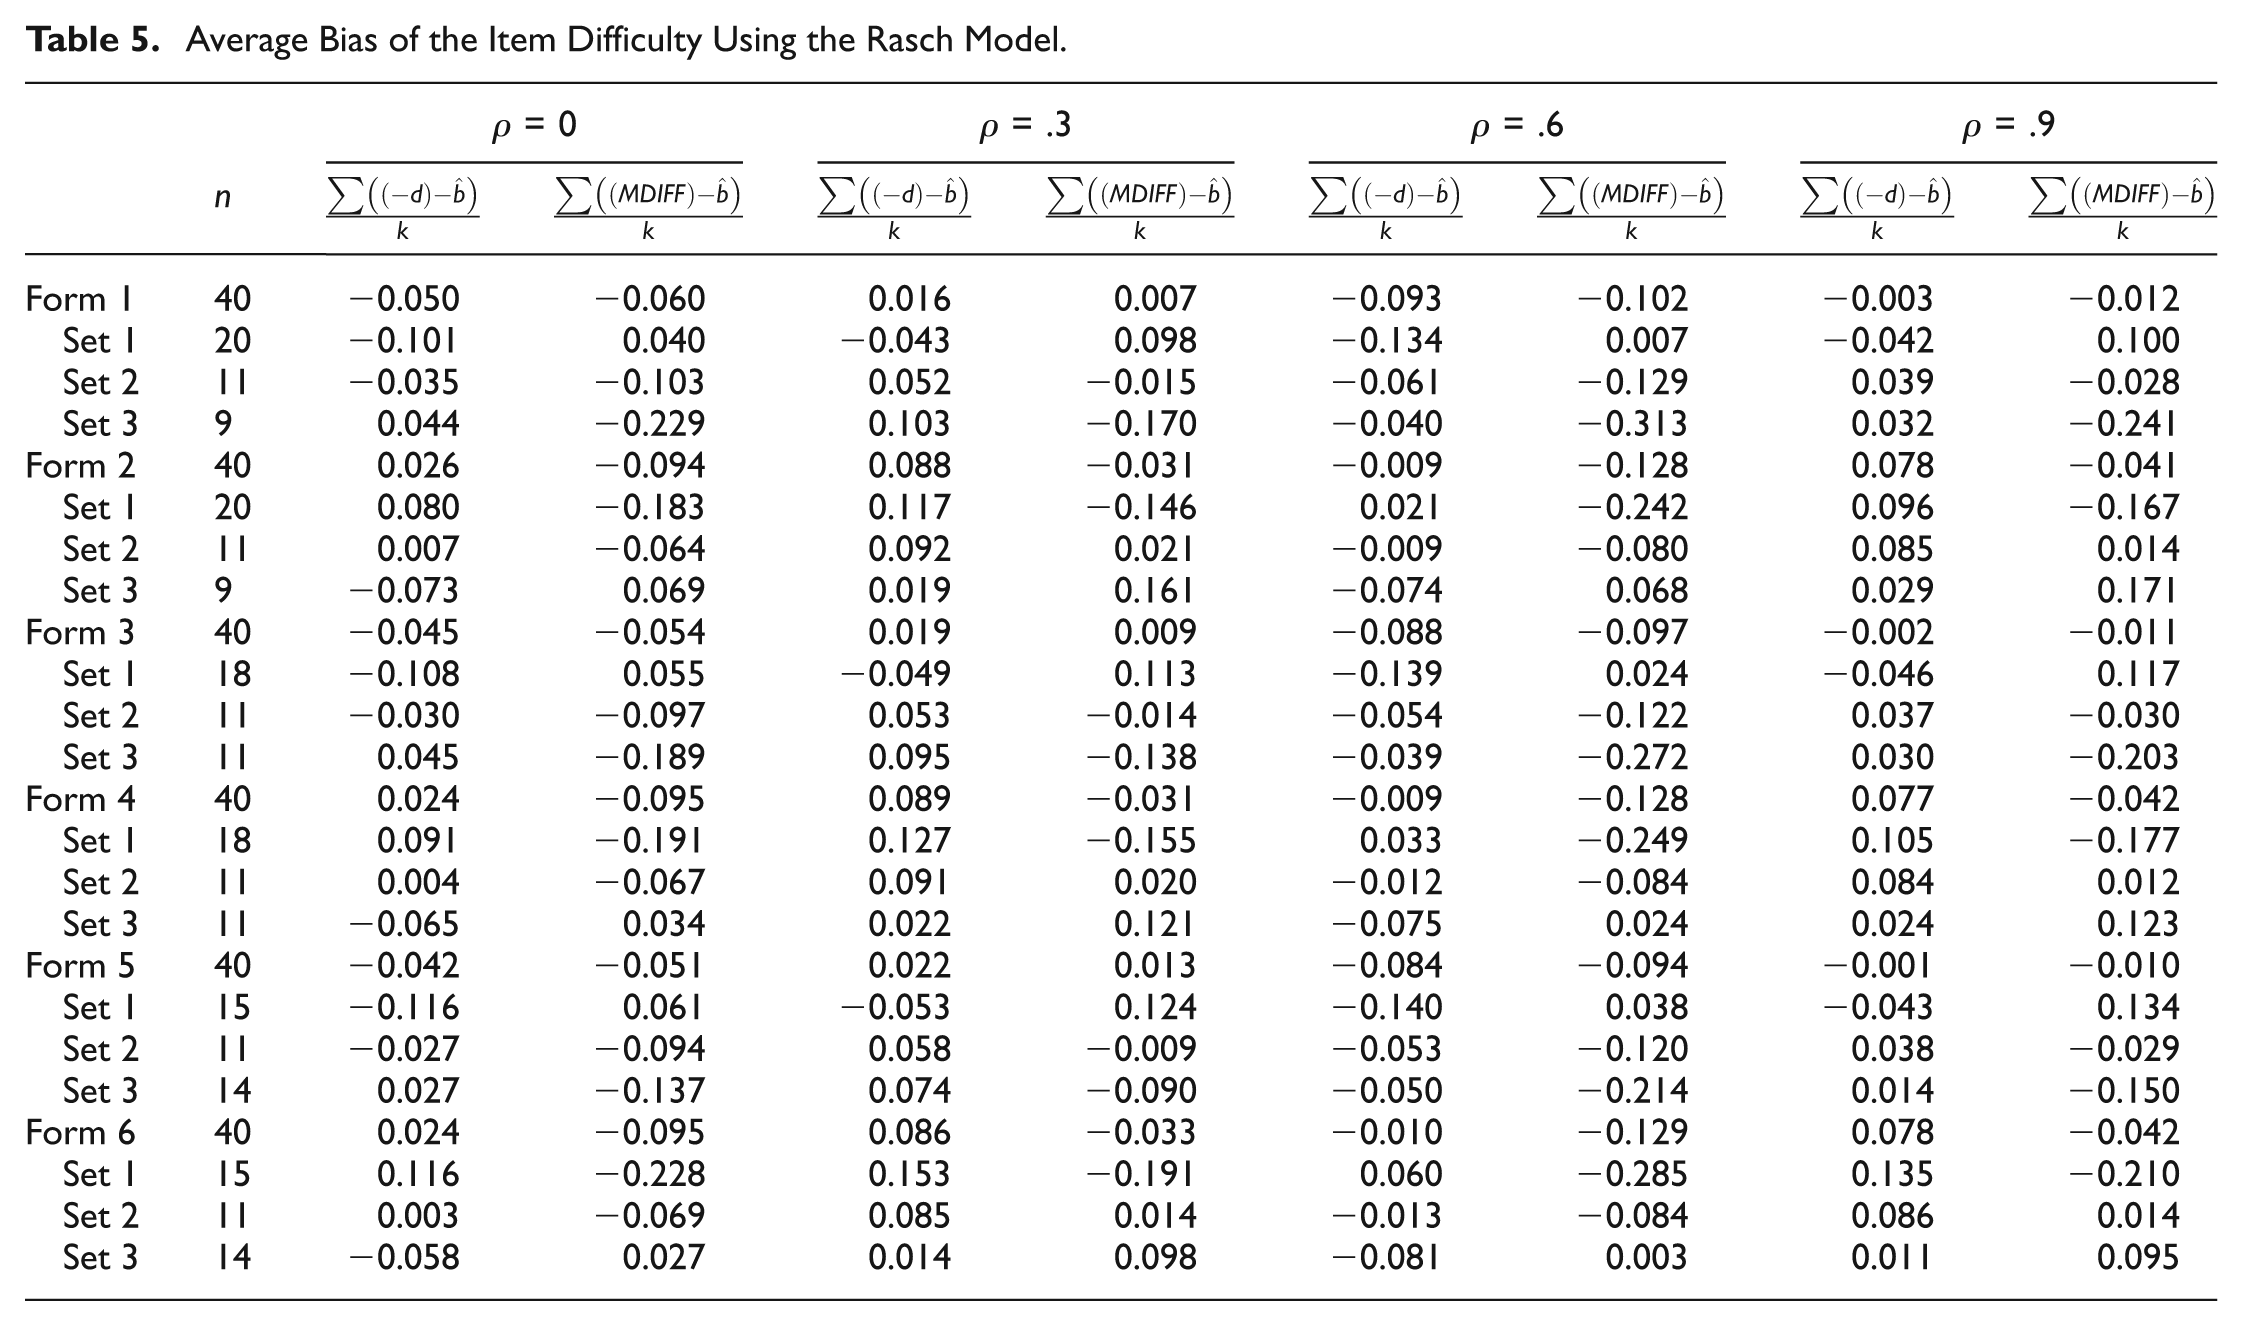
Overall the 24 data sets had the same true average difficulty (d). Due to the opposing interpretations of the multidimensional d difficulty and the unidimensional b difficulty, where d > 0 indicates an easier item and d < 0 indicates a harder item, and where b > 0 indicates a harder item and b < 0 indicates an easier item, the average bias compared the estimated
Average Bias of the Item Difficulty Using the Rasch Model.
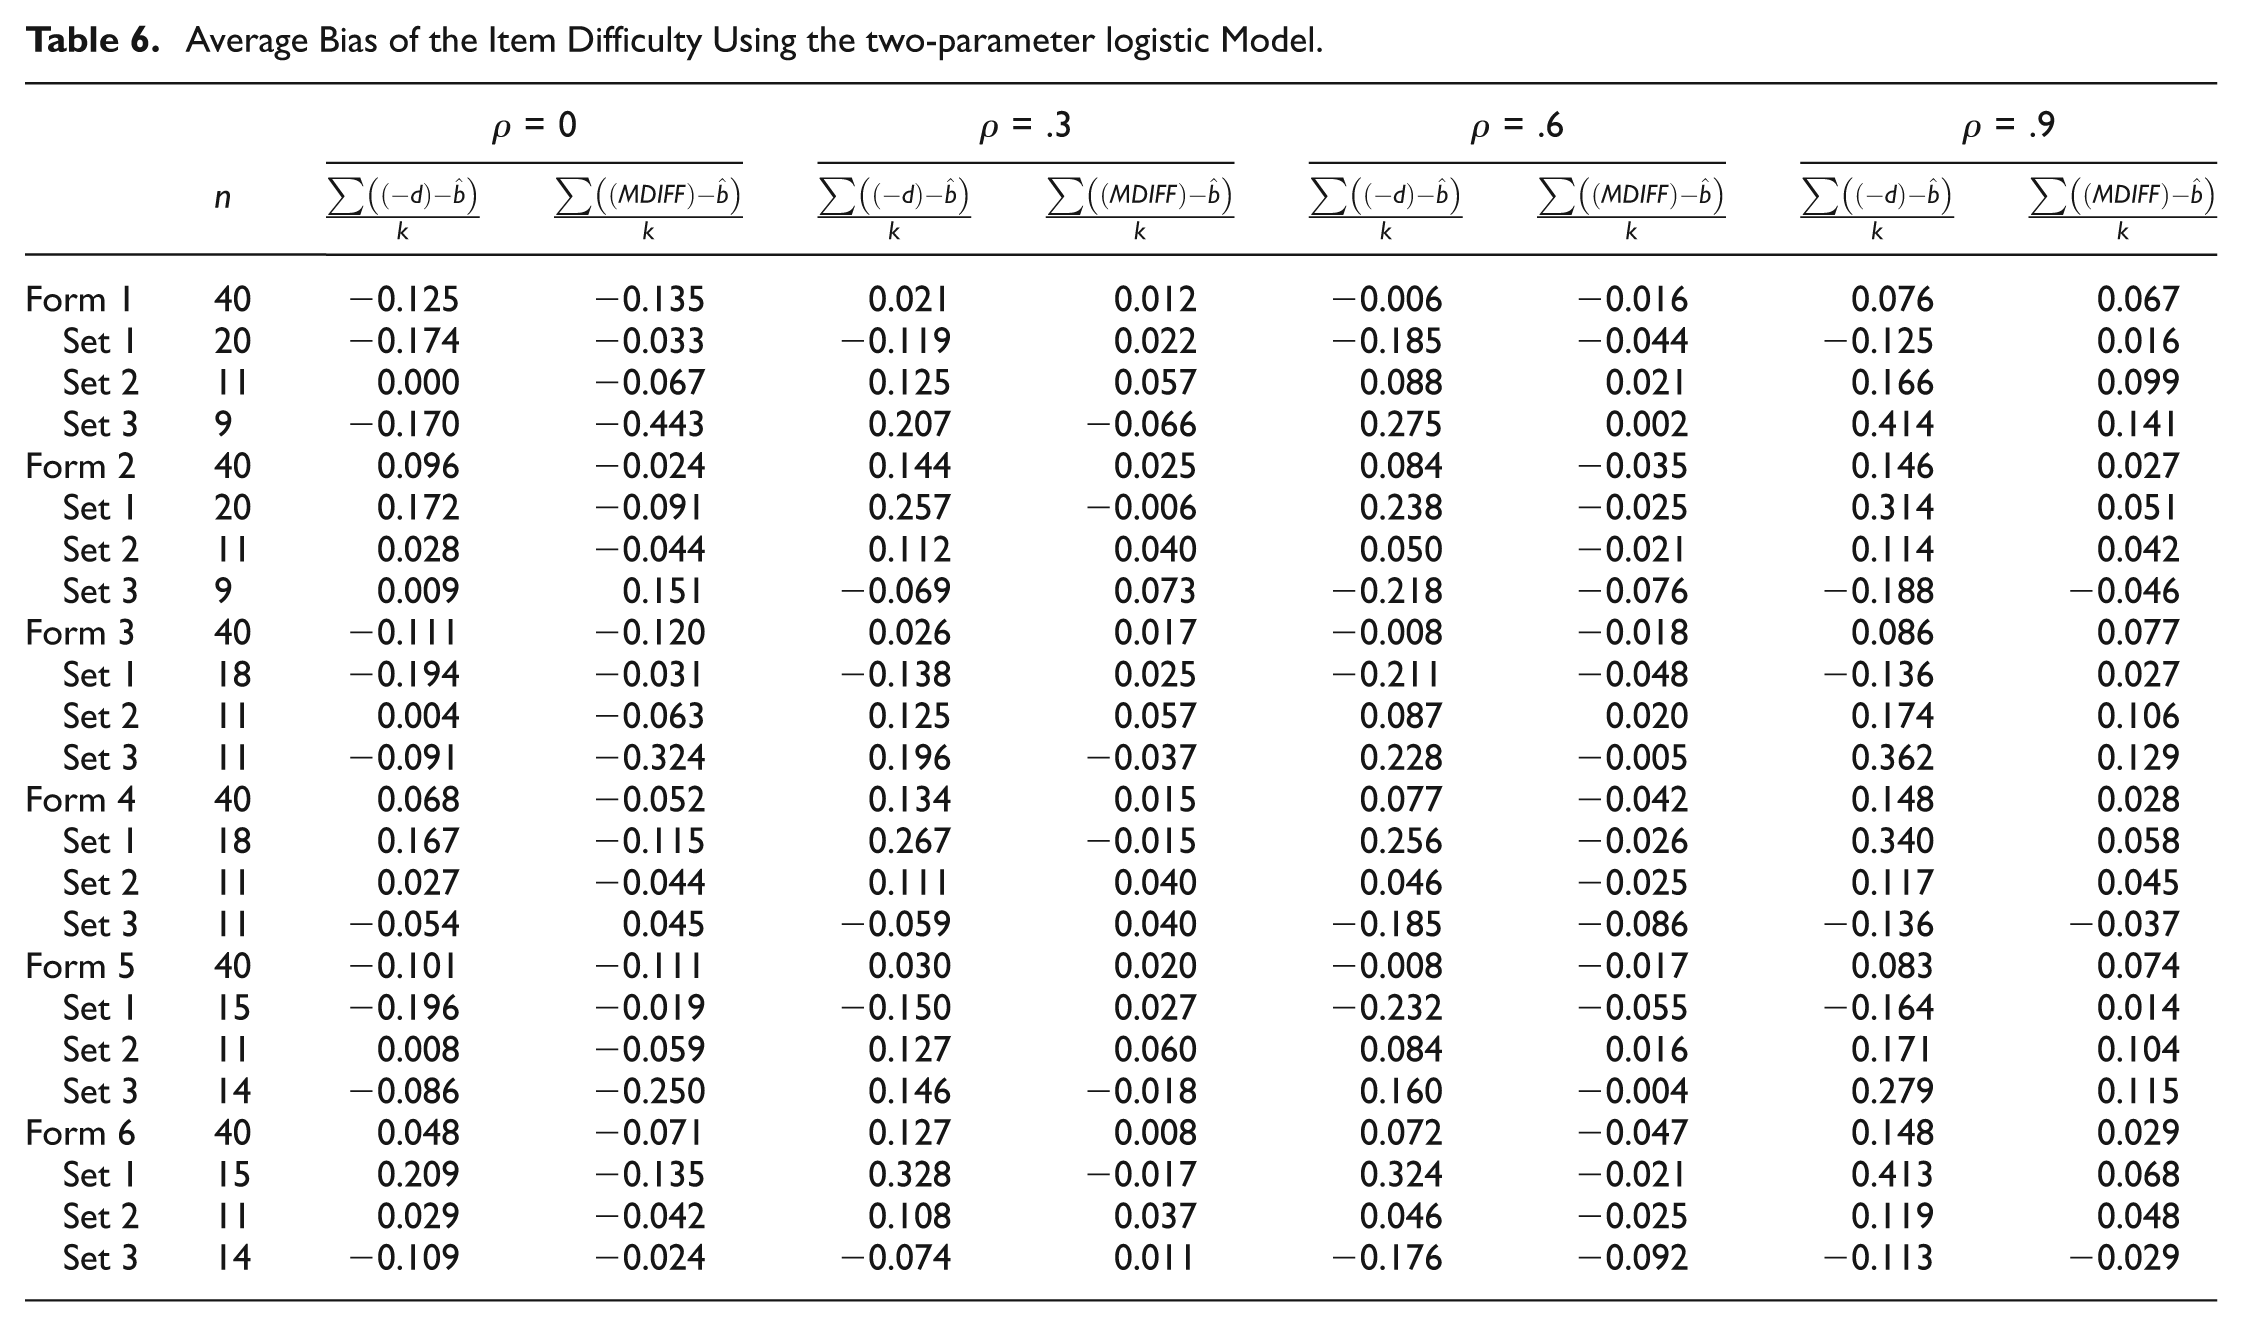
Average Bias of the Item Difficulty Using the two-parameter logistic Model.
Line graph of the average bias between true and estimated measures of difficulty across six forms at four levels of correlation.
Rasch Model Results
Changes in the item difficulty within subsets of items primarily measuring one of two dimensions, even when the overall average difficulty across forms was equal, resulted in test forms with different estimated total test difficulty. Across forms with similar levels of correlation, the range of estimated difficulty was approximately 0.08. Odd-numbered forms, that is, those with a larger set of easy items and smaller set of hard items, were estimated as being more difficult, overall, than even-numbered forms, that is, those with a larger set of hard items and a smaller set of easy items. Forms with a larger set of easy items had an almost equal measure of average bias between
Within sets of items that varied in numbers of items and average item difficulty within subsets, the difficulty of the harder set of items was consistently an underestimate of −d and an overestimate of MDIFF, while the difficulty of the easier set of items was an overestimate of −d and an underestimate of MDIFF. Furthermore, values were overestimated to a larger degree than they were underestimated. This gives light to the differences in the estimated difficulty for forms as a whole. The odd-numbered forms had a larger set of easy items with a difficulty that was an overestimate of −d and a smaller set of hard items with a difficulty that was an underestimate of −d; overall, these were estimated as being more difficult. The even-numbered forms had a larger set of hard items with a difficulty that was an underestimate of −d and a smaller set of easy items with a difficulty that was an overestimate of −d; overall, these were estimated as being less difficult. The bias in difficulty resulting from the larger set of items had a larger impact on the overall estimated difficulty.
As the level of correlation increased, the estimated difficulty of the smaller set of items (Set 3) became more stable across forms as the same level of correlation, and the measures of bias between
Two-Parameter Logistic Model Results
The trends of the estimated difficulty were inconsistent across forms at the four levels of correlation; the ranges of estimated difficulty when the 2PL model was used tended to decrease as correlation increased. Similar to the results when the Rasch model was applied, on forms with a larger set of easy items and smaller set of hard items, the average bias between
The estimated difficulty of the larger set of items tended to follow a similar pattern when estimated with either the Rasch or the 2PL model. The difficulty of these items was an overestimate of −d on the odd forms (when true difficulty of this set was easy) and an underestimate on the even forms (when true difficulty of this set was hard). The smaller set of items did not follow a similar trend when data were uncorrelated; in this case,
Comparison of the Rasch and 2PL Estimates of Difficulty
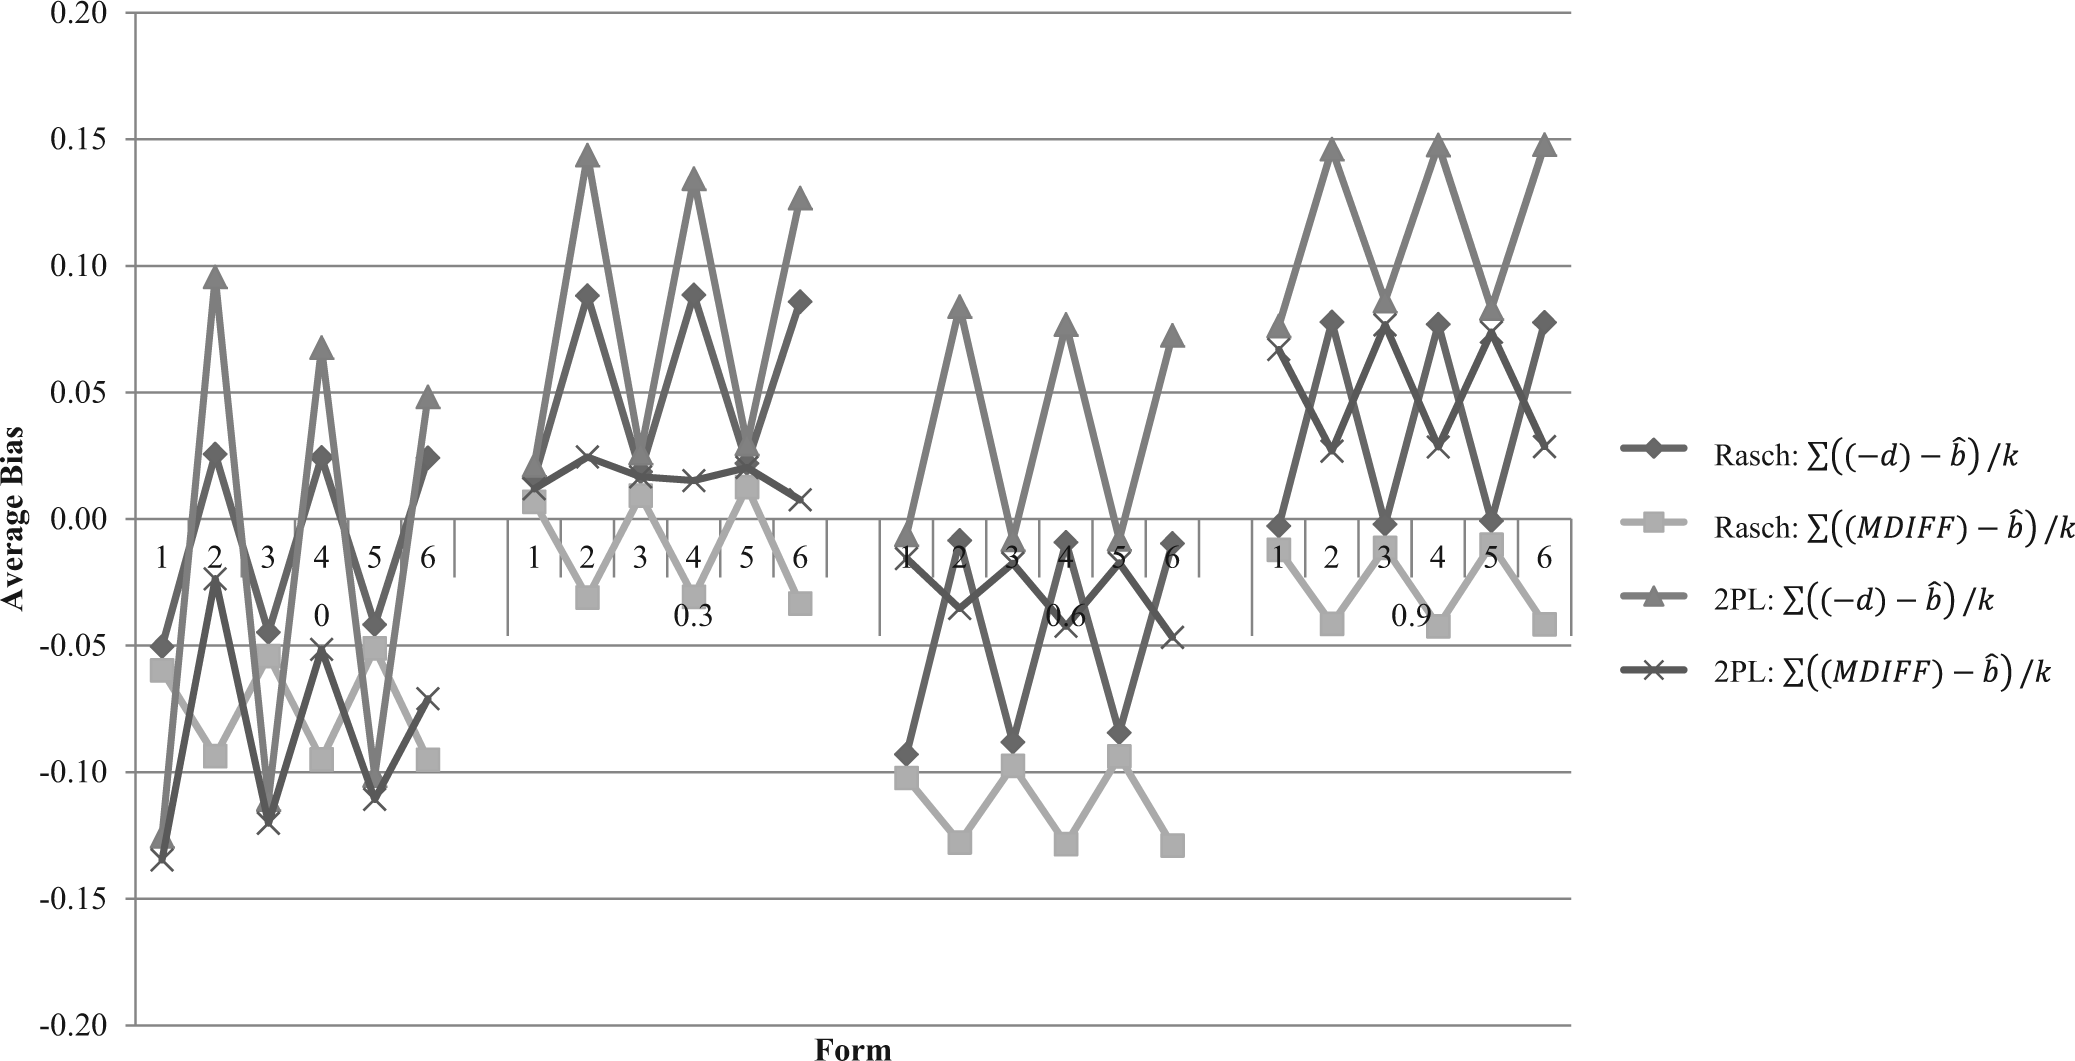
Figure 3 displays the true difficulty (−d), MDIFF, and the estimated difficulty from the Rasch and 2PL models. The true difficulty across all forms remained constant, while MDIFF took into account the changes of item discriminations. The estimated total test difficulty was affected by the changes in difficulty within subsets of items, the degree of correlation between dimensions, and the model applied. When either model was applied, forms with a larger number of easy items were estimated as being more difficult than forms with a larger number of hard items, even when overall test difficult was equal. This trend followed the overall pattern of MDIFF.
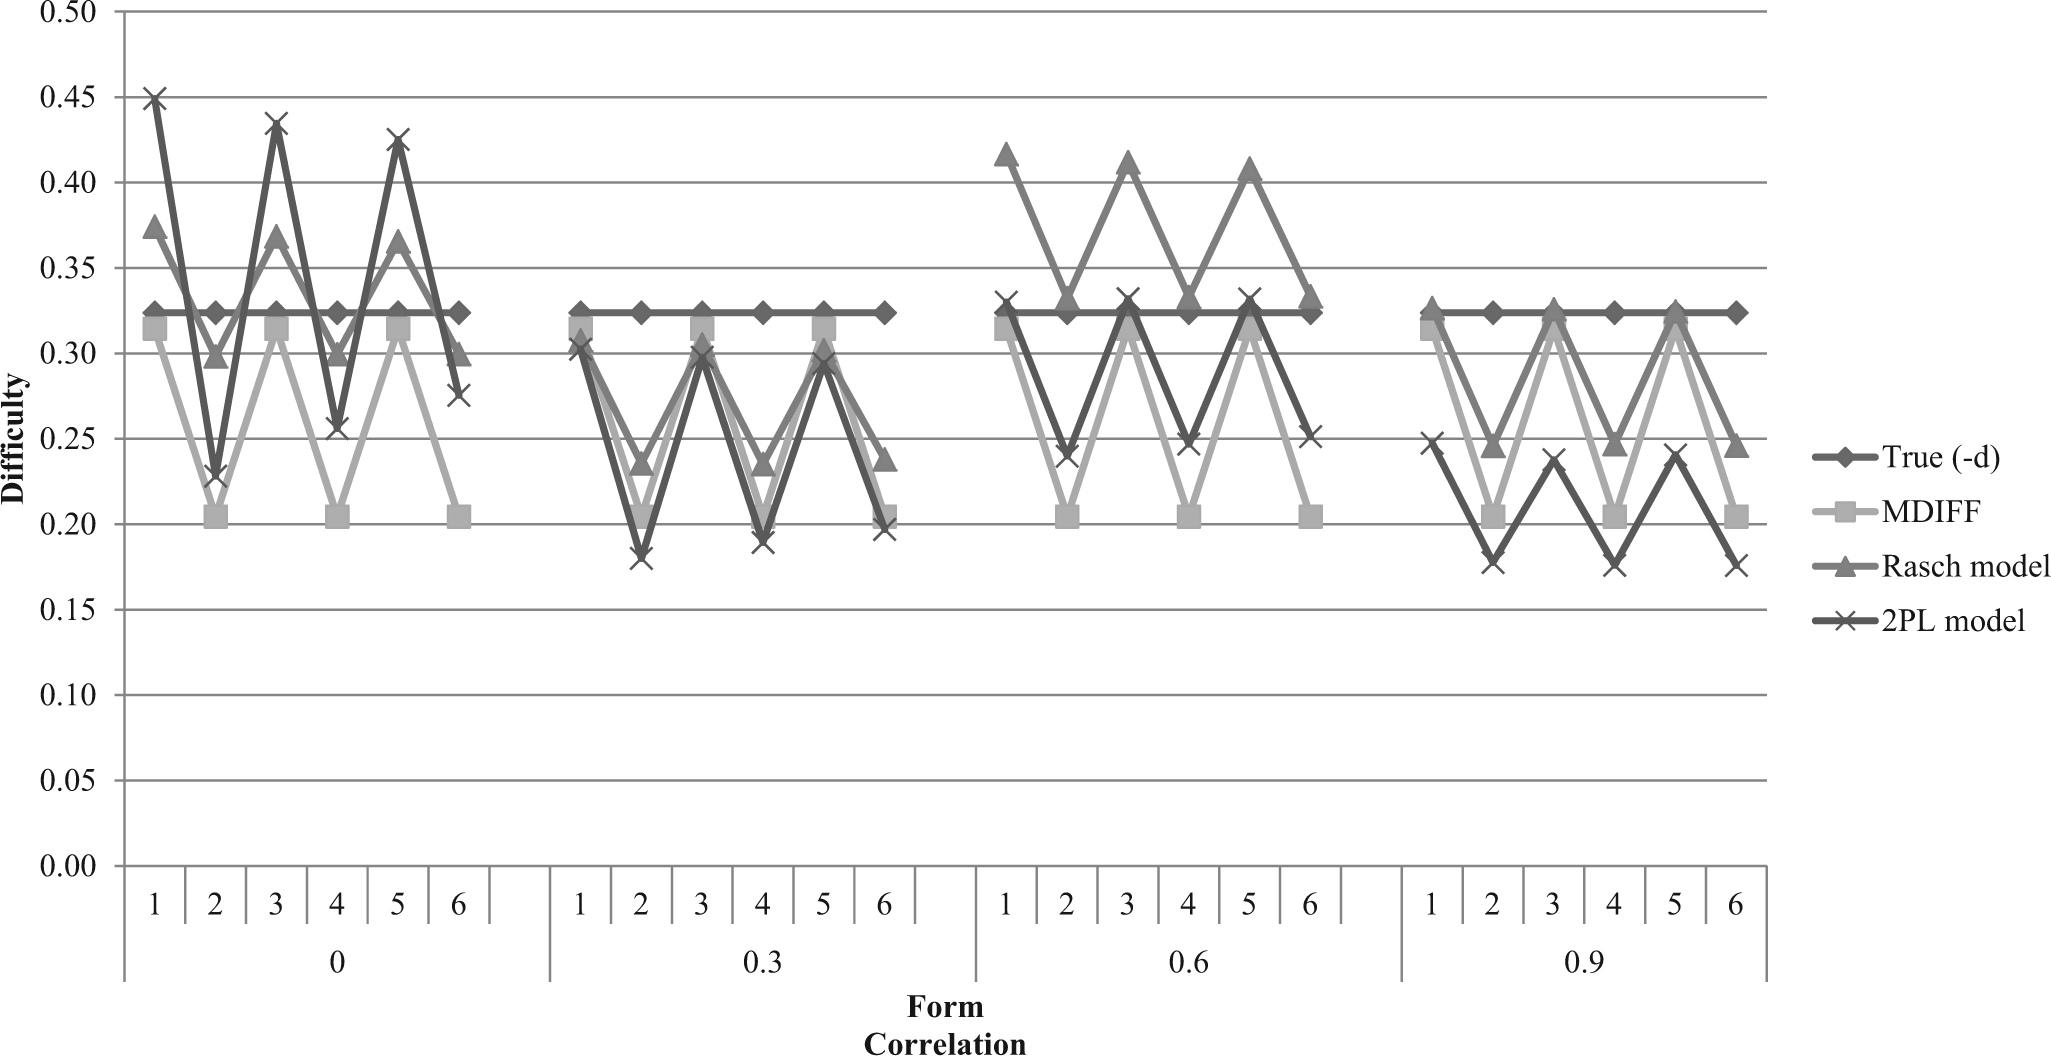
Line graph of the true difficulty (−d and MDIFF) and the estimated difficulty when the Rasch and two-parameter logistic models were used across all forms and at all levels of correlation.
The changes in the difficulty of subsets of items had a strong effect on the 2PL estimates when ρ = 0, yet the effect weakened as correlation increased. When the Rasch model was applied, the effects of the differences in subset difficulty remained constant at all levels of correlation. Across forms at the same level of correlation, the estimated difficulty from the Rasch model was most often a better estimate of the true difficulty (−d).
In conclusion, the estimated difficulty of the Rasch model tended to be closer to the true difficulty (−d) more often than the estimated difficulty from the 2PL model. However, the estimated difficulty from the 2PL model tended to follow the pattern of MDIFF more closely than did the estimated difficulty of the Rasch model.
Discussion
This study investigated one of many issues when applying a unidimensional IRT model to data that is composed of multiple dimensions-the effects of confounding item specifications within dimensions across multiple test forms that have equivalent specifications overall. The specifications of Form 24B of the ACT Mathematics Usage Test (Reckase & McKinley, 1991) were used as Form 1; five additional forms were constructed with a slightly altered number of items and/or average item difficulty within sets of items primarily measuring one of the two dimensions. As a result, the average unidimensional estimated discrimination was affected more by the correlation between dimensions, but not the confounding within dimensions. The average unidimensional estimated difficulty was affected by the confounding of specifications within dimensions, the correlation, and the model applied (Rasch or 2PL IRT models).
The estimated discrimination and difficulty of items are used by testing companies for various purposes. When constructing forms, items are evaluated and selected based on the estimated parameters. After administration, forms are equated based on the average estimated difficulty of all items across forms. Results of this study demonstrate that the average estimated difficulty of items is likely to vary across forms as a whole and within sets of items primarily measuring a single dimension when forms differ in the number of items and/or item difficulty within subsets, even when the true difficulty is equal across forms. Forms having a larger set of easy items measuring one dimension and a smaller set of hard items measuring a second dimension are likely to be estimated with a higher average difficulty overall than forms having a larger set of hard items measuring one dimension and a small set of easy items measuring another dimension. The unidimensional difficulty tends to be a close estimate of MDIFF when the 2PL model is used, and the estimate becomes more stable as the correlation increases. However, the estimate tends to be closer to −d more often across forms when the Rasch model is used, yet the stability of the estimate was similar at all levels of correlation.
The estimated average item discrimination across forms (at the same level of correlation) tends to be consistent regardless of changes in difficulty and/or numbers of items within sets. When data are uncorrelated, the estimated discrimination may be a closer approximation to the average of true values, as reported by Ansley and Forsyth (1985), Reckase et al. (1988), and Song (2010), or to the discrimination of the larger set of items. As correlation increases (ρ = .3 and
The use of simulations is valuable to study this situation. Bolt (1999) argued for the advantages of using simulations to study data with known multidimensional structures. It allows for comparisons of estimated item parameters with the true values, which are never known in practice. Forms that really do have equal true difficulty values may be estimated as having differing difficulties due to inconsistencies of properties within subsets of items. In practice, if the multiple forms were estimated with different average item difficulty, then they would most likely be equated. However, in this case forms should not be equated because they were known to have equal average item difficulties. The results call attention to the need for strict test specifications within subcontents. Additionally, the correlation between dimensions should be well determined.
Significance and Future Study
In situations where multiple test forms are administered, test developers may want to more closely investigate the item specifications within subcontent areas, in order to construct test forms that yield consistent item parameter estimates. The results of this study may be used to guide test developers to design forms with more consistent item difficulty within subsets of items. It is also advised to evaluate the correlation between the multiple dimensions. Once the correlation has been established, the unidimensional estimate from a Rasch model as compared with a 2PL model may represent the true parameters somewhat differently. If data are highly correlated, it may be desired to use a 2PL model over a Rasch model due to the stability of the estimated total test difficulty. The inclusion of the 3PL model is of interest in future studies.
Future research should focus on the study of effects on estimated ability, processes of equating, and implications in the computerized-adaptive testing setting. In some contexts, latent ability estimates are conditional on the estimated item discrimination and difficulty. Biased item parameters are likely to lead to biased ability estimates. An extension of this study is to investigate the effects on estimated ability.
After the administration of tests, procedures of equating are used to align the estimated average item difficulty across forms. This is often applied to forms as a whole, but not within subcontent areas. Future studies should examine the effects of confounding difficulty within dimensions on equating for tests as a whole and within subcontent areas. Furthermore, this study may have implications in an adaptive setting when various methods of item selection, content balance, and termination are implemented using IRT techniques.
Footnotes
Declaration of Conflicting Interests
The author(s) declared no potential conflicts of interest with respect to the research, authorship, and/or publication of this article.
Funding
The author(s) received no financial support for the research, authorship, and/or publication of this article.