
Abstract
Reliable measurements are key to social science research. Multiple measures of reliability of the total score have been developed, including coefficient alpha, coefficient omega, the greatest lower bound reliability, and others. Among these, the coefficient alpha has been most widely used, and it is reported in nearly every study involving the measure of a construct through multiple items in social and behavioral research. However, it is known that coefficient alpha underestimates the true reliability unless the items are tau-equivalent, and coefficient omega is deemed as a practical alternative to coefficient alpha in estimating measurement reliability of the total score. However, many researchers noticed that the difference between alpha and omega is minor in applications. Since the observed differences in alpha and omega can be due to sampling errors, the purpose of the present study, therefore, is to propose a method to evaluate the difference of coefficient alpha (
Introduction
In social and behavioral sciences, most interesting attributes such as happiness, anxiety, and cognitive and social competence cannot be observed directly and have to be measured by multiple indicators that are subject to errors. Reliable measurements are key to social science research. When measurements are used quantitatively, we would like the observed differences between individuals to be due to the differences in true scores rather than due to measurement errors. The concept reliability was invented to quantify the quality of measurements for such a purpose (see, e.g., Allen & Yen, 1979; Raykov & Marcoulides, 2011). In particular, reliability of the observed score is defined as the ratio of the variance of the true score over the variance of the observed score. It is known that reliability depends on the formulation of items (how questions are phrased in questionnaires) as well as the targeted population (the composition of the participants; see, e.g., Thompson, 2003).
In practice, the total score across items is most widely used for analysis, and the reliability of the total score is of great interest. However, because the part of the true score within the total score is not observable, it is not straightforward to estimate its variance even if we have data with the observed scores. Consequently, multiple measures of reliability of the total score have been developed, including coefficient alpha (also referred to as Cronbach’s alpha; Cronbach, 1951; see also Cortina, 1993; Raykov, 1997; Raykov& Marcoulides, 2011, 2015), coefficient omega (McDonald, 1999), the greatest lower bound reliability (Bentler, 1972; Bentler & Woodword, 1980; Li, Rosenthal, & Rubin, 1996), and others (Allen & Yen, 1979; Hunt & Bentler, 2015; Zinbarg, Revelle, Yovel, & Li, 2005). Among these, the coefficient alpha has been the most widely used measure of reliability, and it is reported in nearly every study involving the measure of a construct through multiple items in social and behavioral research. However, there exists criticism against coefficient alpha (see, e.g., Green, Lissitz, & Mulaik, 1977; Raykov, 1997; Sijtsma, 2009; Yang & Green, 2011). This is because, when the items are unidimensional (measuring the same latent trait), the sample coefficient alpha yields consistent estimate of reliability only when all the items have equal covariance with the true score, called tau-equivalence. But this assumption is seldom met in practice with educational and psychological scales (see, e.g., Green & Yang, 2009; Jőreskog, 1971; Lord & Novick, 1968). A measure that overcomes the deficiencies of alpha is coefficient omega, which is based on a one-factor model. In particular, when the covariance among the items can be approximately accounted for by a one-factor model, the formulation of coefficient omega closely matches the definition of reliability (McDonald, 1999). Also, almost all free and commercial statistical software outputs the parameter estimates of a one-factor model that allow the calculation of coefficient omega (e.g., Dunn, Baguley, & Brunsden, 2014; Zhang & Yuan, 2016). In particular, the coefficient omega is deemed as a practical alternative to coefficient alpha in estimating measurement reliability of the total score (Dunn et al., 2014). However, most applied researchers still choose to report only the coefficient alpha.
The reason behind the wide usage of coefficient alpha can be due to multiple reasons. First, Cronbach’s coefficient alpha is well known but poorly understood by many applied researchers. Majority of researchers and users of psychometrical scales might not understand the differences between α and ω very well. A great number of researchers’ understanding of reliability analysis is generally low, and it remains likely that fewer than half of all postgraduate courses in psychology offer in-depth coverage of methods of reliability analysis (Dunn et al., 2014), and thus alpha is widely misapplied in social science research (Cho & Kim, 2015; Green & Yang, 2009). In addition, articles that condemn alpha tend to be very technical, if implementation of an alternative is offered, it is usually presented in a manner too complex for applied researchers to easily implement. Raykov and colleagues made a great deal of effort for a balanced treatment about the criticism and misapplication of alpha (Raykov, 1997, 2012; Raykov & Marcoulides, 2011, 2015). And above all, although the advantages of omega have been illustrated by various authors, the difference between alpha and omega has been reported to be small in applications (e.g., Maydeu-Olivares, Coffman, & Hartmann, 2007; Raykov, 1997). Such an observation made the use of coefficient omega less appealing and indirectly promoted the use of coefficient alpha. However, the observation was primarily based on the direct comparison of the nominal values of the two estimates without making appropriate statistical inference.
Raykov and Marcoulides (2015) provided a direct approach to point and interval estimation of Cronbach’s coefficient alpha using Mplus. They concluded that “alpha and the reliability of a considered scale can be treated as practically identical at large” (p. 152) when the following four conditions hold: (a) items are unidimensional or there is no correlated errors when fitted by the one-factor model; (b) the average loading is above .7; (c) all the differences between the individual factor loadings and the average loading are less than .2; and (d) each item has zero specificity or each uniqueness is solely from measurement errors. When the four conditions in (a) to (d) hold, alpha can also be treated as practically identical to omega, and there is no need for additional development, as presented in the current article. However, in practice, it is very likely that the four conditions may not hold simultaneously. This will be further noted in our analysis of real data sets from well-known psychological scales. In such practical situations, coefficient omega may enjoy some advantage over coefficient alpha (Dunn et al., 2014; Zhang & Yuan, 2016), and then the difference between alpha and omega may become nontrivial. The technique developed in this article allows us to statistically evaluate whether the observed difference (
Evaluating the difference of coefficient alpha and omega statistically will help enhance applied researchers’ awareness of the advantage of omega and facilitate the shift from alpha to omega. Many studies discussed problems with coefficient alpha and pointed out the assumptions underlying coefficient alpha are unlikely to hold in practice, and violation of these assumptions can result in nontrivial negative or positive bias, coefficient omega has been shown to be a more sensible index of internal consistency (Dunn et al., 2014; Green & Yang, 2009; Zhang & Yuan, 2016). However, alpha continues to be widely applied by social science research to assess internal consistency reliability. Actually, Zinbarg et al. (2005) reported that even when the assumptions of essentially tau-equivalent model are met, omega performs at least as well as alpha. But under violations of tau-equivalence conditions likely to be the norm in psychology, omega outperforms alpha and is clearly the preferred choice. To change the practice, it is necessary to develop a rational, scientific, and convincing method to compare the difference of coefficient alpha and omega statistically in applications, and shift applied researchers’ attention from alpha to omega (Dunn et al., 2014).
The purpose of the present study, therefore, is to propose a method to evaluate the difference of the sample coefficient alpha (
The method to be developed allows us to test whether the observed difference (
Methodology
In this section, we will first describe how the SE of (
The Formulations of
,
, and the SE of (
)
Let
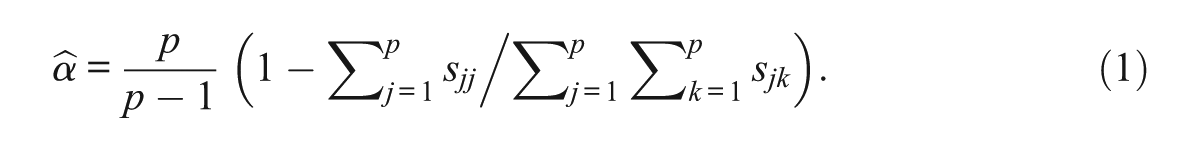
It is a consistent estimate of its population counterpart α when sjk is replaced by σjk. In Equation (1),
The computation of

where
Since both
The complete details leading to the asymptotic distribution of
The Description of the Four Real Data Sets
We now describe the real data sets, and each also contains multiple subscales. Results on (
Data Set 1
This data set was adopted from Holzinger and Swineford (1939), who developed a battery of 26 items, aiming to evaluate 5 cognitive traits of middle school students. The 5 traits are spatial (Items 1 to 4, Items 25 and 26), verbal (Items 5 to 9), speed (Items 10 to 13), memory (Items 14 to 19), and math (Items 20 to 24). Holzinger and Swineford reported two data sets. We will use the one with N = 145 students from the Grant-White school to examine the differences between the reliability coefficient for each of the 5 subscales.
Data Set 2
The data set consists of 44 items of the Big Five Inventory (BFI; John & Srivastava, 1999) with 5 subscales: neuroticism (neuro, 8 items), extraversion (extra, 8 items), conscientiousness (cons, 9 items), openness (open, 10 items), and agreeableness (agree, 9 items). Data are from administering the BFI questionnaires to college students from a midwestern private university in the United States, with N = 190 complete cases (Deng, Wang, & Zhao, 2016). Participants were recruited by campus flyers. A consent form was signed by each participant before data collection.
Data Set 3
The Humor Styles Questionnaire (Martin, Puhlik-Doris, Larsen, Gray, & Weir, 2003) has 4 subscales: affiliative (affili, 8 items), self-enhancing (self-enha, 8 items), aggressive (aggress, 8 items), and self-defeating (self-defe, 8 items). Each item is rated on a 5-point scale where 1 = Never or very rarely true, 2 = Rarely true, 3 = Sometimes true, 4 = Often true, 5 = Very often or always true (−1 = Did not select an answer). This data set is publicly available online (http://personality-testing.info/_rawdata) and was downloaded in the spring of 2015, with N = 993 complete cases.
Data Set 4
The data set comes from the Family Adaptability and Cohesion Evaluation Scales (FACES II; Olson, Portner, & Bell, 1982) that has 2 subscales: cohesion (16 items) and adaptability (adapt, 13 items), and each item is rated on a 5-point scale where 1 = Never or very rarely true, 2 = Rarely true, 3 = Sometimes true, 4 = Often true, 5 = Very often or always true. The data set is from administrating the FACES scale to students from six colleges in Beijing, with N = 852 complete cases (Deng & Zheng, 2012).
Results of the Analysis of Real Data
In this section, we present the results of applying the methodology described in the previous section to the four data sets. The results include
The results are presented in Tables 1 to 4 corresponding to the Data Sets 1 to 4, respectively. Each table contains two parts. The upper panel contains fit statistics Tml and Trml, and their corresponding p value, CFI, and RMSEA.
2
The lower panel contain the estimate of
Data Set 1: Twenty-Six Cognitive Items With Five Subscales (N = 145).
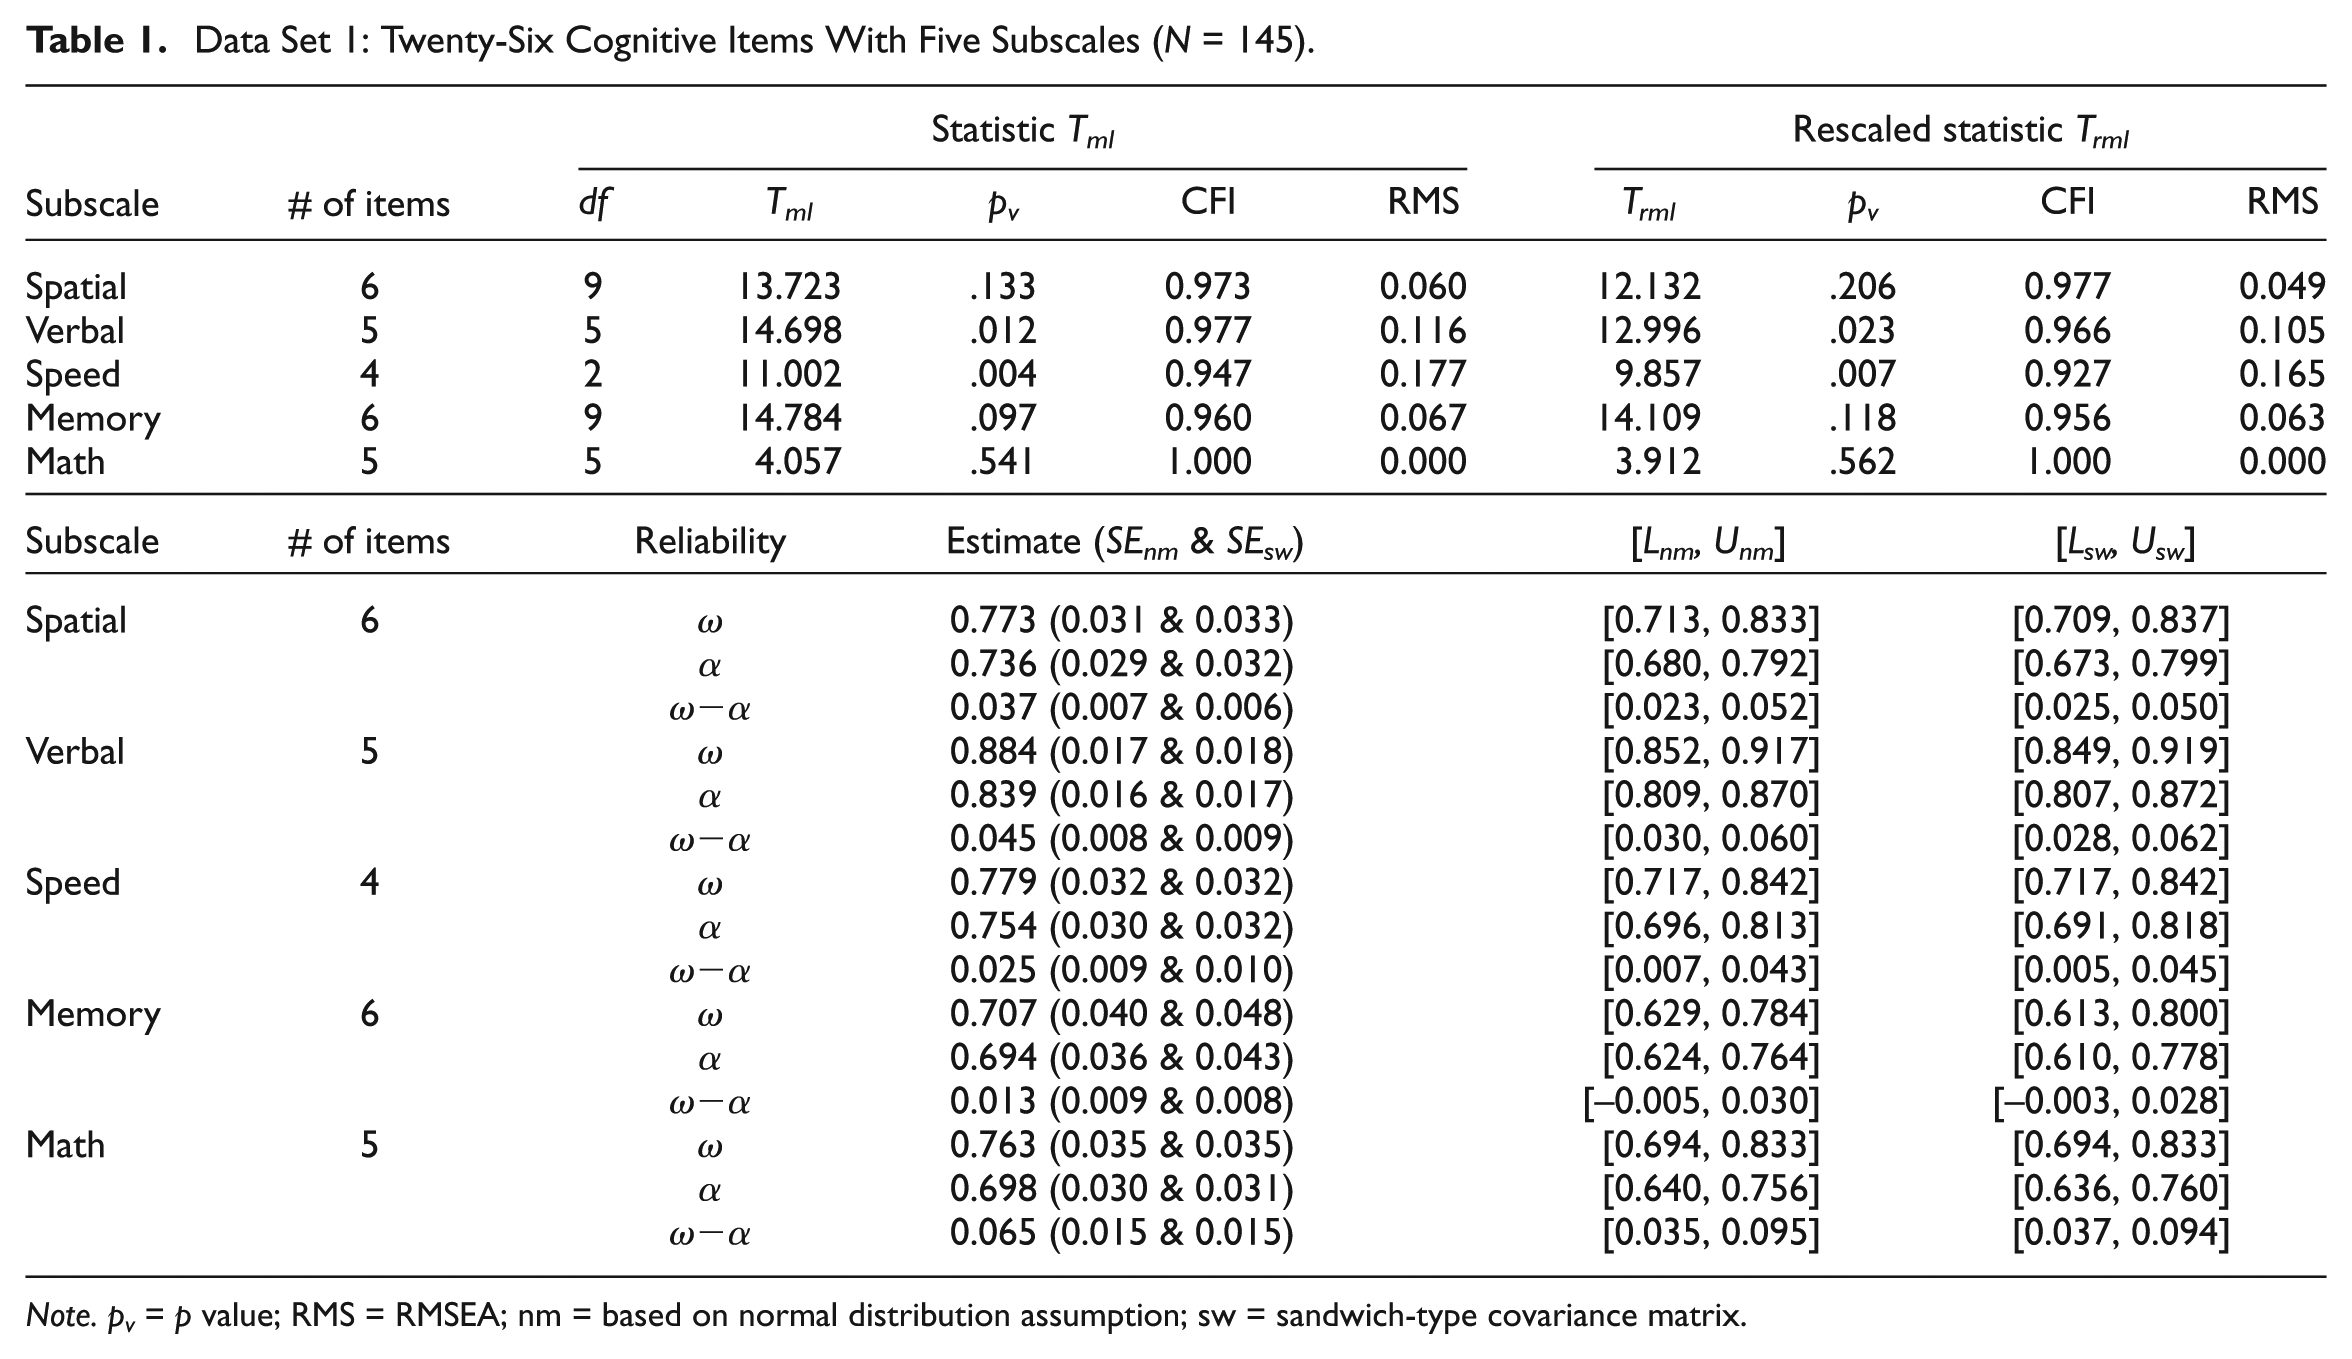
Note. pv = p value; RMS = RMSEA; nm = based on normal distribution assumption; sw = sandwich-type covariance matrix.
Data Set 2: Big Five Inventory With Five Subscales (N = 190).
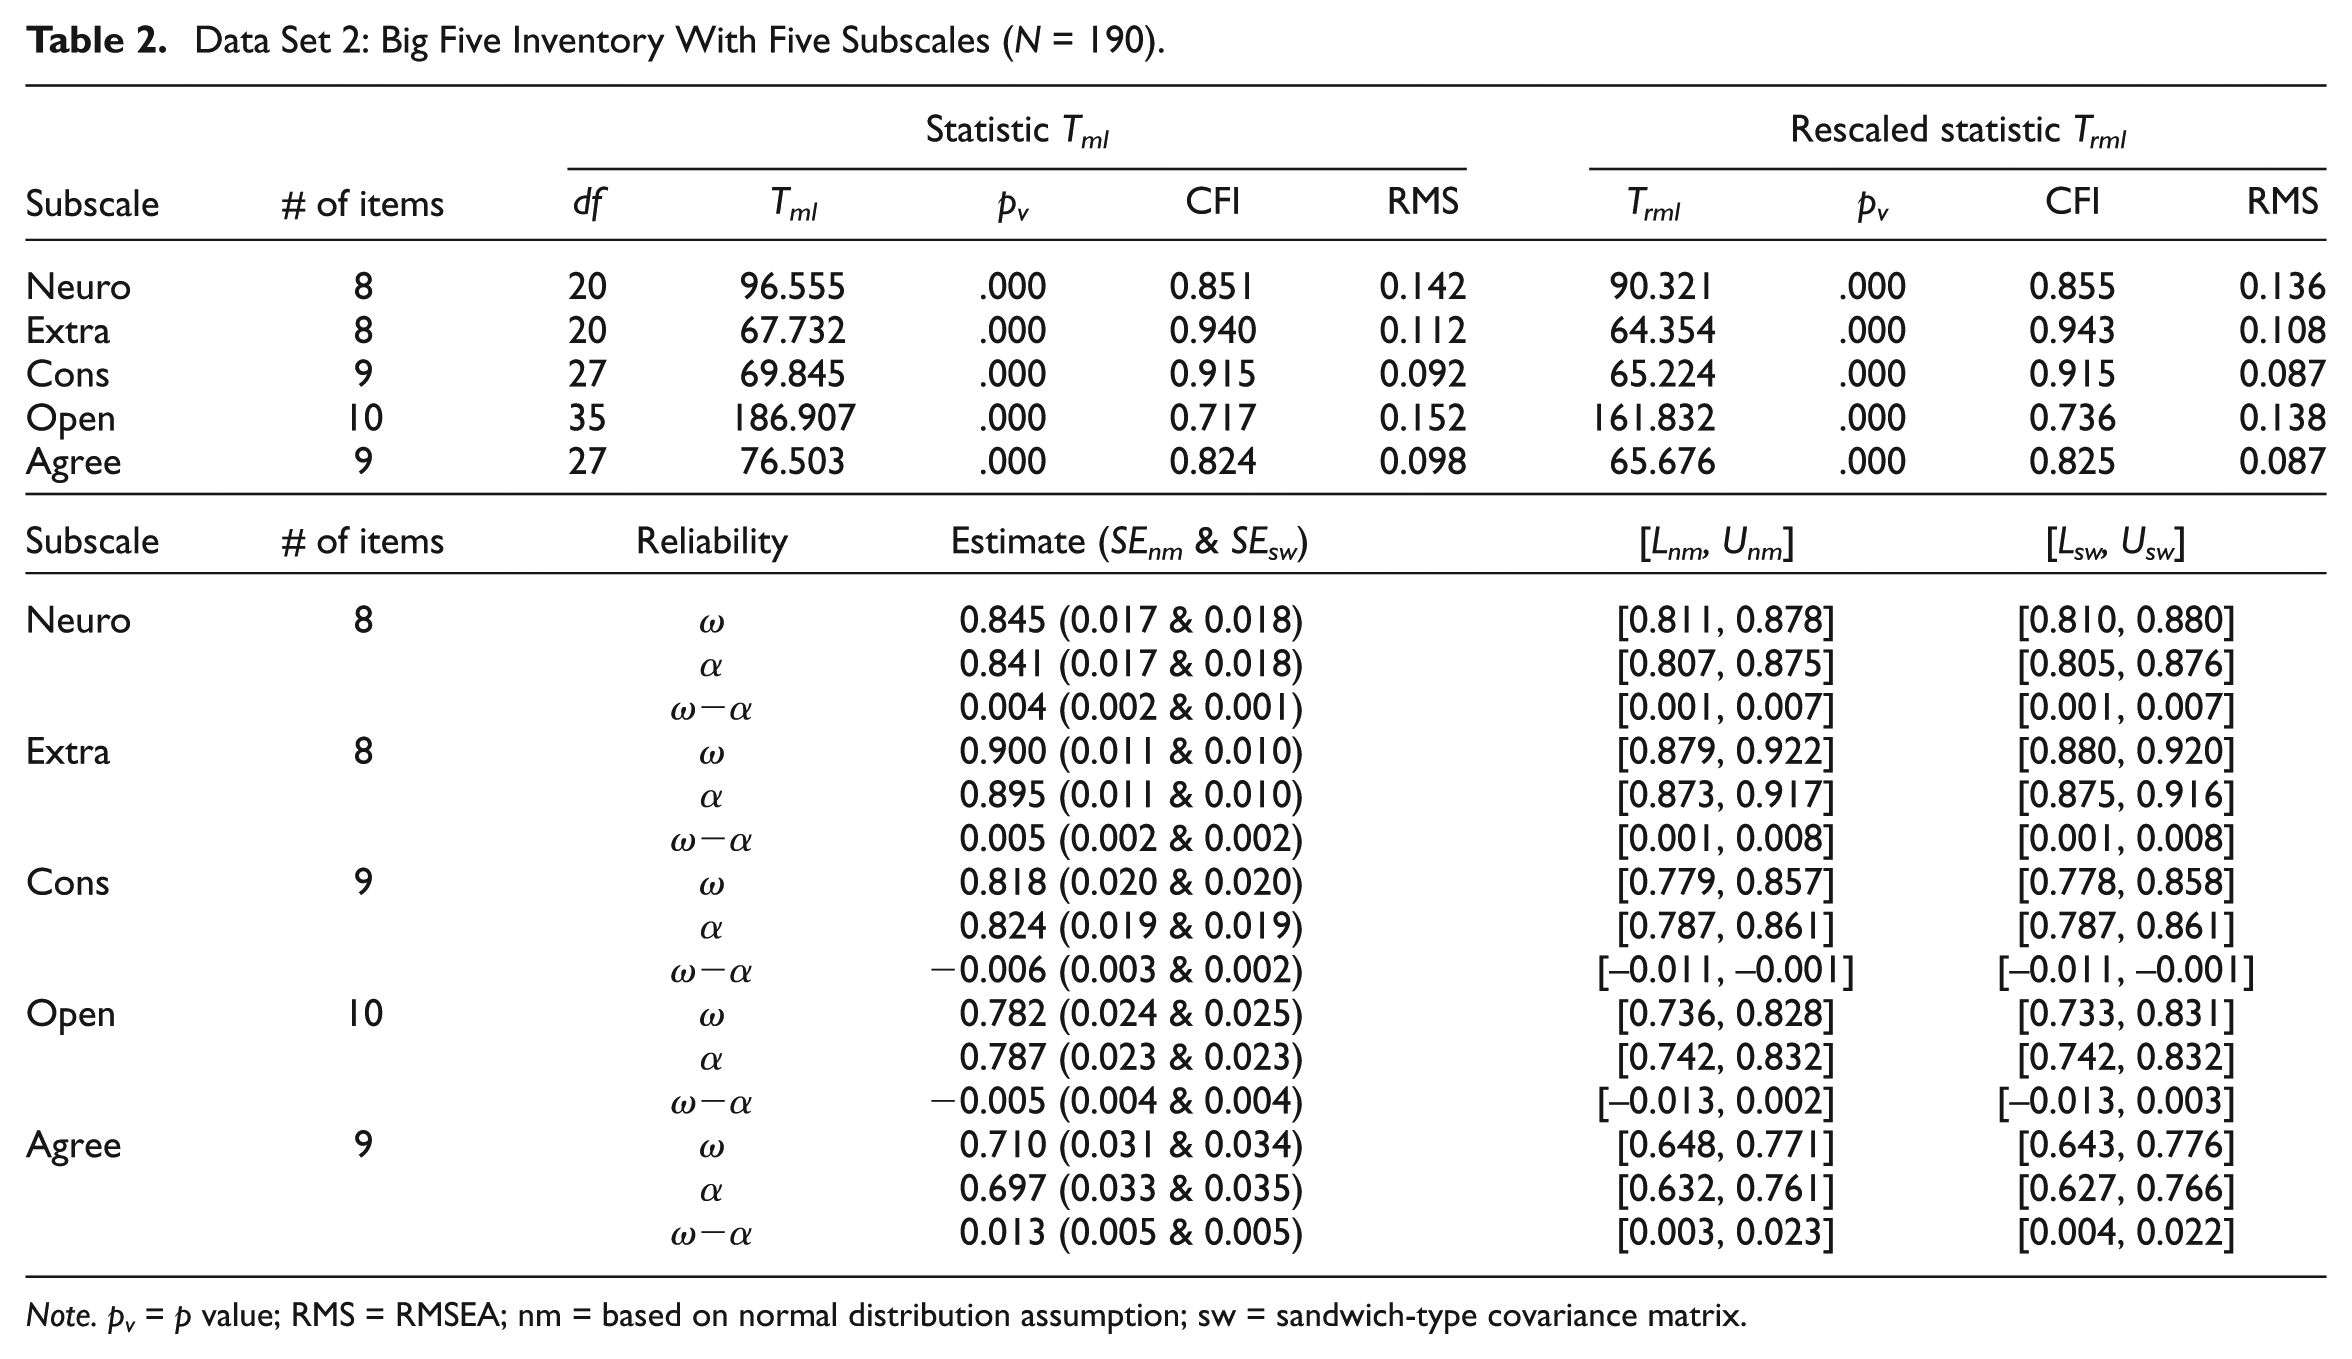
Note. pv = p value; RMS = RMSEA; nm = based on normal distribution assumption; sw = sandwich-type covariance matrix.
Data Set 3: Humor Styles Questionnaire With Four Subscales (N = 993).

Note. pv = p value; RMS = RMSEA; nm = based on normal distribution assumption; sw = sandwich-type covariance matrix.
Data Set 4: Family Functioning Scale With Two Subscales (N = 852).
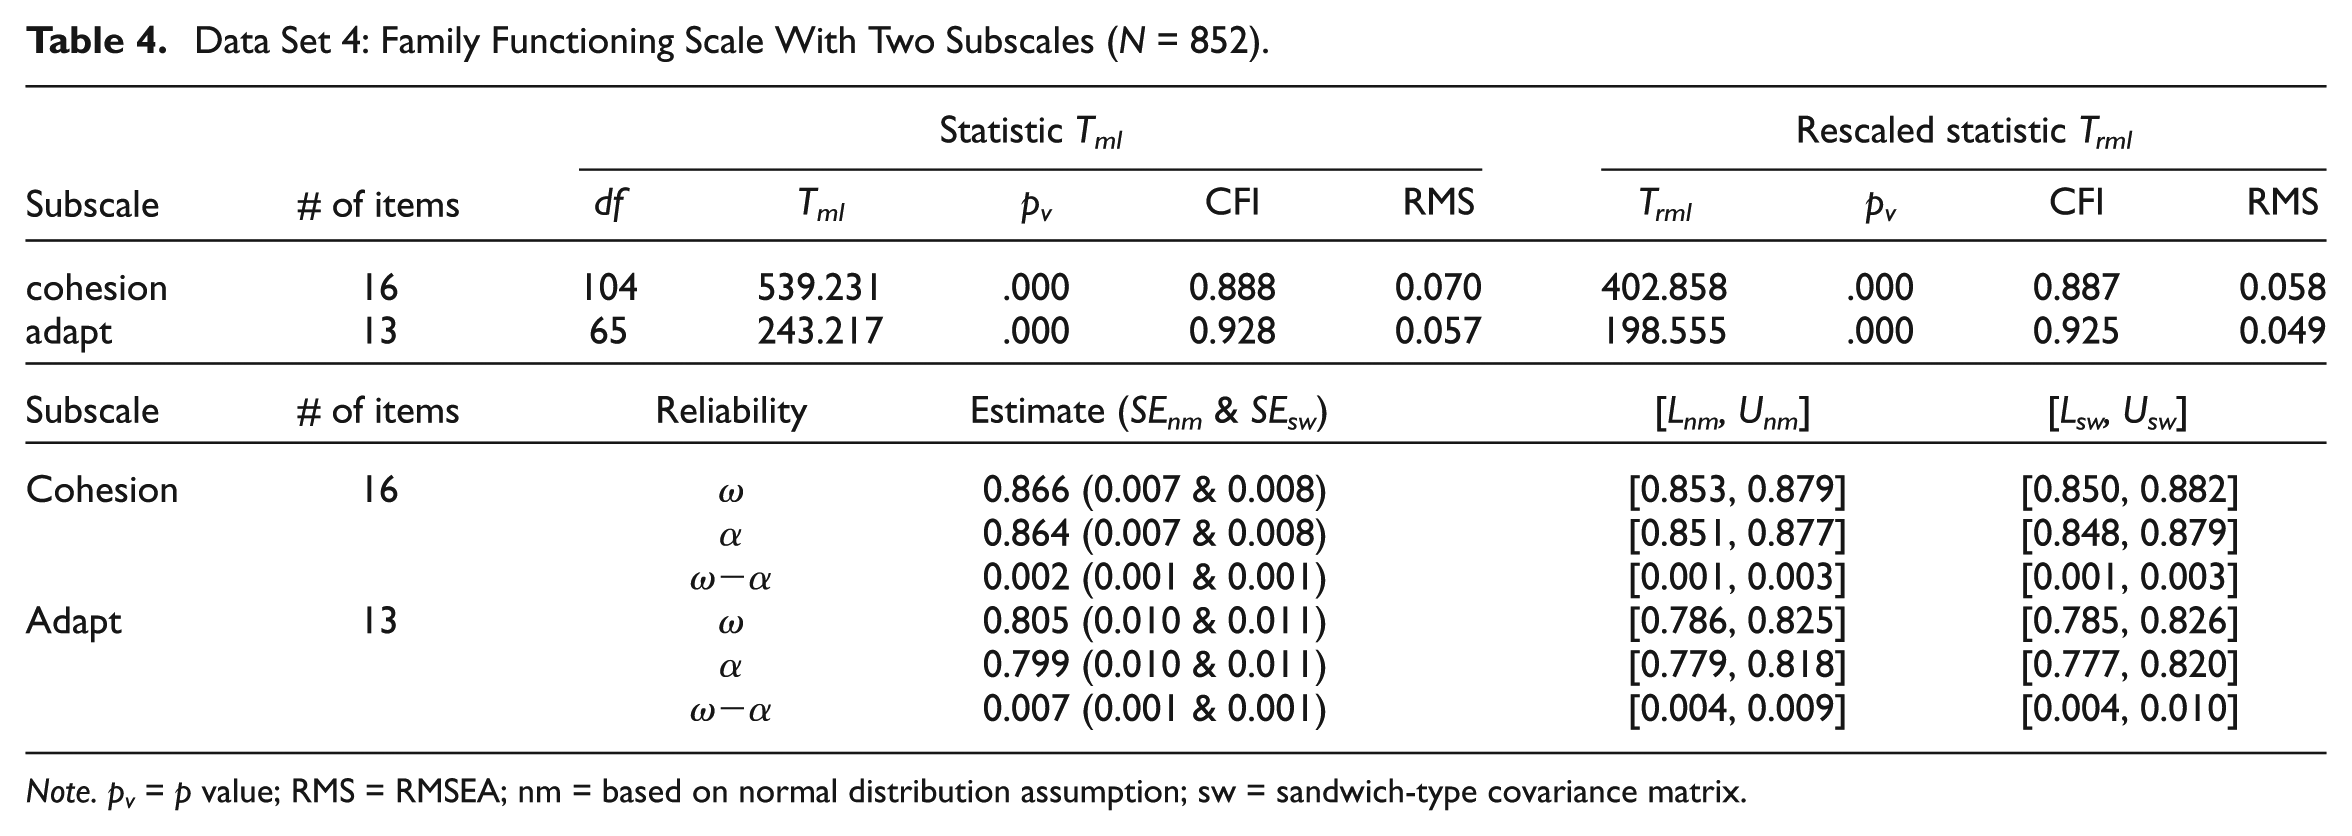
Note. pv = p value; RMS = RMSEA; nm = based on normal distribution assumption; sw = sandwich-type covariance matrix.
For the five cognitive subscales (spatial, verbal, speed, memory, math) of Holzinger and Swineford’s (1939) data, with results in Table 1, the p values corresponding to Trml, are respectively .206, .023, .007, .118, and .562, and RMSEA = .049, .105, .165, .063, and .000, respectively, suggesting that the items measuring subscales spatial, memory, and math can be regarded as approximately unidimensional whereas those measuring verbal and speed are not. However, according to the respective values of CFI (.977, .956, .927, .956, 1.000), the items on subscales verbal and speed can also be regarded as approximately unidimensional.
Clearly, except for the subscale memory, the CI of (
The results for the Big Five Inventory are in Table 2, and the items on each of the five subscales (neuroticism, extraversion, conscientiousness, openness, agreeableness) are not well fitted by a one-factor model (CFI = .855, .943, .915, .736, and .825, respectively; and RMSEA = .136, .108, .087, .138, and .087, respectively). Except for the subscale openness, the CIs for (
The results for the Humor style questionnaires are in Table 3, where the numbers indicate that there are significant difference between the two reliability coefficients in three out of the four subscales (affiliative, self-enhancing, aggressive, self-defeating). Only the CI for (
Results with the last data set (family functioning with 2 subscales: cohesion and adaptability) are in Table 4, where the values of RMSEA (.058 and .049) suggest that the items on each of the subscales might be regarded as approximately unidimensional. However, the values of CFI (.887 and .925, respectively) suggests that items on cohesion is poorly fitted by the one-factor model. The CIs for (
Discussion and Conclusion
Measurement reliability plays an important role in understanding the quality of educational and psychological variables. Alpha, conceived as an “internal consistency” coefficient, is the most widely used reliability coefficient in social science reach. However, the properties of coefficient alpha are not well understood by applied researchers, as previous studies such as Green and Yang (2009, p. 121) pointed out that “the general use of coefficient alpha to assess reliability should be discouraged on a number of grounds”. Similarly, Cho and Kim (2015, p. 207) clarified “six common misconceptions about coefficient alpha: (1) Alpha was first developed by Cronbach. (2) Alpha equals reliability. (3) A high value of alpha is an indication of internal consistency. (4) Reliability will always be improved by deleting items using “alpha if item deleted” [an option in SPSS]. (5) Alpha should be greater than or equal to .7 (or, alternatively, .8). (6) Alpha is the best choice among all published reliability coefficients.
More and more researchers suggest that alpha is not the best choice within current research practice and advocate the switch from alpha to omega, especially when the tau-equivalent assumption is violated. However, the majority of applied researches still tend to choose alpha because they are more familiar with alpha than omega, and also because the difference between alpha and omega was believed to be small. So there is an increasing need to develop a convincing method to compare the difference of coefficient alpha and omega statistically, which will offer an updated perspective for the ongoing debate on the issue.
In this article, we developed a methodology for estimating the SE of (
This study also evaluated unidimensionality properties of items on 16 subscales. Most scales are fitted reasonably well by the one-factor model. However, the fit indices CFI and RMSEA do not always agree with the goodness of fit. This has been pointed out by Kim and Markland (Kim, 2005; Markland, 2005), and our analysis reconfirmed it. The main purpose of this study is to see how often the differences between the two reliability coefficients is significant. Our results indicate that there is no apparent association between the difference of the two reliability coefficients and the unidimensionality properties of the items although omega is calculated on the estimation of the one-factor model. There are still significant difference between
This article provides a scientific method and an R program for computing the SE of (
Following McDonald (1999), the coefficient omega in this article is defined on the estimation of a one-factor model, although the items may not be unidimensional. Alternatively, we can fit the items on each subscale by a multifactor model or by including correlated errors (e.g., Bentler, 2007; Yang & Green, 2010). However, it might be difficult to label the factors of each subscale within well-known or well-developed instruments. Such a difficulty may also pass onto the interpretation of the resulting reliability estimates. More studies in such a direction might be needed in order to understand the difference between reliability estimates based on one and multiple factor models.
In this article, the formula for the SE of (
Footnotes
Appendix A
This appendix contains the details leading to the asymptotic distribution of
Notice that
Using standard calculus, the differential of
Consequently, the derivative of
It follows from the mean value theorem that
where
Similar to (A1), we need to obtain a formula for
where
Notice that
We have
It follows from the mean value theorem that
where
We still need to relate
where
Combining (A1) and (A4) yields
where
Where
A consistent estimate
It follows from (A6) that a confidence interval for
where
Declaration of Conflicting Interests
The author(s) declared no potential conflicts of interest with respect to the research, authorship, and/or publication of this article.
Funding
The author(s) disclosed receipt of the following financial support for the research, authorship, and/or publication of this article: The research was partially supported by a grant from the Department of Psychology, The Chinese University of Hong Kong.