



Abstract
Measurement invariance is a prerequisite when comparing different groups of individuals or when studying a group of individuals across time. This assures that the same construct is assessed without measurement artifacts. This investigation applied a novel approach of simultaneous parameter linking to cross-sectional and longitudinal measures of the construct of positive family relationships. Previously, a scale to measure this construct in mothers was developed longitudinally using the nominal response model of item response theory. In this study, this methodology was conducted for the first time to develop such a scale for children. The data for both informants derived from the Fullerton Longitudinal Study and encompassed 9 annual assessments spanning 8-years (age 9-17 years). This permitted linking across informants studied concurrently and prospectively. This procedure minimized measurement error, furnished a common metric across informants and time and established measurement invariance. Resulting thetas revealed a significant degree of concordance between informants across assessment waves as well as stability of individual differences for both informants over time. This psychometric investigation is unique because it simultaneously established invariance of a construct across informants and time. Implications for future research are discussed.
Keywords
Establishing measurement invariance or equivalence has been and continues to be a fundamental psychometric issue in the fields of education and psychology. Comparing individuals across different groups or studying a group of individuals across time necessitates the assurance of measuring the same construct devoid of measurement artifacts. Only then is a genuine comparison feasible (Rupp & Zumbo, 2006). Contemporary researchers have begun to approach this issue through either data integration techniques (Curran & Hussong, 2009; Marcoulides & Grimm, 2017) or the application of parameter linking between groups cross-sectionally (i.e., cross-informants at a concurrent assessment wave) or with a single group of individuals studied longitudinally (Briggs & Weeks, 2009; Jones & Fonda, 2004; Lambert, Ferguson, & Rowan, 2016; Reeve et al., 2016; Yen, 2007). As for the latter, studies have been short term (typically 2 to 3 years) except for one recent investigation in which participants were studied across an 8-year interval (Preston et al., 2015). The present research is the first to address the overarching issue of parameter linking with both cross-informant and long-term longitudinal data simultaneously to establish measurement invariance of two scales measuring Positive Family Relationships (PFR).
The issue of measurement invariance pertains to an array of areas such as cross-cultural, mental health, family, and cross-national research. For example, Hui and Triandis (1985) brought to light the importance and complexity of this issue for investigators interested in comparing different sociocultural groups. Also relevant is research emphasizing cross-informant assessments. The significance of multi-informant appraisals in child and adolescent mental health has been highlighted by De Los Reyes et al. (2015) from their meta-analysis of studies spanning a quarter of a century. By gathering perspectives of different individuals such as teachers and parents, information about behavior in specific contexts can be ascertained. In a similar vein, family researchers have stressed the importance of including perceptions of different family members to gain a more comprehensive assessment of family functioning (Achenbach, McConaughy, & Howell, 1987; Atkins, 2005; Cook & Kenny, 2004; Dekovic & Buist, 2005). This approach permits the opportunity to determine both concordance and discrepancies in perspectives. However, the accuracy of cross-informant assessments in mental health and family research is contingent on establishment of measurement invariance of the construct of interest. Bingenheimer, Raudenbush, Leventhal, and Brooks-Gunn (2005) have advocated the application of differential item functioning within the framework of item response theory (IRT) to address the issue of measurement invariance in the field of family psychology. Last, in a recent study by Lambert et al. (2016), IRT linking was utilized to demonstrate its applicability to the study of cross-informant and cross-national equivalence in behavioral assessment. The authors contend that IRT-based linking is an underused approach with considerable promise to investigate psychometric invariance. Succinctly, psychometric invariance needs to be established to ensure the same meaning and interpretation of the construct across informants or respondents. The issue becomes more complex when different groups are compared confluently over time.
The present research addressed the conjoint issue of cross-informant and cross-time measurement invariance through the use of parameter linking (or test equating). Parameter linking provides a common scale of measurement for a given construct and reduces the measurement error or artifacts to gain a more precise estimate of the construct (Chen, Revicki, Lai, Cook, & Amtmann, et al., 2009; Embretson & Reise, 2000; Lambert et al., 2016; Reise, Widaman, & Pugh, 1993). Furthermore, when applied longitudinally, parameter linking with equivalent groups can reduce the estimation error by adjusting for small differences in the measure of the latent trait between ages (Hanson & Béguin, 2002). The process of parameter linking utilizes one or more common items as anchor items, consistently functioning across all test forms (Kelderman, 1988), for test calibration.
Recently, Preston et al. (2015) constructed the PFR scale. The conceptualization for this scale is founded in the positive psychology framework and PFR is defined as family members getting along well and supporting each other. Specifically, the scale measures the construct of PFR from mothers’ perspectives when their children were followed annually from ages 9 to 17 years. The construction of the PFR scale is unique in several ways. First, the PFR scale was constructed utilizing the nominal response model (NRM; Bock, 1972, 1997) under IRT, which was a novel application of scale construction to measure the PFR construct (see Nominal Response Model Estimation section below for details on the NRM). Hitherto, instruments measuring family functioning have all been developed using classical test theory approaches. NRM was selected because of its unique ability to empirically evaluate the functioning of each within-item response category in addition to the overall function of items (Embretson & Reise, 2000; Preston et al., 2015). These uniquely informative items consist of exclusively discriminating response categories, which optimize accuracy by minimizing measurement error. Second, utilizing the benefits of IRT, uninformative or redundant items were removed from the scale at each age producing an efficient measurement of PFR. The resulting PFR scale comprised items appropriate for each age, while measuring the same construct across the ages (Embretson & Reise, 2000). Third, alternatively to scales being constructed cross-sectionally, the PFR scale is the first psychological scale to be constructed within a longitudinal methodology. By constructing the scale longitudinally, rather than cross-sectionally, cross-time sampling error is eliminated because the same individuals are appraised over time. In sum, the PFR scale, optimized for each age, contains only uniquely informative items and response category options, providing a precise measurement of PFR across all ages studied longitudinally.
Measurement invariance was established for the resulting outcome scores, thetas (θ), computed for each age representing the score on PFR for the given individuals. Unique to this application of parameter linking, was the use of long-term longitudinal data spanning nine assessments across eight years. Therefore, using parameter linking, the θ scores were placed on a common metric, which allowed for the examination of longitudinal changes in PFR. In subsequent research, stability and continuity of PFR as well as its longitudinal network of relations to other conceptually relevant variables or outcomes were demonstrated, shedding light on its concurrent and predictive validity (Preston et al., 2016).
Addressing the issue of simultaneous measurement of PFR across family members and across time required constructing a parallel measure of PFR for children. To construct such a measure of PFR, children needed to concurrently complete a scale designed to also measure PFR at identical assessment waves and across the same time frame (i.e., ages 9 through 17 years). The present research utilized the methodology presented by Preston et al. (2015) to construct a children’s version of the PFR scale parallel to that of mothers’. This is unique because it furnishes a symmetrical assessment designed to measure the construct of PFR both cross-sectionally and longitudinally for both mothers and their children, resulting in two scales measuring a construct in common from the perspectives of these individuals. The purpose of this psychometric investigation was twofold: (1) construct a scale to measure PFR for children spanning middle childhood through adolescence and (2) establish scale invariance by applying a novel approach of simultaneously linking measures across informants and across time, that is cross-sectionally and longitudinally, respectively.
Method
Participants
The current study utilized data from the Fullerton Longitudinal Study (FLS; A. E. Gottfried, Marcoulides, Gottfried, & Oliver, 2013; A. W. Gottfried & Gottfried, 1984; Guerin, Gottfried, Oliver, & Thomas, 2003), an ongoing investigation originating with 130 children and their respective families from infancy (age 1 year) through early adulthood (age 29-years). The infants were selected through birth notifications received from hospitals surrounding the university and families were invited to participate prior to the infants’ first birthday. To be eligible for admission into the study, infants were to be free of neurological and visual problems, of normal birth weight, and have English speaking parents. For this research, data were from mothers and children assessed annually when the children were 9 to 17 years of age.
The demographic makeup of the sample at the initiation of the study comprised 117 White, 7 Latino, 1 Asian, 1 East Indian, 1 Hawaiian, 1 Iranian, and 2 interracial children reflecting the ethnic background of the area in which the sample was collected. The gender ratio of the participants was roughly equal (48% female). Furthermore, the socioeconomic status (SES) of the families was assessed through the Hollingshead Four-Factor Index of Social Status (Hollingshead, 1975; A. W. Gottfried, Gottfried, Bathurst, Guerin, & Parramore, 2003). This index is based on mothers’ and fathers’ level of education and occupational ranking (if gainfully employed). SES for the sample varied widely from semiskilled workers with no high school degree through professionals. Throughout the course of investigation, the retention rate of participation was substantial with at least 80% of the study sample returning at any assessment wave; and, of those children assessed at age 9 years, at least 93% furnished data at any given assessment wave through 17 years. As for mothers, the return rate was at least 86% across this time frame. Thus, missing data were minimal and there was no evidence of attrition bias in the course of investigation (Guerin et al., 2003). The data are based on a range between 105 and 111 children and between 91 and 107 mothers, which gives us high equivalence in response rate (see Table 3).
Measures
Positive Family Relationships
As in the PFR scale for mothers, children also completed items assessing support, agreement, helpfulness, unity, and discord. Whereas the item content was the same between the two versions of the scale, wording was simplified slightly, fewer items were presented, and the response categories were reduced to accommodate children. Specifically, each of the items contained in the children’s initial pool were identical those on the mothers’ scale. The additional items on the mothers’ scale contained common content to those of the children’s scale, such that neither scale contained items with unique content. Items were analyzed from an initial pool ranging from 14 to 16 items administered across the ages. To further accommodate to the children’s development, response categories increased with age. For ages 9 through 12 years, responses were 1 (a little), 2 (sometimes), and 3 (a lot). For ages 13 through 17 years, responses were 1 (never), 2 (almost never), 3 (sometimes), and 4 (a lot).
Analyses and Results
Nominal Response Model
Preston, Reise, Cai, and Hays (2011) demonstrated the NRM, the most general of the divide-by-total family of polytomous IRT models, as a useful method in identifying situations in which an item contains too many response options without imposing parameter restrictions as is done in the more constrained divide-by-total models (e.g., generalized partial credit model) nested within the NRM (see Ostini & Nering, 2006; Preston & Reise, 2013). Preston and Reise (2013) illustrated applications of the NRM in diagnosing category functioning in ordered polytomous data. In the NRM the conditional probability of an individual with trait level θ responding in category x (x = 0, . . ., mi) on item i can be written:

where, for identification,
In Equation (1), a set of slope and intercept parameters (a, c) are estimated for each response option within an item. These parameters represent the linear relation between the latent trait and the log-odds of responding in a given category. The category intercept parameters in Equation (1) reflect the relative popularity of the response option; the larger the category intercept parameter, the greater relative frequency of responses in that category.
Thissen, Steinberg, and Fitzpatrick (1989) provided an alternative and more useful way of interpreting the parameters of the NRM. Assume the response categories are ordered and let x and x′ = x− 1 represent two adjacent response options (e.g., category 3 and 2). Then the NRM for the choice between two options can be rewritten as shown in Equation (2).

where,
In short, the probability of deciding between any two adjacent choices x and x′ is a monotonically increasing 2-parameter logistic (2-PL) function when a* is positive, or when the response categories are ordered. If the categories are assumed to be ordered so that x = x and x′ = x– 1, then the a* = ax−ax′ parameter provides the discrimination of the distinction between categories x and x− 1 considering only the dichotomous decision between category x and x′. For this reason,
Equation (2) introduces a second new term, namely, the intercept dj = cx′−cx. The differences in c values from adjacent categories divided by the differences in ax (i.e.,

Intersection parameters represent the point on the latent trait scale where a response in adjacent categories is equally likely (Preston & Reise, 2013).
Estimation
Higher scores on the PFR scale correspond to more positive ratings of family relationships. Through preliminary exploratory data analysis (e.g., category response frequencies), the more extreme categories (e.g., never, a lot) were generally endorsed the least. As recommended by Preston et al. (2011), for proper estimation of the NRM, response options were recoded so that each category contained at least 10% of individuals. For example, an item scored as 1, 2, 3, 4 with percentages of individuals contained in each category of 3%, 35%, 57%, and 5% respectively, the first two categories would be combined into the lowest response option and the last two categories would be combined into the highest response option resulting in a dichotomized item (i.e., response options coded as 1, 1, 2, 2). Estimation of the initial pool of items was conducted on resulting data with responses recoded to contain at least 10% of individuals responding in each response category.
The PFR scale items were modeled with the NRM using flexMIRT (Cai, 2012). All IRT analyses were conducted with program defaults for maximum likelihood estimation. For stability of standard errors, estimation of the Fisher information function using 81 quadrature points was specified. The supplemented expectation maximization (EM) algorithm was used to improve accuracy in estimations addressing sample size (Cai, 2008) and expected a posteriori θ scores were produced within flexMIRT (Cai, 2012).
Scale Revision
Development of this scale utilized the methodology implemented for the development of the PFR scale for mothers (Preston et al., 2015). Specifically, the scale was revised under the NRM to optimize scale functioning at the category level which maximizes the information provided by the scale. As in Preston et al. (2015), revisions of items and categories within items were dependent on CBD parameters and intersection parameters. These parameters were used to produce category response curves, item information functions, and test information functions (TIF) for the initial pool of items at each age using R (R Core Team, 2016).
Tables 1 through 3 contain the final version of the child-version PFR scale including item content, CBD parameters and intersection parameters, and standard errors for each age. Modification of response options for each item at each age is represented by the parameters shown in the tables. The supplemented EM algorithm was used to address sample sizes that would normally pose an issue to parameter estimation as it has been empirically shown to produce reasonable standard errors when compared to other estimation procedures (Cai, 2008). This indicates that use of the NRM was appropriate for the construction of the PFR scale. At each age, item content and adequacy of item information were reviewed and determined the inclusion of an item in the scale. Items with relative information peaks at or higher than 0.2 were included in the scale whereas items with information below 0.2 were eliminated which is consistent with the methods implemented by Ura, Preston, and Mearns (2015). For example, “People in my family help each other,” was informative across all ages. Alternatively, items may be uninformative and eliminated for some years but informative and included at others. For example, Item 2—a reverse scored item—“My family does things separately instead of together,” was only informative for the later years and thus was included for ages 13 through 15 years. Additionally, “We can do almost anything we want to in my house,” provided no information at any age and, empirically, was irrelevant to the measure of PFR. Therefore, the item was eliminated. In summary, only uniquely informative items were included in each scale constructed for each age. As shown in Tables 1 through 3, each item is presented in the table with item parameters presented for each age an item was found informative, and, thus, included in the final scale. For instance, while Item 1 was included in the PFR scale at each age, Item 2 was found to informative only at ages 13 through 15 years, so Table 1 only provides item parameters for those ages.
Positive Family Relationship Scale Category Boundary Discrimination (CBD) and Intersection (Int) Parameters as Estimated Under the Nominal Response Model for Ages 9 Through 17 Years: Items 1 to 5.

Note. (R) indicates reverse coded item. SE = standard error.
Positive Family Relationship Scale Category Boundary Discrimination (CBD) and Intersection (Int) Parameters as Estimated Under the Nominal Response Model for Ages 9 Through 17 Years: Items 6 to 10.

Note. (R) indicates reverse coded item. SE = standard error.
Positive Family Relationship Scale Category Boundary Discrimination (CBD) and Intersection (Int) Parameters as Estimated Under the Nominal Response Model for Ages 9 Through 17 Years: Items 11 to 13.

Note. (R) indicates reverse coded item. SE = standard error.
As with the construction of the mother scale, category functioning of each item was evaluated on the revised scales to determine the appropriate response format. Specifically, the functioning of the response format was evaluated separately for each item by evaluating the size of the CBD parameters. Large CBD parameters indicate adequate functioning of the distinction between adjacent response options, whereas near-zero CBD parameters indicated redundant or nondiscriminating response options and were revised by combining those adjacent response options. The resulting response format was free to vary between items within each scale as well as across the 9-year span. For future use, items would be relabeled to include two (1 = Never, 2 = Always), or three (1 = Never, 2 = Sometimes, 3 = Always) response options.
Figure 1 displays the TIF for each revised and final scale for ages 9 through 17 years. Visually, the information of each scale peaks at approximately the mean of PFR and the scale remains informative from about two standard deviations below the mean on PFR to about two standard deviations above the mean on PFR. In addition, the range of the TIF peaks is between relative information of about 0.5 for age 15 years and about 0.9 for age 12 years. As evidenced by the information functions, the PFR scale yields a precise measurement of individuals from the midrange and out to the extremes of the PFR construct consistently from ages 9 through 17 years. Moreover, the overlapping test information curves support that the scale at each year is measuring the same construct and is satisfactorily invariant for the application of test equating (Brennan, 2008).
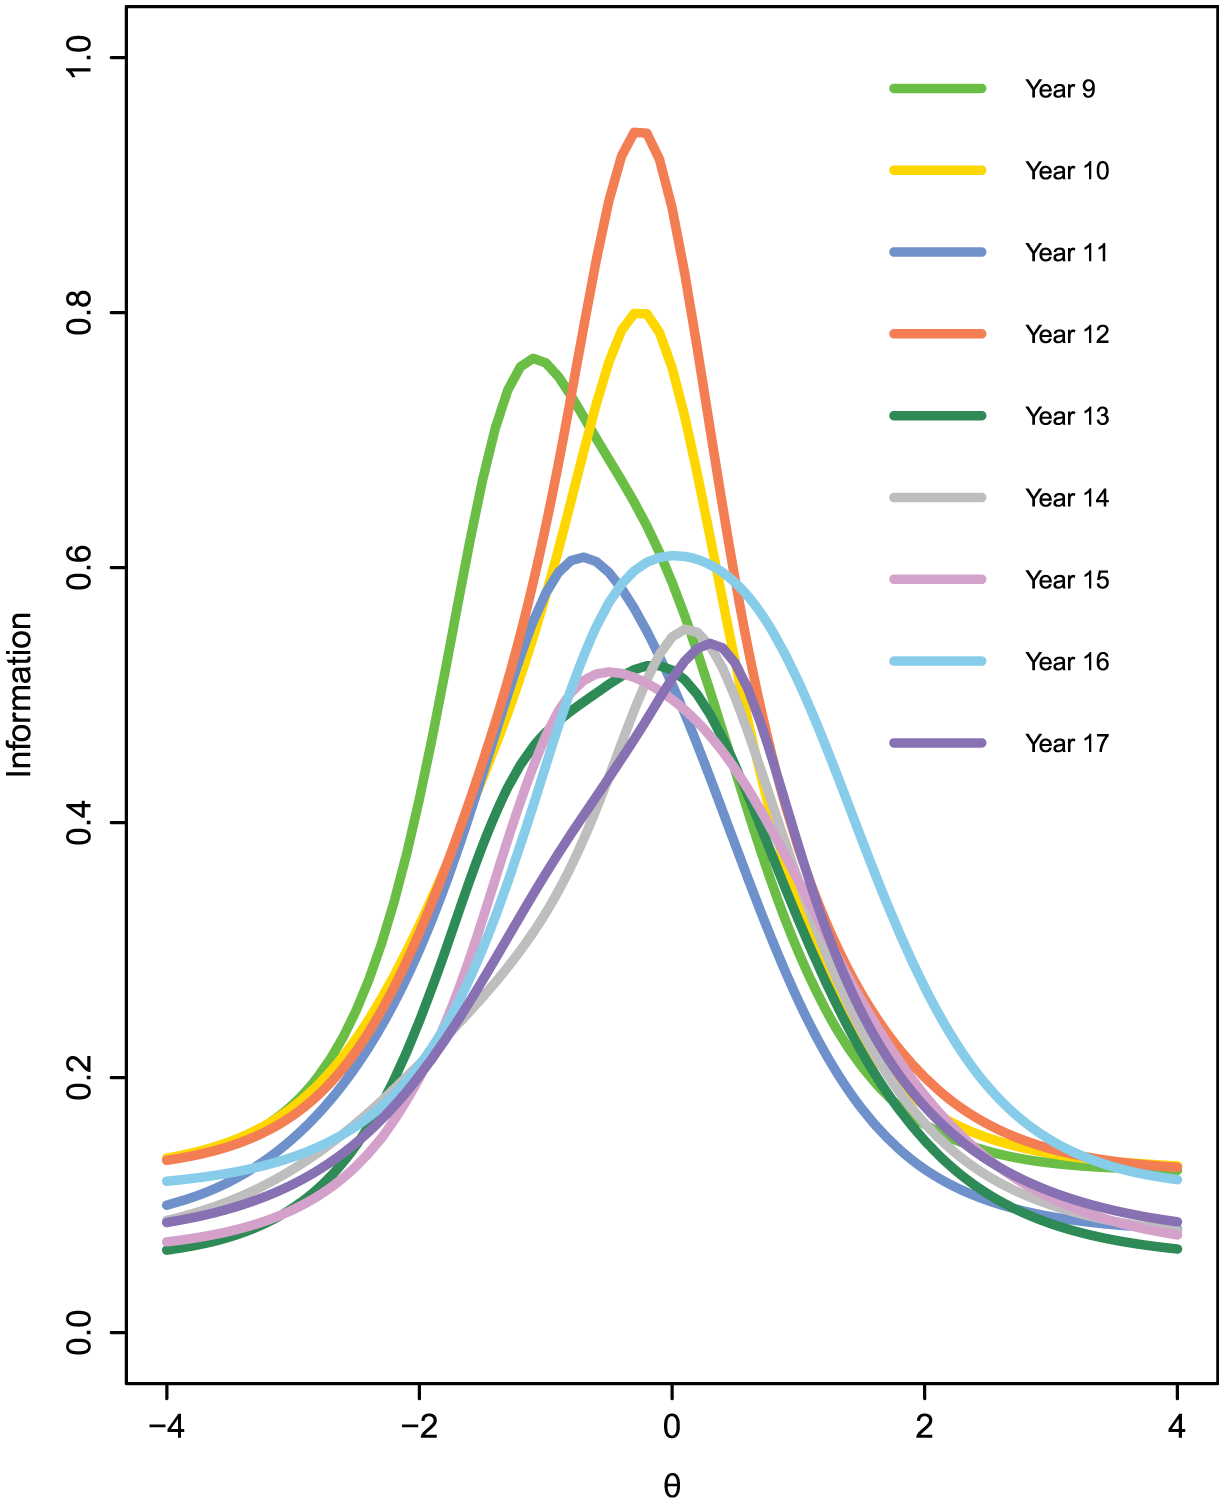
Positive Family Relationship scale test information.
Content Analysis
The construction of the children’s PFR scale resulted in a child version PFR (C-PFR), and hence, parallel versions for both child and mother (M-PFR) scales. The two versions were unique in that they established a multifaceted approach for the assessment of a common construct within this family dyad. However, meaningful comparisons can now be pursued once the linking procedure is completed for the M-PFR and C-PFR. For meaningful comparisons to be made, two methods of test linking—cross-informant (horizontal) and longitudinal (vertical)—were undertaken and are detailed as follows. The first step toward linking the two versions involved the identification of similarly functioning items. It was noted that, when assessed at face value, clusters of items shared similar content when assessing the family. As such, a content analysis was conducted to formally identify the groups of items that functioned most similarly. Doing so would expedite the item selection process by providing banks of similarly functioning items when conducting a link across informants and time. Two raters assessed the entirety of both the mother and child PFR scales for item content into one of six possible content domains consisting of: Getting Along, Group Cohesiveness, Communication, Conflict, Support, and Order (Preston et al., 2015). These content domains were decided on by the authors through a preliminary assessment of the test items. Interrater reliability statistics revealed agreement on item classification (κ = .84, p < .001). Furthermore, all items on which raters disagreed were discussed until a mutual understanding of item meaning was found and all items were classified into their respective content domain. The resulting content domains and all related items were then used to identify pairs of items with similar content for formal, statistical tests of differential item functioning (DIF).
Theoretically, it was assumed that—as taken from the independent raters’ assessments—items with perceived common content would function equivalently across time and/or across informants. As such, pairs of items were selected based on their classification into one of the five aforementioned groups. For each cross-informant or longitudinal link, a single pair of items was selected for DIF testing. Only single item pairs were utilized for the purpose of linking the scales because there are no consistent rules detailing the appropriate number of common items necessary to facilitate a successful link between scales (Lambert et al., 2016). Additionally, Lambert et al. (2016) utilized a link between child and their parents using 3-items, representing approximately, 11.1% of the total items, whereas in the current application, utilization of a single item in the children’s version of the PFR scale represents 20% of the total items. All pairs of items initially selected resulted in non-significant DIF. The DIF tests statistically assess the functioning of a pair of items with nonsignificant results indicating that a pair of items functions similarly to each other. The analyses were conducted in flexMIRT using the “TestCandidates” method with Wald estimation (Cai, 2012) due to the program’s ability to assess for DIF on both mean and slope parameters simultaneously to produce overall item DIF. Thus, this allows for a simultaneous assessment of whether items function similarly in difficulty and discrimination on the latent trait and thus was an ideal program for assessing both cross-informant and longitudinal pairs of DIF items. Specifically, DIF tests produced in flexMIRT evaluate whether scoring functions, slopes, and intercepts function equivalently across items. For instance, Item 2 on the mothers’ version of PFR, a reverse scored item, “Family members keep feelings and problems to themselves,” was compared with Item 3 on the children’s’ version of PFR, “We talk about our problems and feelings in my family,” as the anchor item pair used for the cross-informant link. As can be noted, these items share similar content (i.e., both deal with communication within the family) and did not significantly differ in their item functioning, χ2(4) = 0.01, p = .999.
Tables 4 and 5 show all pairs of items that were used in the subsequent linking procedures. Specifically, Table 4 presents the pair of anchor items used for the initial cross-informant link, and Table 5 presents all pairs of items used for the longitudinal links. As is required for accurate linking, all linked pairs of items contained the same response scale format. Additionally, the table details the order in which the tests were linked with M-PFR and C-PFR scales being linked at the initial period of measurement, age 9 years, followed by test links within each individual for the remainder of the length of measurement. This method was deemed the most appropriate as it established the common metric across both informants while allowing for mothers and children to vary as time progressed. We note that, although utilizing a larger number or proportion of anchor items could potentially lead to more stability in the linking, there are no consistent rules on the number or proportion of items in the item pool required for linking calibration (Chen et al., 2009; Lambert et al., 2016). In previous research, utilizing this longitudinal linking procedure with only one anchor item proved successful in that the scale related significantly to theoretically relevant variables in predicted directions (Preston et al., 2015; Preston et al., 2016).
Linking Procedures: Across Informants.

Linking Procedures: Within-Child.

Cross-Informant Test Linking Procedure
As mentioned previously, the initial test link occurred between the two informants. This allowed for meaningful comparisons across the individuals with values reflecting the same amount of PFR in both individuals. This was necessary as the ultimate goal of assessing the confluent trajectories of both M-PFR and C-PFR scales required that both family members exist on a common metric.
The cross-informant test linking between the two family members was conducted when the children were 9 years of age. Anchor items—pairs of items that function similarly across each group—were selected based on the presence of nonsignificant DIF as previously mentioned. Because item pairs function similarly to each other, it was expected that their designation as anchor items would serve for a common metric between both groups. The test linking process was conducted in R (R Core Team, 2016) using the “plink” package (Weeks, 2011) and the resulting θ scores may be interpreted as standard deviations above or below an average level of expression in PFR. The linking of both family members established a common metric across each informant; however, longitudinal linking still needed to be taken into account. Although, comparisons could be made across informants, PFR construct may vary within each group across time. Therefore, it was imperative to apply a longitudinal linking procedure.
Longitudinal Test Linking Procedure
To allow for a confident assessment of the trajectories of M-PFR and C-PFR scales, the linking procedure over the measurement period was conducted to reduce cross-time measurement error. Following the same procedure as cross-informant linking identification of anchor items and the test linking algorithm provided by the “plink” package in R were conducted. Completion of this longitudinal test linking procedure established a common measure across time. This, coupled with the cross-informant test linking, produced a common measure of PFR from the perspective of each family informant across the nine measurement occasions over the 8-year duration. The application of simultaneous of test linking across-informants and longitudinal data generated a common metric through which both members of the family could be meaningfully compared at all measured time points.
Cross-Informant and Longitudinally Linked θs
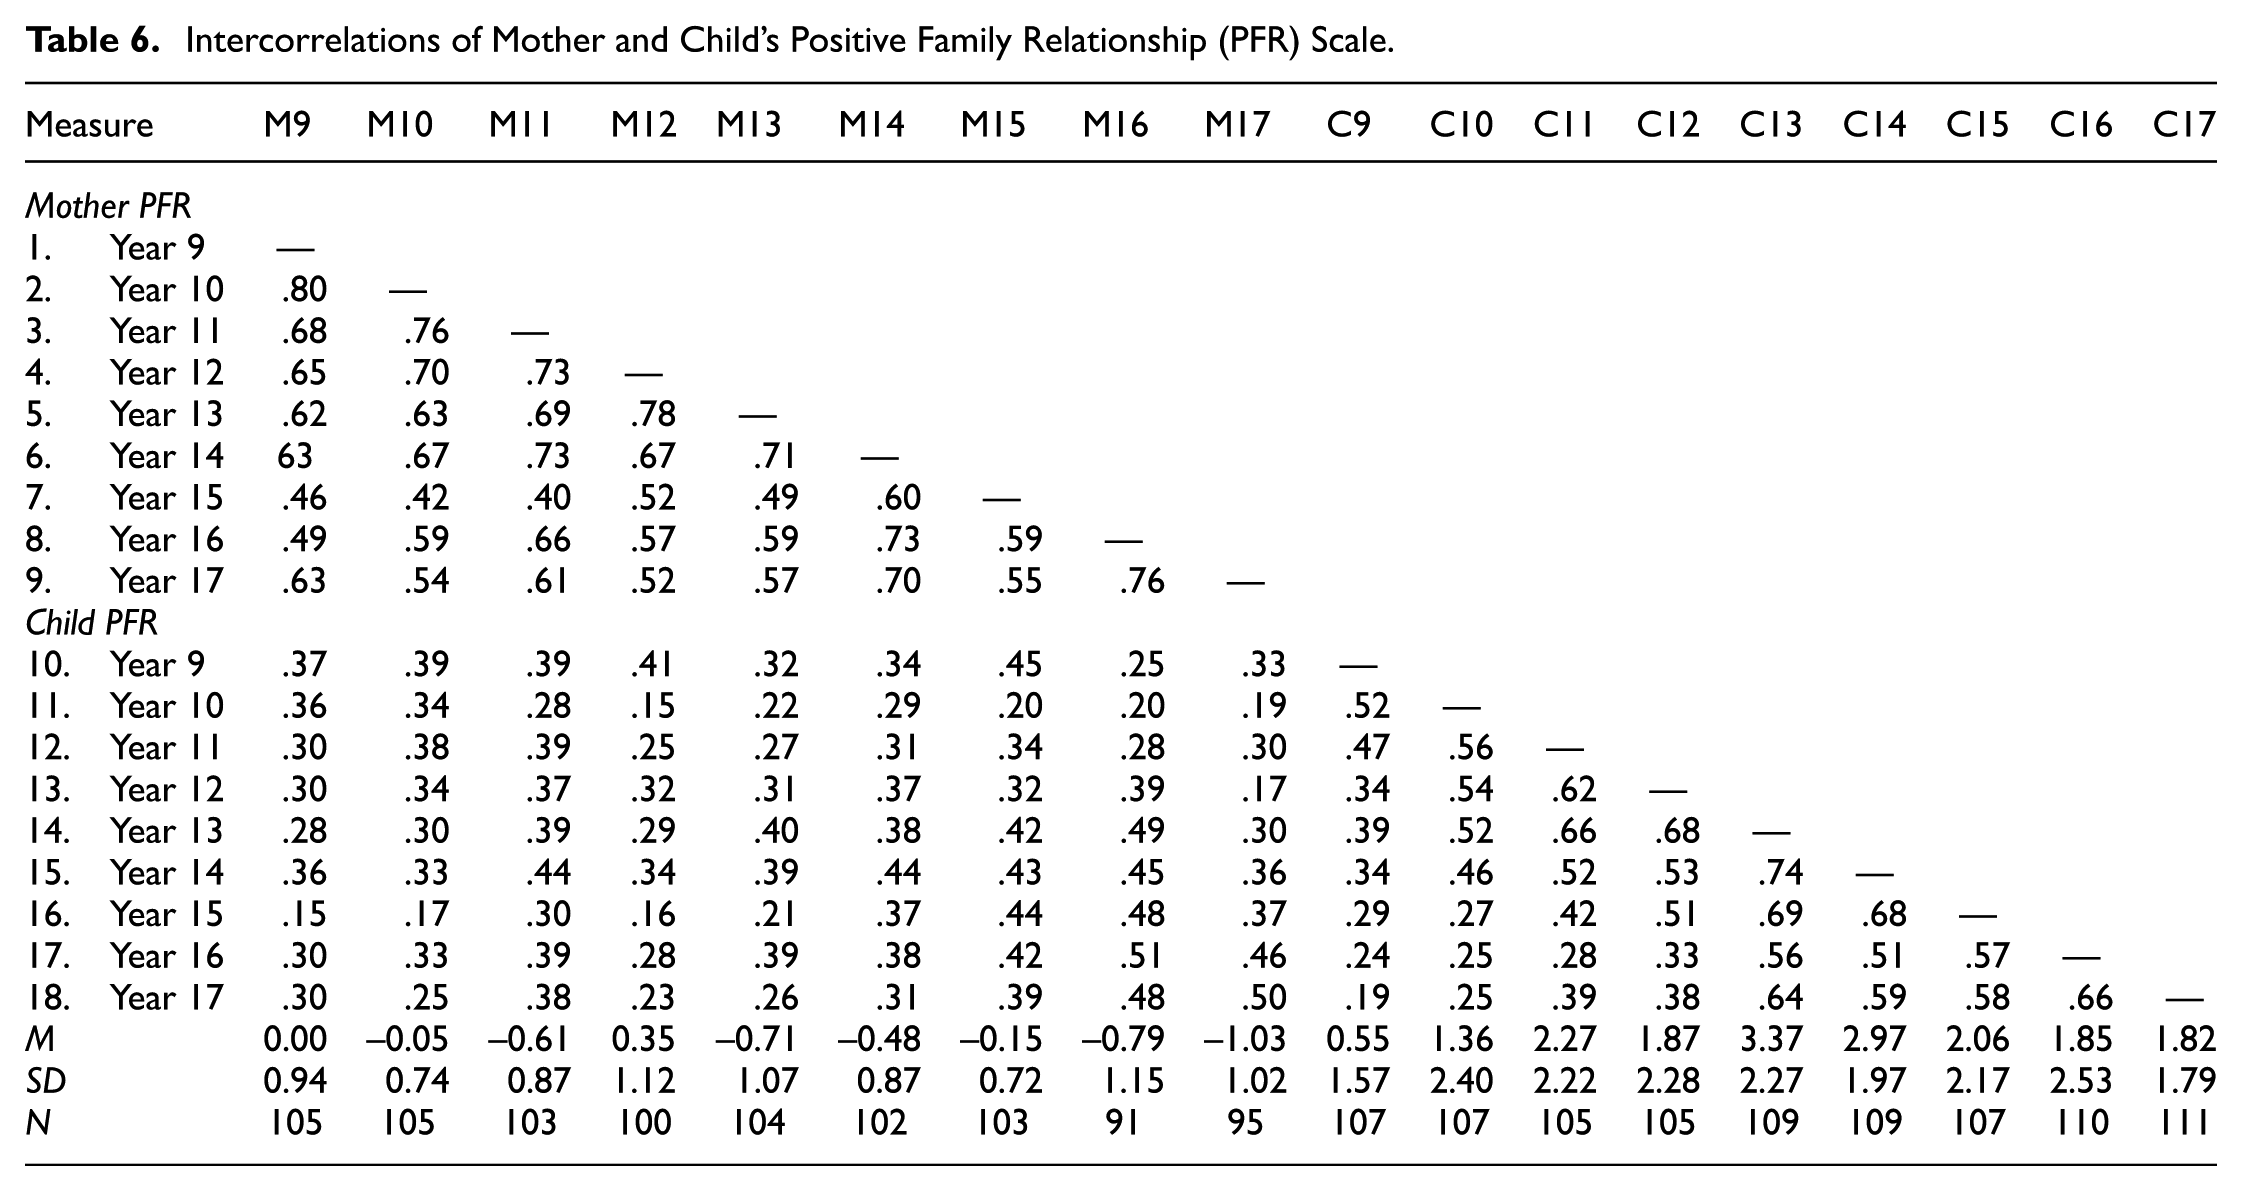
Cross-informant θs between mothers and children showed a significant degree of covariation across matching years with correlations ranging between .32 and .51, p < .05. Concomitantly, longitudinal θs for C-PFR were significantly correlated, with magnitudes ranging from .52 to .74 with adjacent years indicating cross-time stability (Table 6). These magnitudes and patterns with children are comparable to the cross-time correlations of mothers (.59-.80; see Preston et al., 2016). In both children’s and mothers’ matrices, the strongest correlations were between adjacent years with a primarily autoregressive decrease as the interval between ages increased.
Intercorrelations of Mother and Child’s Positive Family Relationship (PFR) Scale.
Discussion
This research contributes to the measurement and psychometric literature in various ways. First, this is an initial application of the parameter linking methodology to address both cross-informant and longitudinal data simultaneously. Second, a children’s version of the PFR scale was developed to be a companion and parallel to that of the mothers’ PFR scale. As with the latter scale, the children’s version was uniquely constructed using the NRM under an IRT framework with longitudinal data. Third, cross-informant and cross-time linking established a common construct measured by the mothers’ and children’s versions of the PFR scale.
As noted in the introduction, previously research has applied linking procedures to the comparison of groups at a designated point in time or with a single sample studied over a relatively short duration. The present research advanced this methodology by implementing both cross-informant (mothers and their children) and longitudinal linking procedures simultaneously. This was accomplished across nine symmetrical time points over 8 years. This procedure minimized measurement error and furnished a common metric both horizontally (i.e., cross-informant) and vertically (i.e., longitudinal). The significance of this is measurement invariance across the PFR scales responded to by mothers and their children. An asset of using this linking procedure is that it proactively establishes invariance, rather than simply testing for invariance (Vandenberg & Lance, 2000).
The mothers’ version of the PFR scale was the first scale developed utilizing the NRM for measuring a psychological construct and over time. The current research is the first to create such a scale for children by applying the same methodology at the same time points traversing the same interval. Specifically, the children’s version was also constructed using the NRM so as to contain uniquely informative items at each age containing only discriminating within-item response categories. Furthermore, this methodology was conducted in a longitudinal framework. By applying parameter linking both horizontally and vertically, measurement invariance was established along these two dimensions encompassing a common metric. Thus, the PFR scales for both mothers and children can be interpreted with the same meaning and quantitative value across these family members studied through time.
Achieving measurement invariance made possible the study of stability of the PFR construct across time for both mothers and their children. Knowing that the measure of the PFR construct is invariant across informant and across time, and because mothers and children are placed on the same metric, changes in individual differences are a function of variation in relative position across time and not due to measurement artifacts (Rupp & Zumbo, 2006). The findings revealed comparable stability of individual differences for both children and their mothers as the children progressed from middle-childhood through adolescence. Furthermore, the cross-informant coefficients indicated both a degree of concordance in perspective of positive family relationships, albeit, there remained unique variance indicating individuality in perspectives. This underscores the importance of utilizing data from multiple perspectives to obtain a comprehensive assessment of family functioning (De Los Reyes, & Kazdin, 2005; Totura, Green, Karver, & Gesten, 2009). Without assuring measurement invariance comparisons across informants are problematic due to the possibility that different perspectives could reflect different constructs and/or errors in measurement.
Establishing measurement invariance of the PFR construct affords several directions for future research (Rupp & Zumbo, 2006). First, the fact that there are new scales for mothers and children measuring the PFR construct, with invariance and a common metric, allows for investigation of the meaning, determinants, and outcomes of concordance and disagreement of their perspectives. Second, a genuine test of incremental and relative predictive validity of mothers’ and children’s perspectives of PFR to outcome variables can be assessed. Third, having nine waves over 8 years of mothers’ and children’s PFR assessments permits the unique opportunity to conduct transactional analyses to determine whether each of their perspectives has an effect on the other. Fourth, multilevel structural equation modeling could be conducted to determine the extent to which mothers’ and children’s PFR perspectives share the same longitudinal network of relations to theoretically relevant variables (Preston et al., 2016). Such an analysis sheds light on the meaning of the PFR construct from dual perspectives, indicating construct equivalence. Fifth, latent change analyses could be applied to these data to identify trajectories of mothers and children’s PFR scores across time, and further, to identify if and how these trajectories interact. This can be studied only because the mothers’ and children’s PFR scores have a common metric. Sixth, by using growth mixture modeling for example, sub-classes of family PFR could be identified, not based solely on a single informant, but rather on the dual trajectories of both mothers and children. Last, since scale invariance has been established by the cross-informant and cross-time linking procedures, future research could employ the data integration methodology presented by Marcoulides and Grimm (2017) combined with multilevel IRT analyses, due to the dependence of observations, to examine individual changes in PFR and determine differences in the trajectories based on family member. In conclusion, the present research has established that measures of a construct, in this case, positive family relations, are interpreted in a conceptually similar manner by both mothers and their children longitudinally from childhood through adolescence. The application of the parameter linking procedure to cross-informant and longitudinal data simultaneously, provided a methodological advancement and has important implications to various content areas of psychology.
Footnotes
Acknowledgements
We thank the parents and children for their participation in the Fullerton Longitudinal Study.
Declaration of Conflicting Interests
The author(s) declared no potential conflicts of interest with respect to the research, authorship, and/or publication of this article.
Funding
The author(s) disclosed receipt of the following financial support for the research, authorship, and/or publication of this article: Portions of this research were supported by grants from the Spencer Foundation, Thrasher Research Fund, and California State Universities, Fullerton and Northridge.