



Abstract
The maximal reliability of a congeneric measure is achieved by weighting item scores to form the optimal linear combination as the total score; it is never lower than the composite reliability of the measure when measurement errors are uncorrelated. The statistical method that renders maximal reliability would also lead to maximal criterion validity. Using a career satisfaction measure as an example, the present article calculated the maximal reliability and maximal criterion validity and compared them with the composite reliability and the scale criterion validity, respectively. The improvement of reliability and validity indicated that the optimal linear combination is preferred when forming a total score of a measure. The Mplus codes for analyzing maximal reliability, maximal criterion validity, and related parameters are provided.
Introduction
The development of psychometric instruments with high measurement quality always concerns methodologists as well as empirical researchers (Dimitrov, Raykov, & Alqataee, 2015). Since reliability and validity are two basic concepts related to the quality of measuring instruments (also referred to as measure or scale in this article), they have received an impressive amount of attention over the past century (Penev & Raykov, 2006). Reliability simply describes the “consistency” of a measure, while validity estimates how “well” a test measures what it purports to measure (Cohen & Swerdlik, 2009). Validity is the ultimate goal for examining measurement quality; meanwhile, we also require reliability to reach a satisfactory level in order to make a valid test. Sometimes the relationship between reliability and validity appear to be paradoxical, and it is likely that a measure with lower reliability is preferred because of higher validity (Guilford, 1954; Li, 2003): Validity is a more important concept than reliability. However, over the past few decades, methodological researchers have shown much more interest in the estimation of reliability rather than validity.
The discussion of reliability estimation focuses predominantly on linear composites of sets of measures that provide multiple converging sources of information about latent constructs of interest. Often, researchers have been preoccupied with the overall sum score reliability, frequently referred to as the composite reliability (unit-weighted or unweighted reliability). An alternative approach to estimate reliability is associated with the concept of the optimal linear combination (OLC), which renders maximal reliability. Maximal reliability is achieved by giving each item score an optimal weight. The linear combination formed by these weighted total scores, which result in maximal reliability, is called the OLC. The OLC furnishes maximal reliability that is never lower than the composite reliability (Li, 1997; Li, Rosenthal, & Rubin, 1996; Raykov, 2004; Raykov, Gabler, & Dimitrov, 2015).
The aim of maximal reliability is not simply to achieve reliability to a maximum value; it is also to identify a linear combination of items that minimize the effect of measurement errors on the total score. Traditionally, we obtain the linear combination of an overall sum score by assigning unit weights to each item, ignoring the fact that each item contributes differently to the common latent construct because the factor loadings of items are rarely the same. In fact, an infinite number of linear combinations can be derived from giving various weights to individual items, and the OLC is the combination that allows the reliability of the total score of a measure reach its maximum. The core value of the OLC and the associated maximal reliability is not about finding an “upper bound” for reliability; rather, it provides a total score in the shape of a linear combination that is affected by measurement error to the least possible degree.
Currently, the discussion of the OLC and the associated maximal reliability remains mostly theoretical. Only a few empirical studies have been conducted applying these concepts. For example, Willoughby, Pek, and Blair (2013) used maximal reliability in an attempt to develop an optimal short form measure of executive function. Dimitrov et al. (2015) applied maximal reliability during the process of developing a measure of general academic ability, showing that maximal reliability is a method that can significantly help researchers improve the efficacy as well as measurement quality. The lack of applied research addressing maximal reliability may be partly due to the confusing concept of weighted sums of measurement items under OLC and partly due to the lack of readily accessible approaches to the process of measurement quality evaluation. Nonetheless, given that the maximal reliability is never lower than the composite reliability, it is a method worth introducing, as it would improve scale constructs to some extent in most situations.
Validity, which is at least as important as reliability, is a rather complex concept that is often reflected by accumulated evidence rather than a single indicator (Anastasi, 1988). Criterion validity is a major type of evidence that is frequently of interest in empirical research (McDonald, 1999). Penev and Raykov (2006) demonstrated that the weighted total score yielding maximal reliability also provided maximal criterion validity for congeneric measures if the measurement errors are uncorrelated among themselves, with the latent construct and with the criterion variable. In other words, the OLC possesses the highest validity as well as reliability if the above-mentioned assumptions are satisfied. However, there is a severe lack of empirical research on the estimation of differences between the criterion validity achieved by the OLC and the simple total score.
This article aims to help bridge this gap by providing a treatment of the topic from the perspective of an applied researcher. Specifically, we discuss an approach to linear composite construction based on the above-mentioned OLC and use it on a developed congeneric measure, career satisfaction (CS). Career satisfaction is an indicator of subjective career success, and it signifies the satisfaction that an employee derives from the intrinsic and extrinsic aspects of his or her career (Karatepe & Olugbade, 2016; Kong, Cheung, & Song, 2012). The career satisfaction measure was developed by Greenhaus, Parasuraman, and Wormley (1990) with five items (sample item: “I am satisfied with the success that I have achieved in my career”). Career satisfaction is an important variable in organizational psychology and has been found to be closely related to numerous factors, including work support (Armstrong-Stassen & Ursel, 2009; Karatepe, 2012; Karatepe & Olugbade, 2016), performance (Armstrong-Stassen & Ursel, 2009; Karatepe, 2012), turnover intentions (Karatepe & Olugbade, 2016), and perceived career success (Eby, Butts, & Lockwood, 2003).
Two criteria were used to examine the concurrent validity of the career satisfaction measure: (a) Internal marketability (IN), which is a type of perceived career success, adopted from Eby et al. (2003) that contains three items (sample item: “My company views me as an asset to the organization”) and (b) Possibilities for professional development (PD), which is included in organizational support, developed by Bakker, Demerouti, Taris, Schaufeli, and Schreurs (2003) and contains four items (sample item: “My work offers me the opportunity to learn new things”). Responses to these three measures and their respective items were made on a 5-point scale (1 = totally disagree, 5 = totally agree).
The present study used CS as an example to show how maximal reliability and maximal criterion validity could be implemented in realistic settings. The purpose of the present study was twofold: (a) to estimate reliability and criterion validity using both unweighted and weighted total scores in a developed measure and evaluate their differences and (b) to provide readily applicable procedures (including Mplus codes) for maximal reliability and maximal criterion validity estimation. An important empirical implication resulting from this study was to demonstrate that it is possible to improve the accuracy of a measurement by using statistical methods such as assigning weights to item scores.
Our study is based on four assumptions: (a) all scales used in this study are unidimensional and measure a single latent construct; (b) measurement errors are uncorrelated among themselves; (c) measurement errors are uncorrelated with the latent construct; (d) the error terms are uncorrelated with the criterion.
Optimal Linear Combination of Measurement Indicators
A substantive concern of this empirical study was to identify a linear combination of the career satisfaction measure that is associated with optimal psychometric features, specifically high measurement quality. Accordingly, it was desirable to find a linear combination of these measures that is associated with the maximal possible reliability among all linear combinations. Such a linear combination, which is referred to as the OLC, not only possesses maximal reliability but is also associated with maximal criterion validity for unidimensional measures under the condition that the predefined criterion is uncorrelated with measurement errors. This condition is easily tested using latent variable modeling (Penev & Raykov, 2006).
The idea of weighting item scores in order to improve the quality of multi-item scales can be dated back to the 1940s (Mosier, 1943) and has continued to attract the attention of psychometricians (Gabler & Raykov, 2016 1 ; Li, 1997; Li et al., 1996; Penev & Raykov, 2006; Raykov, 2004; Raykov, Gabler, & Dimitrov, 2016). Given that the concepts of OLC and maximal reliability are rather unfamiliar for most readers, the theoretical background is explained in detail below.
Assume that a set of (approximately) continuous items

where
It is well known that the composite score, denoted as Z, with p items for a single factor model is calculated as follows:

The composite reliability coefficient for a congeneric measure is as follows (e.g., Brunner & Süb, 2005; McDonald, 1999; Raykov & Grayson, 2003):

The OLC of the measure is defined as the combination that possesses the highest reliability among the possible linear combinations,

The optimal weight is identified as follows (Bartholomew, 1996; Raykov et al., 2015):

After combining Equations (4) and (5), the OLC (weighted total score) with maximal reliability is as follows:

and the population maximal reliability, denoted as

It is important to note that
Furthermore, for any criterion C that is uncorrelated with the measurement errors, maximal criterion validity is also obtained under OLC if and only if the measure is congeneric (Penev & Raykov, 2006).
An Example
Data
The data in the present study came from 475 middle school teachers in China. The basic descriptive statistical information for the indicators is provided in Table 1. The absolute value of skewness is between 0.10 and 0.74 and that of kurtosis is between 0.09 and 1.11, suggesting that the multivariate normality assumption was not violated. Therefore, we adopted the popular maximum likelihood (ML) method for parameter estimation (Finney & DiStefano, 2006; West, Finch, & Curran, 1995). The basic descriptive statistical analysis (mean, SD, skewness, and kurtosis) was done using SPSS 23. All other analyses were done using Mplus 7.0 (Muthén & Muthén, 1998-2015).
Descriptive Statistics of Career Satisfaction, Possibilities for Professional Development, and Internal Marketability Measures.

Note. ϖ is omega coefficient (McDonald, 1970) used to calculate the composite reliability of measurements (Raykov & Grayson, 2003). The reliability of career satisfaction is of major interest in the present article and will be discussed further.
Testing for Unidimensionality of Career Satisfaction
Career satisfaction is a congeneric scale that has been applied in empirical research for over 20 years. Since the assumption of unidimensionality is rather strong when applying the OLC, we first tested whether the measurement model fit our data using CFA.
The values of the goodness-of-fit indexes demonstrated a tenable data fit of the single-factor model: χ2/df = 2.482, comparative fit index (CFI) = 0.988, Tucker-Lewis index (TLI) = 0.976, and root mean square error of approximation (RMSEA) = 0.056, with a 90% confidence interval (0.016, 0.096), indicating that the model was acceptable (Hu & Bentler, 1999; Marsh, Hau, & Wen, 2004). Equivalence testing was also adopted to provide additional information on the model fit. The T-size RMSEA (RMSEAt) in equivalence testing was 0.096 and the T-size CFI (CFIt) was 0.953, which indicates 95% confidence that the population CFI is above 0.953 and that the size of misspecification is no more than 0.096. By comparing these T-size results and the relative cutoff values, it was possible to distinguish the model fit between poor, mediocre, fair, close and excellent. The results showed that RMSEAt achieved fair fit and CFIt suggested close fit. Equivalence testing further proved that the data were well fitted into the one-factor model. For detailed mathematical proofs and application procedures, readers should refer to Marcoulides and Yuan (2016) and Yuan, Chan, Marcoulides, and Bentler (2015).
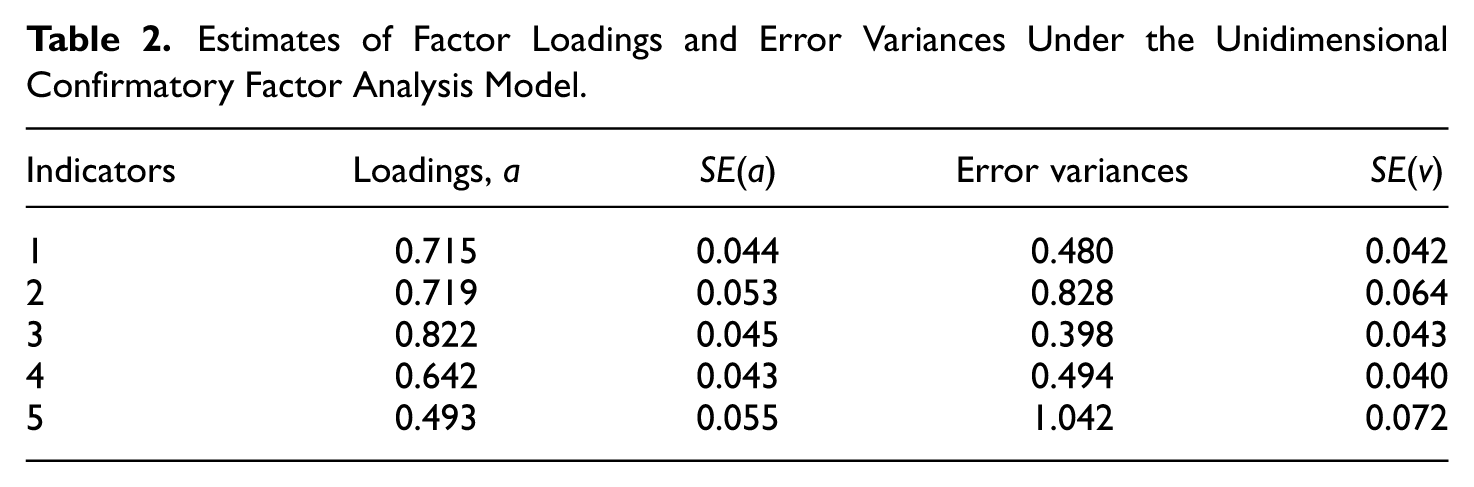
According to the CFA model, all of the standardized factor loadings were higher than 0.3 (p < .001). The unstandardized factor loadings and residual variances, along with their standard errors, are provided in Table 2. Based on these results, it is plausible that career satisfaction under the CFA model is essentially unidimensional. This finding is crucial for the identification of an OLC that furnishes maximal reliability and maximal criterion validity, two concepts that we will demonstrate in the following subsections.
Estimates of Factor Loadings and Error Variances Under the Unidimensional Confirmatory Factor Analysis Model.
OLC for the Measure
The OLC for the five indicators under the unidimensional model is obtained via Equation (6), as described in the preceding subsection. That is, with

By replacing the factor loadings

It is worth noting that the ranking of the 5 weights is
Testing for Maximal Reliability
As discussed earlier, the weighted score obtained with the OLC in Equation (9) is associated with maximal reliability and maximal criterion validity (for any criterion variable used). The Mplus code is provided in Appendix A; this produced the OLC weights in Equation (9), the maximal reliability, and the reliability of the common composite (unit-weight) score:

Accordingly, the resulting estimates of reliability for the weighted score under the OLC in Equation (9) and the common composite in Equation (10) were found to be 0.817 and 0.780, respectively. The difference was delta = 0.037, with the 95% confidence interval being (0.020, 0.050). Therefore, the maximal reliability was higher than the composite reliability in this case. The theoretical justification of their differences is provided in other studies (Li, 1997; Li et al., 1996; Raykov et al., 2015).
Testing for Maximal Criterion Validity
To test the maximal criterion validity of two criterion measures, we needed to know that the criterion was uncorrelated with measurement errors. We examined the CFA model, which assumed that the measurement errors were uncorrelated with the latent variable in the first place. The tested CFA models are shown in Figure 1. Then, we examined the difference between maximal criterion validity and scale criterion validity. The Mplus code for the maximal criterion validity estimation is given in Appendix B.
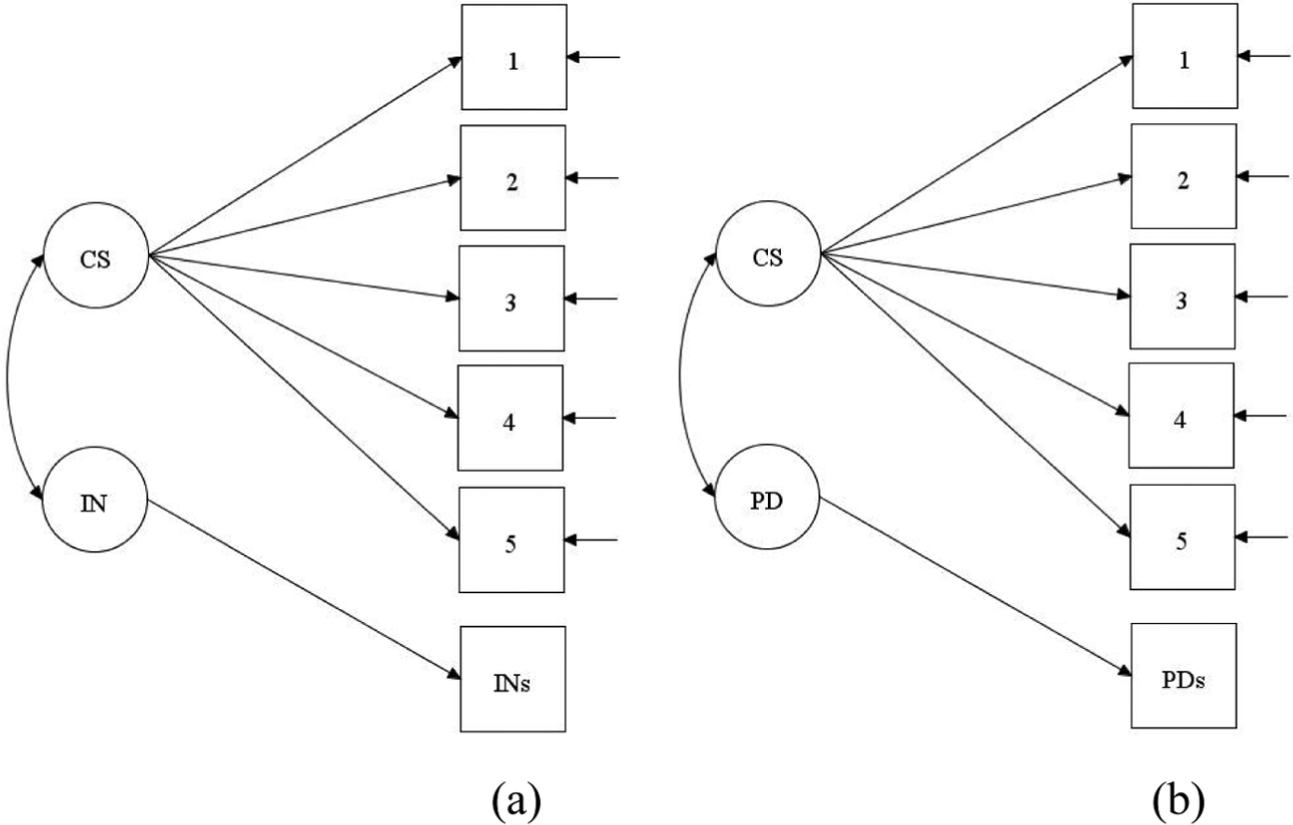
CFA models for criterion correlation.
When using internal marketability as a criterion, as Figure 1a, the model fit indexes provided reasonable results: χ2/df = 2.69, CFI = 0.982, TLI = 0.970, and RMSEA = 0.06, with a 95% CI (0.032, 0.089). Equivalence testing showed that RMSEAt = 0.089 and CFIt = 0.948, which reflected fair fit and close fit, respectively. We concluded from the moderate fit indexes that the criterion was not correlated with measurement errors, thereby justifying the following analysis of the maximal validity coefficient. The maximal and scale validity coefficients were 0.591 and 0.581, respectively, and the difference was delta = 0.010, with the 95% CI being (0.006, 0.015).
When using possibilities for professional development as the criterion, the same procedure was applied. The CFA result for Figure 1b also showed moderate fit, χ2/df = 2.179, CFI = 0.987, TLI = 0.979, and RMSEA = 0.05, with a 95% CI (0.019, 0.080). Equivalence testing results indicated that both T-size CFI and RMSEA reached close fit, with RMSEAt = 0.080 and CFIt = 0.957. The maximal criterion validity and scale criterion validity were 0.589 and 0.576, respectively, with delta = 0.013. The 95% CI was (0.007, 0.018). It is worth noting that the criterion validity referred to the correlation between the latent variable (CS) and the specified criterion (PD/IN; Raykov et al., 2016). Therefore, the validity coefficients could reflect the correlation without the interference of measurement errors.
Discussion and Conclusion
The present article was primarily concerned with the application of maximal reliability and maximal criterion validity in realistic settings. With this in mind, we identified the OLC of a measure and estimated the differences between maximal reliability and composite reliability and between maximal criterion validity and scale criterion validity. Little empirical research has been conducted on maximal reliability, and none has been conducted on maximal criterion validity. Although the difference between composite reliability and maximal reliability and between scale criterion validity and maximal criterion validity may be rather small numerically (0.010-0.037 in our study), it is worth noting that we used a measure that is established and has been tested repeatedly. The present study provided evidence that the OLC can improve reliability and validity even when composite reliability and scale criterion validity are already sufficiently high. It is not difficult to imagine that the OLC would be more useful when it is necessary to improve the quality of a measure that has unsatisfactory composite reliability, especially when the composite reliability is just below the criterion (e.g., when composite reliability is slightly lower than the acceptable threshold, 0.7).
Moreover, we identified the OLC of CS indicators in order to furnish maximal reliability and maximal criterion validity. We emphasized that the linear combination of the total score obtained from Equation (7) has maximal reliability with regard to any other linear combinations and maximal criterion validity with regard to any external criterion. This feature of the resulting optimal composite score is particularly important in empirical research, especially when the reliability and criterion-related validity are lower than expected during measure development and structure confirmation. Until proven otherwise, the OLC and the resulting maximal reliability and maximal criterion validity provide an effective way to improve the quality of a measure. This improved estimation with the OLC is due to its feature of accounting for individual variance from item specificity, which is treated as part of the true score variance rather than as part of the error variance, as done in routine factor analysis applications for reliability estimation (Raykov, Marcoulides, & Gabler, 2017).
The use of weighted item scores can minimize the effect of measurement errors on the total score and render total scores more accurate. During the scale construction process, it is common to find that the factor loadings are not the same for each item. Some items may have high loading with small error variance, while other items may have low loading with large error variance. It is reasonable to wonder why we should simply add these item scores even though they contribute differently to the measure under construction. Under these circumstances, weighting item scores make perfect sense, as it fairly reflects the contribution of each item when adding them together.
The accuracy of the weighted total score is reflected in the improvement of the reliability coefficient. The homogeneity reliability and composite reliability are the same for congeneric measures, and item scores can be added together only when the homogeneity reliability, or the composite reliability for congeneric measures, is sufficiently high (Gu, Wen, & Fan, 2017; Rodriguez, Reise, & Haviland, 2015). The fact that the maximal reliability is higher than the composite reliability indicates that the items are more converged, according to the latent construct, by weighting each item. In the meantime, the maximal criterion validity indicates that the OLC exhibits the strongest relationship with an external criterion. If we use the OLC in the context of linear regression, the effect size (
Although the concepts of the OLC and weighted scores may seem unconventional, the parameters can easily be obtained using the popular software Mplus (Muthén & Muthén, 1998-2015). The Mplus codes employed in the present article for the estimation of the weights in the OLC of the CS indicators, maximal reliability, maximal criterion validity, and their confidence intervals, are provided in Appendixes A and B. These codes can be used in a straightforward manner in empirical research aimed at improving the construct of a measure.
In conclusion, this article provided empirical evidence that maximal reliability and maximal criterion validity are useful for improving measurement quality. The OLC, which results in the maximal reliability and maximal criterion validity, is a readily and widely applicable methodology that can significantly help researchers, especially empirical researchers, to improve the efficacy of assessments based on congeneric measuring instruments.
Footnotes
Appendix A
Appendix B
Declaration of Conflicting Interests
The author(s) declared no potential conflicts of interest with respect to the research, authorship, and/or publication of this article.
Funding
The author(s) disclosed receipt of the following financial support for the research, authorship, and/or publication of this article: This work was supported by grants from the National Natural Science Foundation of China (31771245, 31400909).