
Abstract
Subscore reporting under item response theory models has always been a challenge partly because the test length of each subdomain is limited for precisely locating individuals on multiple continua. Diagnostic classification models (DCMs), providing a pass/fail decision and associated probability of pass on each subdomain, are promising alternatives for subscore reporting. However, it may not be appropriate to provide those binary decisions or probabilities to examinees when (1) an overall score is provided with a pass/fail decision from standard-setting procedures or (2) absolute decisions or probabilities are not the purpose of providing subscores. To satisfy such score reporting scenarios, this article introduces the relative diagnostic profile (RDP), a framework using DCMs to score item responses but withholding absolute decisions and probabilities. In the RDP framework, a person’s overall ability is a pie, where stronger subdomains are bigger slices. Beyond the within-individual information, this framework can also be used to compare a person’s relative strengths to those of a chosen group of examinees.
Keywords
Providing individuals with performance reports on subdomains in addition to a global score is gaining popularity in educational and psychological assessments. This type of report provides individuals with information on their strengths and weaknesses in smaller subcontent areas. For example, although the National Council Licensure Examination® (NCLEX) is designed to provide a single pass/fail decision to determine whether an examinee has the minimum competency to be an entry-level nurse, each failing examinee is also provided with a performance report laying out whether the examinee is above, near or below the passing standard on each of the eight subdomains (National Council of State Boards of Nursing, 2017). Similarly, although the United States Medical Licensing Examination® (USMLE) provides a single pass/fail decision to determine whether an examinee has the minimum competency to be an entry-level physician, performance bands are also provided to all examinees on smaller subdomains in each Step test (National Board of Medical Examiners, 2017). Reporting subscores can inform examinees about their knowledge, skills, and abilities in subdomains, if the subscores have added value and satisfactory reliability. However, as consistently discussed in Haberman (2008), Sinharay (2010, 2013, 2014), Sinharay and Haberman (2008), Sinharay, Puhan, and Haberman (2011), subdomain reports often cannot provide reliable estimates because the test length is not long enough for each subdomain and multiple sources of error are introduced. As a result, instead of giving a definite score, those reports often offer a general idea of the relationship between an examinee’s performance on the subdomains and the global passing standards.
Recently, diagnostic classification models (DCMs), a newer class of models built for the classification purposes, have been proposed as a way to report subscores (Liu, Huggins-Manley, & Bulut, 2018; Rupp, Templin, & Henson, 2010; Sinharay et al., 2011). Instead of offering continuous scores, DCMs deliver a pass/fail decision with a probability of a pass on each subdomain for each individual. Through different parameterization from item response theory (IRT) models, DCMs trade the ability to precisely locate and rank examinees on one continuum representing one domain for the ability to roughly classify examinees into categories (e.g., pass or fail) on multiple subdomains.
It is noteworthy that DCMs cannot remedy the reliability decrease resulting from the decreased test length on each subdomain. If, as previous studies (e.g., Templin & Bradshaw, 2013) have shown that DCMs produce higher reliability than IRT scoring approaches for the same test length, it is simply because the definition and computation of DCM reliability are different from those of other psychometric models. DCM reliability in Templin and Bradshaw (2013) is uniquely defined as a function of the tetrachoric correlation between two categories. This definition designed for categorical latent traits is different from other types of reliability based on true and error variance estimations. In general, as a property of test scores, reliability can be defined accordingly when scoring models differ. For example, the information estimate is commonly used to represent reliability under IRT models, the generalizability coefficient is used in generalizability theory methods, and the omega coefficient is used for suggesting reliability under factor analysis based approaches. Even using the same scoring approach, reliability can also be defined in multiple ways. For example, the split-half reliability can be used for a single administration and the test-retest reliability can be used for two administrations. In sum, DCMs are promising subscore approaches partly because latent traits are considered categorical and the range of latent trait estimates are smaller than that of IRT models, as shown in Templin and Bradshaw (2013).
Liu et al. (2017) proposed a framework of fitting DCMs to current unidimensional tests to obtain diagnostic information and demonstrated the utility of such practice. For licensure tests, DCMs may be especially useful because (1) multiple subdomains are built into the tests and (2) the ultimate purpose of licensure tests is to provide pass/fail classifications. Traditionally, to fulfill this purpose, standard setting is used to determine cut-score locations (Cizek, 2006). Fitting DCMs to classify individuals differs from the traditional standard setting approach in several ways. Traditional standard setting is a strong theoretical approach that uses expert judgments to determine the cut-scores. It is also considered as a follow-up step after examinees are scored. In contrast, fitting DCMs is a strong statistical approach that uses item responses to determine the probability of a pass. It is also a one-step approach where scoring and classification are handled at the same time. As a result, classification errors may be reduced as compared to the two-step standard setting approach (Robitzsch, Kiefer, George, & Uenlue, 2017). We recognize the challenges and opportunities including dimensionality issues of fitting DCMs to unidimensional tests, and we point readers to Liu et al. (2017) for a full discussion. For this study, we focus on score reporting issues using DCMs.
Although DCMs seem to be promising alternatives for offering pass/fail decisions on multiple subdomains, at least three critical issues need to be addressed for some reporting scenarios.
First, how to explain the relationship between the overall pass/fail and the pass/fail in subdomains, when both pieces of information are provided? Most often, examinees are given the overall pass/fail decisions through the two-step approach mentioned in the previous paragraph: (1) being scaled under item response theory (IRT) models and (2) comparing examinee scores to a cut-score obtained through standard-setting. If pass/fail decisions are provided in subdomains using DCMs, it is possible that (1) an examinee given an overall pass is classified as fail in some or all subdomains because the standard-setting cut-score is set to be low, (2) an examinee given an overall fail is classified as pass in some or all subdomains because the standard-setting cut-score is set to be high, and (3) an examinee given an overall pass has the same number of or even more failed subdomains than an examinee given an overall fail because the two examinees are close to the standard-setting cut-score. These discordant scenarios may happen because the overall classification and subdomain classifications come from different scoring and classification approaches. When presenting both pieces of information at the same time, end users may be confused about the inconsistency.
Second, how should examinees use the subdomain decisions? In some large-scale licensure tests, the purpose of the subdomain report is to help examinees identify where they need to spend time on learning in order to get an overall pass. If an examinee, Mia, gets an overall fail and a pass on one subdomain, it does not necessarily mean that she should not spend time on that passed subdomain anymore. The reason is that (1) getting even higher score on the passed subdomain will still increase Mia’s overall score and help her pass the test and (2) examinees who get an overall pass may have an average higher probability of a pass on the subdomain than Mia, which means that this subdomain is still her relative weakness comparing to the passing examinees. Similarly, if Mia gets a fail on one subdomain, this subdomain may be difficult in nature and many examinees getting an overall pass fail on this subdomain. Without referencing to the performance of other people, the probability of a pass on the subdomains may not be fully useful to an individual.
Third, how to report examinees who are close to the .5 probability of a pass? Current research tends to agree that “undecided” should be given to those examinees because there is not enough information about them (e.g., Rupp et al., 2010). When it comes back to fulfilling the learning purpose, if Mia gets “undecided” on all subdomains, she will still struggle to figure out in which subdomain more time should be spent on. Therefore, this diagnostic report does not provide much help.
The above three issues are less about how DCMs as psychometric models can be refined to produce more accurate and reliable subscores. Instead, these issues are more about how we can report the DCM subscores in a defendable and useful way. The purpose of this study is to propose the relative diagnostic profile (RDP) framework for DCM subscore reporting. Under this framework, each examinee gets a pie representing his/her overall ability. Each pie is sliced into different portions based on the individual’s relative strength on each subdomain. Rather than giving examinees an absolute probability of a pass on each subdomain, this RDP framework offers a relative profile of strengths and weaknesses of an individual and his or her distance to the group of interest (e.g., passing examinees or the overall population). This framework addresses the above three issues by partitioning an individual’s relative strength within his or her overall ability regardless of where the individual is on the overall ability scale. In this way, each failing examinee has relative strengths and each passing examinee has relative weaknesses. Therefore, the RDP framework can better support individual learning and satisfy reporting requirements. However, this framework should not be seen as a replacement of current ways of DCM reporting. Instead, it is an alternative that can be more useful under certain reporting scenarios.
In the next section, theoretical backgrounds of DCMs are briefly discussed. Then, the RDP framework is illustrated. Next, we demonstrate how to incorporate the RDP framework into a current operational practice. The article concludes with a discussion of practical considerations.
Theoretical Background: Diagnostic Classification Models
DCMs are a class of multidimensional confirmatory latent class models (Templin & Hoffman, 2013). Those models differ from IRT models mainly because (1) examinees’ latent scores are categorical (e.g., 0 and 1) rather than continuous and (2) item–trait relationships are prespecified. The information about which items measure which latent traits is captured in an item-by-attribute incidence matrix often known as a Q-matrix (Tatsuoka, 1983). Table 1 is an example Q-matrix. In DCMs, latent traits are often called attributes and denoted by

if item i measures a single attribute
An Example Q-Matrix.

if item i measures both
The primary outcome of DCMs is examinees’ attribute profiles. For example, examinees have mastered
Relative Diagnostic Profile Framework
The RDP offers a flexible post hoc framework based on current DCMs for useful subscore reporting. Before applying this framework, attributes of interest should be identified, and at least one DCM should have been fitted to the item responses. The RDP framework does not have requirements on the number of attributes or the type of DCMs, as long as fit statistics and reliability are satisfactory.
After individual attribute profiles are produced, the RDP framework can be implemented as a reporting approach that partitions a person’s overall ability into bigger or smaller parts according to his or her relative strengths among each subdomain. Suppose Mia gets an overall score of

Example three types of subscore report for Mia.
To produce an RDP report, the following four steps are involved:
identifying one or more informative reference group(s)
computing the marginal probability of a pass for an individual and the mean marginal probability of a pass for the reference group on each attribute
computing an individual’s relative proportion of strength for each attribute
producing and interpreting an RDP report.
Step 1: Identifying One or More Informative Reference Group(s)
Continuing Mia’s example, if a reference group is not selected, Mia’s relative strengths are the areas that she has mastered relatively more knowledge in. In other words, we only take into account her absolute probability of a pass on each attribute, decide which number is higher and present the numbers by making it relative to other attributes. If no reference group is selected, the benefit of using the RDP framework is to avoid reporting an absolute probability and address the first and third challenges of directly using the DCM score report.
Beyond providing within-individual information, one or more informative reference group(s) could be selected to address the second challenge of using DCM score report. For example, one could compare Mia to the examinees at the pass/fail cut-point. In this case we are asking “what are Mia’s relative strengths in terms of the distance to the examinees having minimum competency?” Attributes that have a higher probability of mastery for this group may be easier to master than attributes that have a lower probability of mastery. For another example, one could also compare Mia to the examinees who get an overall pass or all the examinees to help Mia understand her relative strengths when compared with those groups.
Step 2: Computing the Marginal Probability of a Pass for an Individual and the Mean Marginal Probability of a Pass for the Reference Group on Each Attribute
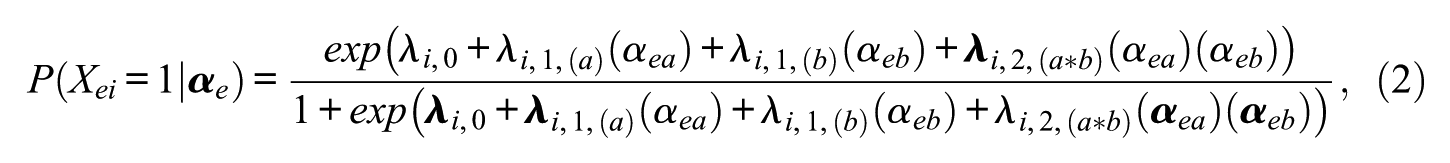
Many statistical programs such as the “CDM” R package (Robitzsch et al., 2017) and the “GDINA” R package (Ma & de la Torre, 2017) can be used to easily obtain individual marginal attribute passing probability. The marginal passing probability for

where

where
Step 3: Computing an Individual’s Relative Proportion of Strength for Each Attribute
No matter whether a reference group is selected, it is always helpful to present an examinee’s own relative strengths without comparing to another group. The relative proportion of attribute a’s contribution to examinee e’s ability can be computed as

If a reference group is selected, three smaller steps are involved. Suppose the reference group is all the passing examinees, Figure 2 provides an example of how to obtain the relative proportion of strength for examinee e on attribute a in terms of the distance to group G:

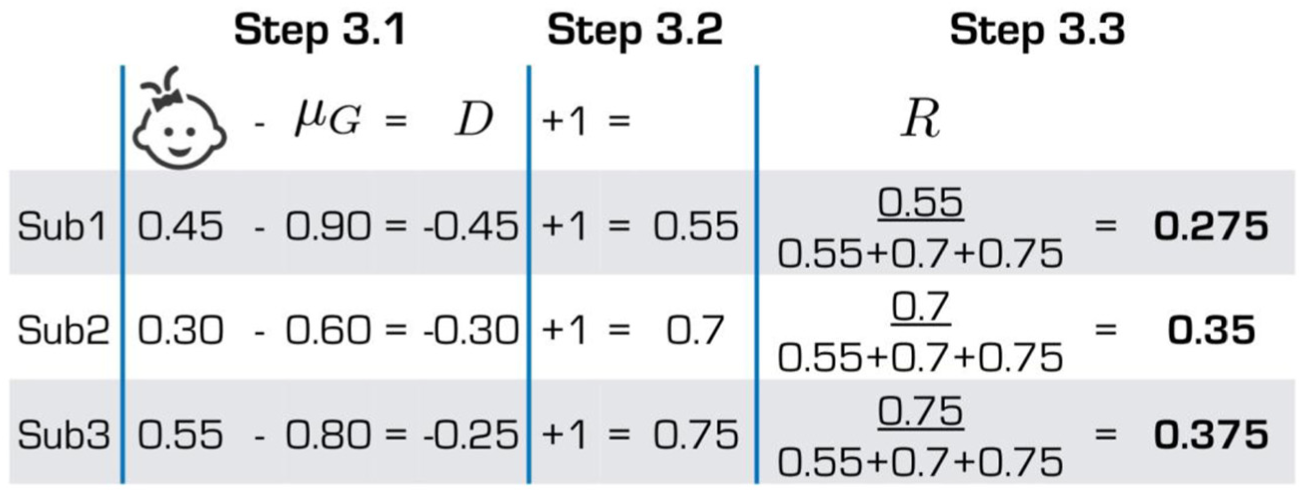
A computation example for Step 3.
If the 95% confidence interval is computed in Step 2, it can be carried over to this step to compute a similar confidence interval for
Step 4: Produce and Interpret an RDP Report
Figure 3 presents Mia’s RDP report based on the example used in Step 3. After working with different visualization techniques such as pie charts, line charts and radar charts, we considered the stacked bar chart a succinct and simple way to present an individual’s RDP. Each bar is divided into chunks of different sizes representing the individual’s relative strengths. We suggest using percentage instead of numbers between 0 and 1 to help end users get rid of the probability scale. In Figure 3, the top bar is Mia’s RDP without comparing with other people. A larger number in the top bar means that she has mastered more knowledge in that domain than a domain with a small number. Therefore, Subdomain 3 is her relative strength (contributing 44% to her ability) and Subdomain 2 is her relative weakness (contributing 19% to her ability). The bottom bar is her RDP in terms of the distance to the passing group. A larger number in the bottom bar means that Mia is closer to or even better than the passing group than the other two domains in terms of the distance to the passing group, while a smaller number means that Mia is relatively weaker in that domain. In Figure 3, without comparing to the passing group, Subdomain 1 contributes 37% to her ability, but the number reduces to 27.5% when comparing with the passing group. This means that although she has mastered more knowledge in Subdomain 1 than other two subdomains, the distance between her and the passing group in Subdomain 1 is relatively larger than the other two subdomains. She may still want to spend time on Subdomain 1 even though it is not her weakest area. Conversely, for Subdomain 2, she has mastered relatively less knowledge, as the top bar shows, but its contribution to her ability rises to 35% when comparing with the passing group. This means that the Subdomain 2 is a challenging domain because the distance between her and the passing group in this subdomain is relatively smaller than the other two subdomains. She should realize that much more time needs to be spent here if she wants to improve on Subdomain 2. For Subdomain 3, she has mastered the most knowledge and this is her strongest area because her distance to the passing group is shorter.
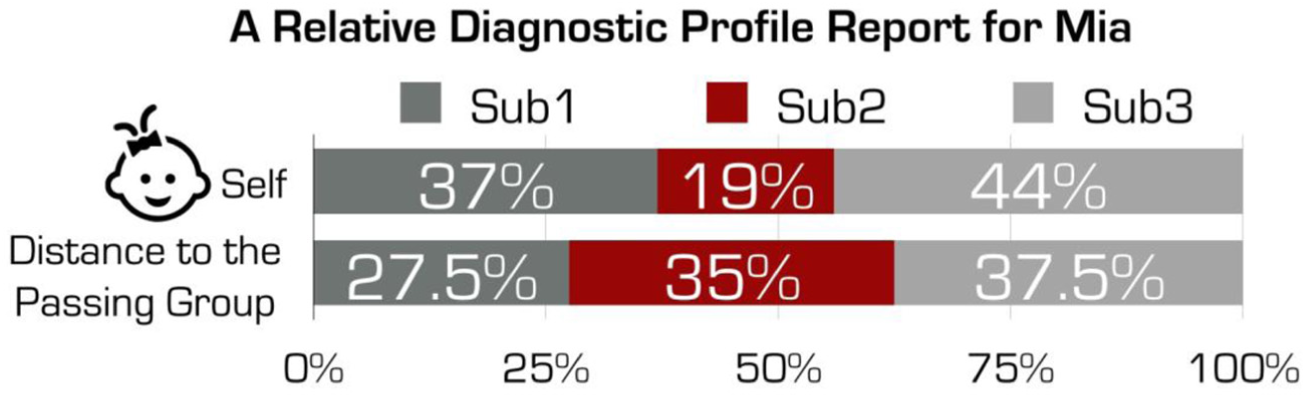
A relative diagnostic profile (RDP) report for Mia.
It may be tempting to directly compare an examinee’s relative proportion of strength with the mean of a group, but this usually provides misleading information. For example, an overall poor performing examine has a .2 probability of a pass on one subdomain but it is her strongest domain. Under the relative proportion, this subdomain may contribute more than 50% to her ability. On the other hand, for a passing examinee, a weaker domain contributing 30% to their abilities may be associated with a .5 probability of a pass. Therefore, one should not directly compare the relative proportions between two examinees or between an examinee and a group because the relative proportions are not on the same scale.
From the example above, it should be clear that the RDP framework is designed to offer relative information and thus does not provide absolute decisions. Therefore, for licensure/certification tests, it is necessary to provide examinees RDP reports alongside the overall score so that examinees know how far away they are from the overall passing standard and can use the RDP report as a next step to explore their relative strengths and weaknesses. To conclude, we are not advocating RDP as a replacement of current score reporting practices; instead, it can be useful as an add-on to the overall score.
An Empirical Example
This section uses an operational test to demonstrate the use of RDP in a real setting. Before employing the RDP framework, a DCM should be fitted to the item responses. We adopted the four steps in the Liu et al. (2017) framework to retrofit a DCM to scored responses on a test. The four steps are (1) gathering information, (2) specifying attributes and the item–attribute relationship, (3) fitting DCMs and evaluating fit, and (4) producing and interpreting results. Among the four steps, the fourth step “producing and interpreting the report” was where we implemented the RDP framework.
Step 1: Gathering Information
We used a dataset from a national large-scale high-stakes test in the medical licensure field. Each form on the test consists of 70 multiple-choice items, including 10 unscored pretest items. Examinees that get 47 or higher are given a pass. The dataset we used includes 8,940 examinees’ responses to 60 scored operational items on one form. Figure 4 shows a histogram of the score distribution. The histogram shows that 8,418 (i.e., 91%) examinees passed the exam and only 9% failed. We expected that most examinees should have a high probability of a pass on each subdomain. The purpose of producing RDP reports is to help examinees who failed with future learning.

Score distribution of the dataset.
Step 2: Specifying Attributes and the Item–Attribute Relationship
The test plan outlines 9 subdomains for the 60 items. This test length may not be sufficient for a reliable estimate of 9 attributes under DCMs, and some smaller domains only have 2 items. Based on discussions with content experts, we decided to combine a few smaller domains into one big domain. Our final decision was 5 domains, measured by 9, 23, 5, 8, and 15 items, respectively. Each domain was specified as an attribute in the Q-matrix in order to fit a DCM. All 60 items are simple-structure items, which means that each item only measures one attribute.
Step 3: Fitting DCMs and Evaluating Fit
When each item only measures one attribute, DCMs that are subsumed under the LCDM are all equivalent to the LCDM. Therefore, the LCDM was fitted to the dataset. Model fit was evaluated by the standardized root mean square root of squared residuals (SRMSR; Maydeu-Olivares & Joe, 2014), and the result was 0.49 showing good fit. The DCM reliability (Templin & Bradshaw, 2013) was 0.80. Given that the model fitted adequately and the reliability was acceptable, we moved on to Step 4 to implement the RDP framework.
Step 4: Implementing the RDP Framework
We chose an examinee and named her Kati for the ease of the presentation. Kati was a failure examinee who got 46. She was provided with an RDP report to help her with future learning. Three reference groups were selected: minimum passer (i.e., examinees at the pass–fail cut-point), passing examinees and all examinees. The sample sizes for each of the three groups are 119, 8,148 and 8,418, respectively. The mean probability of a pass on each subdomain for each group and Kati’s probability of a pass on each subdomain are presented in Figure 5. The top line in Figure 5 describes the passing examinees and the second line from the top portrays all examinees. The former was around 0.92 and the latter was around 0.85. Both of them were high and balanced on each attribute. Between the two bottom lines, the solid line denotes minimum passers and the dashed line is Kati. For the solid line, the probability of a pass on each subdomain for minimum passers (i.e., those who scored 47) were much lower than .5. As reviewed above, the standard setting and DCM classification of pass/fail are two different approaches and they may not agree with each other. For the dashed line, Kati’s probability of a pass went up and down around the minimum passer’s probability because she got 46, one point below the cutoff score. Based on Figure 5, an RDP report for Kati was produced in Figure 6.

Average probability of a pass on each subdomain for each reference group.
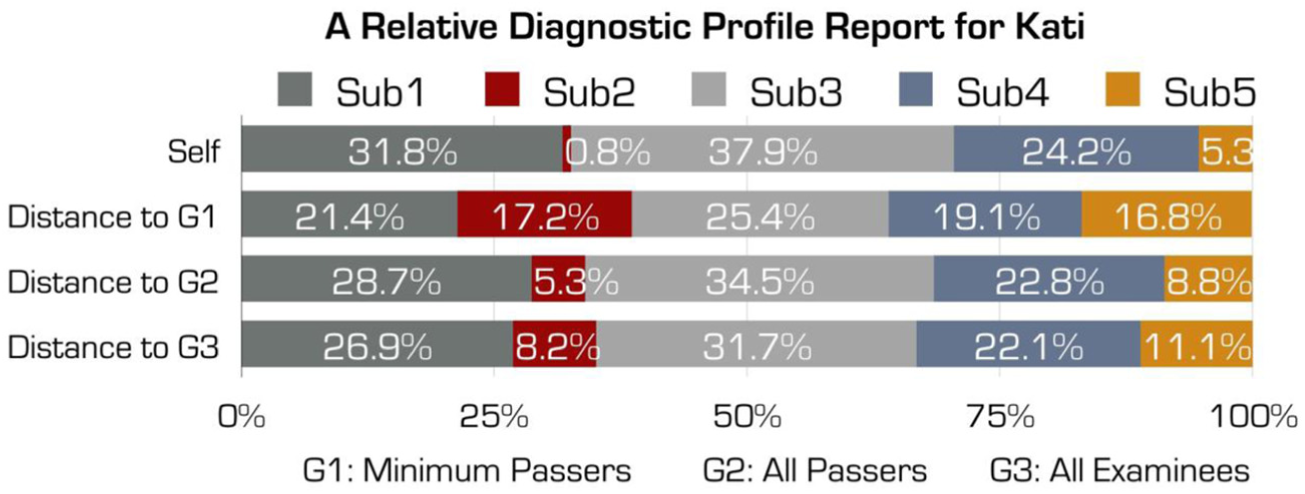
A relative diagnostic profile (RDP) report for Kati.
The interpretation of Figure 6 can be organized as follows. Without comparing with other groups (the “self” bar), Subdomains 1 and 3 were Kati’s relative strengths, and Subdomains 2 and 5 were her relative weaknesses. This shows that she had mastered more knowledge and skills in 1 and 3 than 2 and 5. In terms of the distance to minimum passers (the “distance to G1” bar), Kati’s performance on the five domains was relatively balanced. This means that her skill composite was very similar to the minimum passers. Most notably, the contribution from Subdomains 2 and 5 increases, meaning that the minimum passers also found these two domains challenging and had a lower probability of a pass on each of these two domains. In terms of the distance to all passers (the “distance to G2” bar) and all examinees (the “distance to G3” bar), Kati’s ability composite was very similar to the “self” bar. This should be expected from Figure 5 because the probability of a pass on each domain for the two groups are similar. From these two bars, Kati would know that all examinees and passing examinees did well in Subdomains 2 and 5 and their performance on each subdomain was relatively balanced.
In this example, we incorporated three reference groups in the RDP report. This may not be necessary for other score reporting practices. Selecting one or two informative reference group(s) may suffice depending on the purpose of the report and characteristics of the test scores.
Discussion
In this section, we discuss the following three issues around the RDP reporting framework: (1) possible uses, (2) limitations, and (3) relationship with the overall score.
Possible Uses
We centered our argument on licensure/certification tests because the idea of the RDP originates from how to provide more useful information to examinees who failed such tests. However, the RDP can be applied to any assessment where DCMs can be fitted. For example, the RDP may be an option for some classroom formative assessments. Providing each student with an RDP report that incorporates the individual’s own relative strengths and weaknesses not only gives the individual enough information for personal learning but also avoids offering absolute decisions of mastery/nonmastery. To summarize, RDP is a reporting framework with two prominent features. First, it provides useful diagnostic information and satisfies some reporting requirements through withholding absolute decisions. Second, “undecided” is no longer needed for reporting a probability close to .5 and every individual can receive information about his or her relative strengths and weaknesses.
Limitations
The RDP framework has at least two limitations. First, it does not offer absolute comparisons because each examinee is designed to be on his or her own scale. For tests that provide an overall score, this limitation may be overcome by offering overall scores. For tests that were originally developed under the DCM framework, the purpose of the test should drive the reporting decisions. If the purpose of the test is to provide absolute classifications, the traditional DCM reporting is more helpful than the RDP framework. Second, similar to any subscore reporting framework, subscores need to have some variations among the subdomains in order to be considered useful and informative beyond the overall score. For example, if a failing examinee gets the same probability of pass on each of the five subdomains, their RDP profile will be 20% on each subdomain. This RDP is not useful for them to identify strengths and weaknesses. We recommend using profile analysis to assess the added value of subscores (e.g., Davison, Davenport, Chang, Vue, & Su, 2015) and estimate the between-person and within-person subscore reliability (Bulut, Davison, & Rodriguez, 2017).
Relationship With the Overall Score
The RDP framework avoids stepping into the relationship between the pass/fail decisions from DCMs and the overall pass/fail decisions from the combination of overall score and standard settings. However, examining such relationships may be helpful for future test development. For the dataset we used, the relationship between the overall score and subdomain probability of a pass for examinees around the cut-score is presented in Figure 7. The pass/fail cut-score is at 47 under the standard setting and is at .5 probability under DCMs. DCMs show that examinees who scored higher than 49 had close to or higher than .5 probability of a pass on most attributes. This information could be used in future standard setting procedures to discuss the current cutoff and target item difficulty. Alternatively, one could also adopt the diagnostic profile standard setting method (Skaggs, Hein, & Wilkins, 2016) to determine the relationship between attribute profiles and the overall pass/fail standard.

Relationship between the overall score and subdomain probability of a pass for examinees around the cut-score.
Conclusion
The RDP framework uses DCMs to provide diagnostic feedback to individuals on multiple subdomains. It is designed to satisfy reporting requirements when the probability of pass on each subdomain cannot be directly provided to examinees. Before closing this article, we want to affirm that developing a test under the diagnostic measurement framework provides higher quality RDP reports than retrofitting DCMs to current unidimensional tests. This dimensionality conundrum has been discussed in articles such as Liu et al. (2017) and Sinharay et al. (2011). For tests that have complex structure items (i.e., items measuring more than one attribute), fitting DCMs may be more likely to produce unstable estimates because of the high correlations among attributes. However, for tests that only have simple-structure items (i.e., each item only measures one attribute), the use of the Q-matrix and the structure of DCMs should help alleviate some of the dimensionality concerns. Despite that, we hope that introducing the RDP framework to current score reporting practices opens new doors for providing examinees with useful subscores.
Footnotes
Declaration of Conflicting Interests
The author(s) declared no potential conflicts of interest with respect to the research, authorship, and/or publication of this article.
Funding
The author(s) received no financial support for the research, authorship, and/or publication of this article.