
Abstract
One of the most cited methodological issues is with the response format, which is traditionally a single-response Likert response format. Therefore, our study aims to elucidate and illustrate an alternative response format and analytic technique, Thurstonian item response theory (IRT), for analyzing data from surveys using an alternate response format, the forced-choice format. Specifically, we strove to give a thorough introduction of Thurstonian IRT at a more elementary level than previous publications in order to widen the possible audience. This article presents analyses and comparison of two versions of a self-report scale, one version using a single-response format and the other using a forced-choice format. Drawing from lessons learned from our study and literature, we present a number of recommendations for conducting research using the forced-choice format and Thurstonian IRT, as well as suggested avenues for future research.
Keywords
Likert-type response formats are one of the most recognized formats for survey research (DeVellis, 2012; Pajares, 1996; Wetzel, Böhnke, & Brown, 2016). The Likert-type response format is an example of a single-response format, where items are presented one at a time to respondents or all at once in a grid using the same response format options (e.g., Not certain at all to Very certain). Unfortunately, studies regularly show that many participants exhibit a response bias when a single-response format is used (Wetzel et al., 2016). Response biases include acquiescence (Bartram, 2007; Chan, 2003), extreme responding (Cheung & Chan, 2002), social desirability responding (Christiansen, Burns, & Montgomery, 2005; Paulhus, 2002), and systematic score inflation (Baron, 1996) and always result in systematic, construct irrelevant variance (Crowne & Marlowe, 1960).
One possibility for ameliorating many of the problems present with the single-response format is to present items in a way that forces participants to choose between similarly attractive options (Brown, 2010). Two examples of forced-choice formats are pairwise comparison and ranking data. In pairwise comparison, participants must make a choice between at least two items which “result in response options equated in terms of perceived attractiveness so that respondents cannot simply describe themselves more favorably in an effort to create a positive impression” (Christiansen et al., 2005, p. 268). In a ranking format, participants are asked to sort a number of items in order from most favorable to least favorable. For analysis purposes, these rankings are recoded as a set of pairwise comparisons, one for each pair of items in the ranking set, so that ranking tasks can also be interpreted as a series of pairwise comparisons. According to Christiansen et al. (2005), this response format demonstrated early promise, but popularity declined throughout the 1970s and is currently not used frequently in commercial personality inventories or attitudinal instruments. Meade (2004) describes a number of reasons for this decline, including a growing awareness in the 1990s that traditional factor analysis of ipsative data yields incorrect and uninterpretable correlations between factors and that score reliability of traditionally scored forced choice data is generally substantially lower than reliability of a similar length Likert-type scale. Brown and Maydeu-Olivares (2013) additionally suggest that the difficulties in forced-choice instrument development may be partially responsible for their lack of popularity.
Maydeu-Olivares and Brown (2010) presented a model called Thurstonian item response theory (IRT) for analyzing forced-choice data, which overcomes many of the psychometric problems associated with ipsative data and suggest that using a comparative or forced-choice format can help reduce the impact of response bias and social desirability. The purpose of this study was to compare the psychometric properties of two formats (i.e., single response format and forced choice format) on the Teacher Self-Efficacy for Autism Scale (TSEAS; Love, Toland, Usher, Campbell, & Spriggs, 2017) and unfold the process we used for analyzing the forced choice format within the Mplus (Muthén & Muthén, 1998-2015) environment. Results will inform future researchers on an alternative response format method that may address common problems with response bias.
Thurstonian Item Responds Theory Model
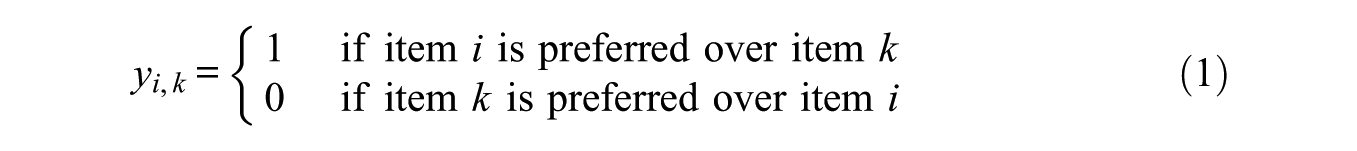
For the purpose of this article, the unidimensional case of the Thurstonian IRT model is described, following and simplifying the explanation given by Maydeu-Olivares and Brown (2010). In the forced-choice format, participants are asked to choose between two items based on which is more favorable. Making this choice is referred to as the response process for the comparison item and this choice creates a dichotomy, expressed as
According to Thurstone’s law of comparative judgment (1927, 1931), when a participant makes a judgment for the preferred choice, the choice reflects the item for which the participant has the greatest amount of preference. The amount of preference a participant has for an item is latent and is referred to as the latent utility of the item. The judgment between two items can therefore be expressed as

where the latent utility of item i is introduced and written ti.
Each latent utility is linearly determined by the underlying latent trait expressed as

Equation (3) defines a factor model in which the latent trait η predicts the latent item utility ti. In this model, μi is the intercept, or mean of the latent utility of item i. In addition, λi is the slope, or factor loading of the latent utility of item i with regard to the underlying latent trait η. Finally, εi is the residual term for item i.
Since

where yi,k is 1 if
Using Equation (3) to substitute for the latent utilities in Equation (4), the latent forced-choice response is given by

Equation (5) describes a second-order factor model, which is graphically represented for a single ranking triplet in Figure 1. Whereas the focus of Equation (5) is on the parameters for the latent item utilities, IRT modeling of forced-choice data focuses not on individual items, but rather on the comparison. In order to switch focus from the items which are compared to the comparisons themselves, set

The reason that the difference in item utility means is defined as –τ is that when software programs such as Mplus estimate this model, thresholds are displayed in the output, not intercepts.
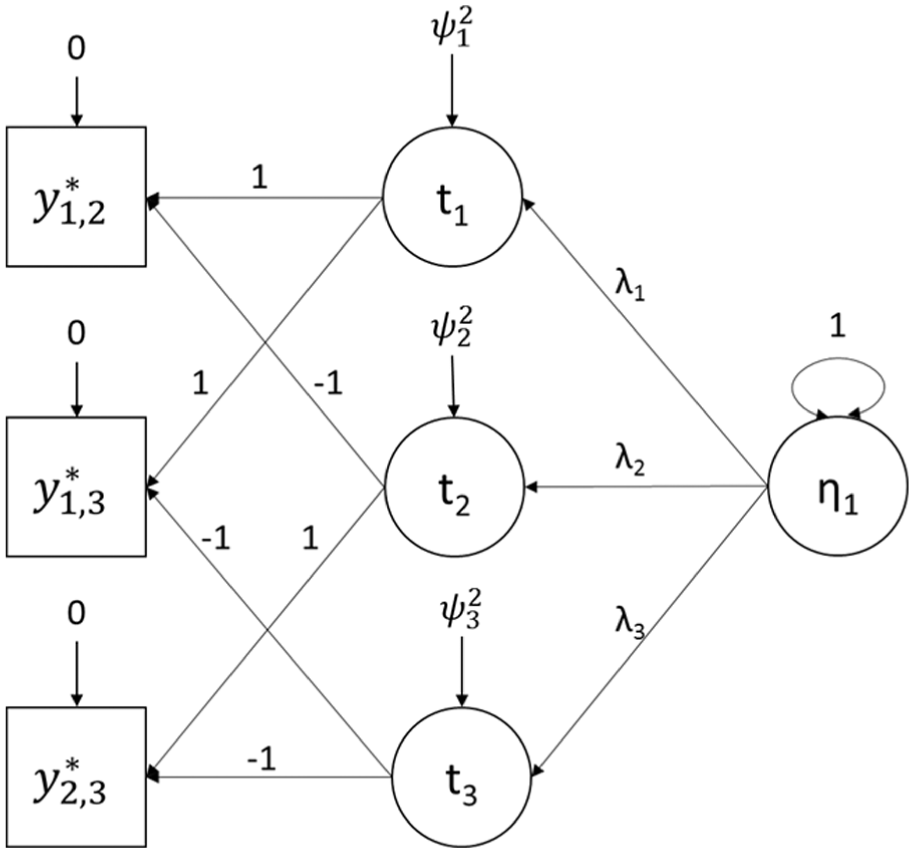
Conceptual diagram of the unidimensional Thurstonian factor model for ranking triplet, adapted from figure 1 of Brown and Maydeu-Olivares (2011). η1 = latent trait; λi = factor loading; ti = latent item utility;
The model in Equation (6) is referred to as the restricted thresholds model because the threshold
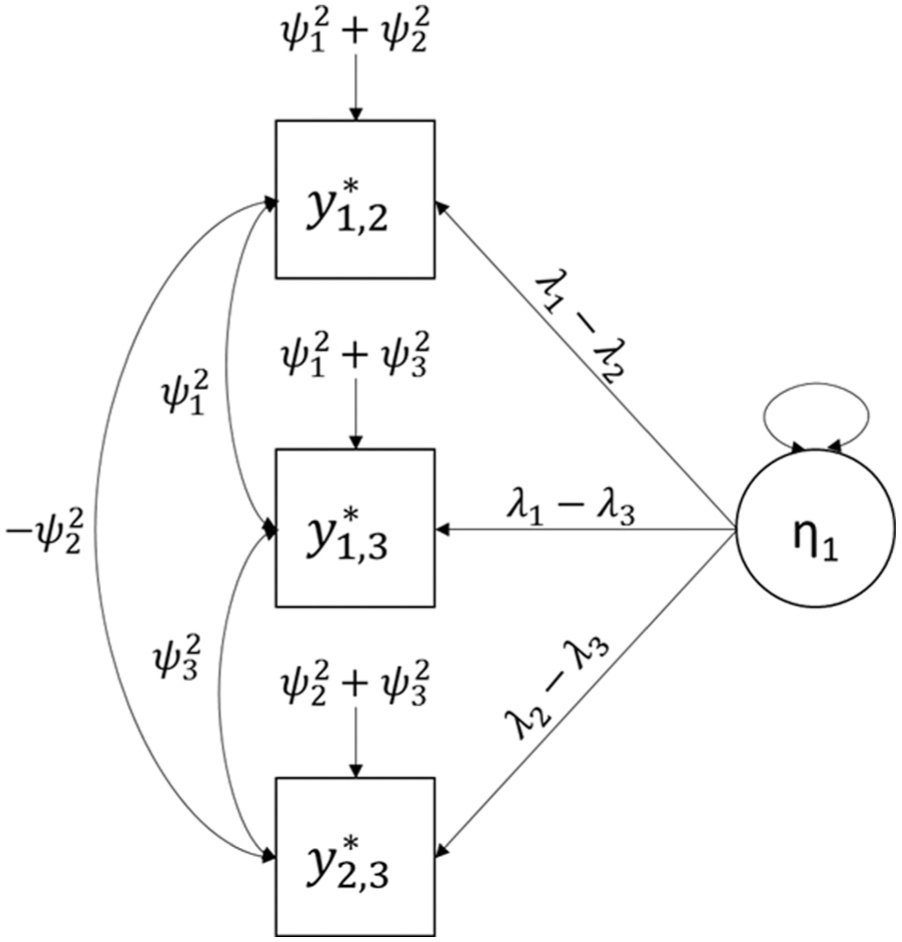
Conceptual diagram of the unidimensional Thurstonian item response theory (IRT) model for ranking triplet, adapted from figure 2 of Brown and Maydeu-Olivares (2011). η1 = latent trait; λi = factor loading;
Equivalence of Factor and IRT Models
The factor model presented in Equation (6) is equivalent to an IRT model with a probit link. Specifically, recalling that yi,k is 1 if y*i,k is greater than or equal to 0, Equation (6) can be rewritten as follows:

Noting that
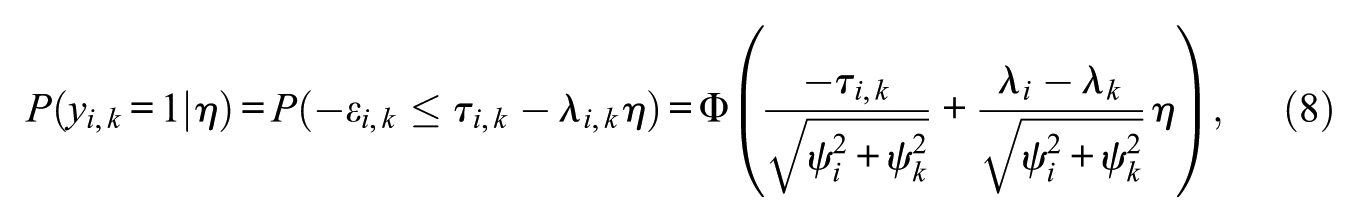
where Φ is the standard cumulative normal density function. If the discrimination (α) of the comparison of items i and k is of interest, it can be computed as the following ratio:

Because the discrimination is proportional to a difference of factor loadings, it is possible for a comparison discrimination to be zero. Therefore, item locations may not always be defined, and it is recommended to instead focus on item thresholds, which we do in our study. However, if the location (δ) of the comparison of items i and k is of interest, it can be computed in the usual way as the opposite of the ratio of the intercept and discrimination parameters given in Equation (8) as follows:

Using Mplus for Thurstonian IRT Models
Syntax for estimating Thurstonian IRT models is complicated by several factors. First, the loadings of the comparisons onto the latent trait are constrained to be the difference of the loadings of the latent item utilities onto the latent trait, per Equations (5) and (6) and Figure 2. These constraints can be accomplished using the “Model Constraint” feature of Mplus by creating new variables for the loadings of the latent item utilities. If the model is multidimensional so that each item in an individual ranking task loads onto a different factor, then no constraints are required on the loadings beyond ensuring that each time an item appears in a comparison, that comparison has the same loading on the latent trait which that item is measuring (see figure 2 of Brown & Maydeu-Olivares, 2011). If a restricted thresholds model is desired, applying those restrictions is handled almost identically to the restrictions on the comparison loadings.
The second complication is that the residual variances of the comparisons in the Thurstonian IRT model are correlated. As an example, consider the latent forced-choice responses


Since
When choosing an estimator for Thurstonian IRT models, the ipsativity of ranking data requires that limited information estimation functions must be used (Maydeu-Olivares & Brown, 2010). In Mplus, available estimators for Thurstonian IRT models are unweighted least square (ULSMV) and weighted least squares (WLSMV). When these models are estimated, Mplus generates a warning that the residual covariance matrix is not positive definite. The ipsativity of forced choice data causes this lack of positive definiteness in the residual covariance matrix, and this warning can be ignored (Brown and Maydeu-Olivares, 2012). Mplus code for estimating the unidimensional Thurstonian IRT model for a ranking task with three items is included in the appendix. If multiple triplets are to be ranked, the model command and model constraints are repeated with the new item numbers.
Purpose
With a general explanation of Thurstonian factor model and Thurstonian IRT model, this method can now be demonstrated using a new teacher self-efficacy instrument. Many researchers avoid the use of forced-choice format due to the challenging analyses and problems associated with ipsative data (Christiansen et al., 2005; Meade, 2004). This article aims to provide a clear, step-by-step explanation of the theory and analyses behind this type of comparison, with hopes of guiding applied researchers wanting to attempt similar comparisons and improving measurement for psychological constructs that use self-report data. We make use of data gathered during the scale development process of a teacher self-efficacy measure, but do not intend to draw substantive inferences from it; instead, our study serves as a possible model for future researchers wanting to use Thurstonian IRT to analyze forced-choice response format data.
Method
A data set collected for the scale development of a previous study was employed for demonstrating the use of these methods. That study aimed to measure the self-efficacy of teachers who work with students with autism (Love et al., 2017).
Data
Respondents were selected through snowball sampling in which known teachers and administrators were asked to recruit additional members through social media, listservs, public e-mail lists, and primarily word-of-mouth. The targeted participants for this study included both general and special education K-12 teachers with a range of experience and education. A total of 217 teachers agreed to participate in this study, which led to a valid sample of 128, as 89 participants partially completed the demographic questions and none of the primary measures.
Measure and Procedure
The measure used in this study is the Teacher Self-Efficacy for Autism Scale (TSEAS), a 12-item scale designed by the authors to measure teachers’ certainty in their own abilities to carry out specific teaching tasks with children with autism spectrum disorder. The response format includes both a 4-point Likert-type response format ranging from 1 (Not certain at all) to 4 (Very certain) and a forced-choice ranking format (i.e., participants ranked the 12 items by comparing them against each other) with identical item statements existing in both formats. Both formats use the same set of 12 items, and both formats and items within formats were given in a randomized order to each teacher to prevent scale order effects and to minimize item-ordering effects which are particularly relevant to the ranking format. For the purpose of our study, we are examining only complete cases in which no responses were missing in order not to muddy the waters with discussion of missing data technicalities. A full description of the study procedure as well as instructions and wording of the TSEAS items can be found in Love et al. (2017).
Data Analysis
To analyze the forced-choice (ranking) format data, the observed ranking data were transformed into binary outcomes (see Maydeu-Olivares & Brown, 2010). A unidimensional Thurstonian IRT model with unrestricted thresholds and another with restricted thresholds was fit to the data using Mplus with the ULSMV estimator. The ULSMV chi-square and its associated p value, root mean square error of approximation (RMSEA), 90% CI RMSEA, comparative fit index (CFI), and Tucker–Lewis indexTLI were used to evaluate the fit of the models. Specifically, good model fit is indicated by RMSEA < .06 (Hu & Bentler, 1999), CFI > .96, and TLI > .95 (Yu, 2002). Additionally, following the suggestion of Yuan, Chan, Marcoulides, and Bentler (2016), equivalence testing T-size RMSEA, CFI, and TLI were computed and compared with cutoff values corresponding to the above cutoffs, which were calculated as .065 for RMSEA, .841 for CFI, and .827 for TLI. Since the T-size cutoffs are computed based on the cutoffs for the standard fit indices, our overall assessment of fit will be the same in both paradigms. T-size fit indices are useful in that they allow us to state with a specific level of confidence (95% in our case) that the size of misspecification is not worse than that implied by the T-size indices.
Of note is that these recommendations were not created using the ULSMV estimator or in the context of forced-choice data. The particularities of Thurstonian IRT modeling may require an entirely different set of cutoff criteria. Chi-square difference testing is not yet available for Thurstonian IRT models due to the nature of the additional constraints. As such, the Thurstonian IRT models with unrestricted versus restricted thresholds will be descriptively compared by means of the goodness of fit measures previously described.
Finally, when maximum a posteriori (MAP) scores are computed, the provided test information function overestimates the reliability of scores because it does not properly account for local dependencies. As suggested by an anonymous reviewer, in order to more accurately estimate test information and reliability, expected a posteriori (EAP) scores were obtained by re-running the model using a maximum likelihood estimator, fixing all loadings and thresholds to those obtained from the original model, and specifying a probit link. The information function and standard errors for scores from this analysis are used instead of those from the initial analysis using the ULSMV estimator.
Data from the single response format instrument were used to fit a unidimensional graded response IRT model (Samejima, 1969) in Mplus using the ULSMV estimator. The ULSMV estimator was used to maximize comparability to the Thurstonian IRT model. Chi-square difference testing and RMSEA, CFI, and TLI were used to compare the graded response models with common versus freely estimated item discriminations in order to determine the most appropriate model using the same criteria as for the Thurstonian IRT models. For the graded response model, the T-size cutoffs for fit indices corresponding to the cutoffs indicating good fit listed above were .087 for RMSA, .913 for CFI, and .891 for TLI.
Following appropriately fitting Thurstonian IRT and graded response models, these models were assessed by correlating factor loadings and comparing total information functions. Additionally, a joint model was fit in which both models were fit to the full data simultaneously so that the latent trait correlation could be computed without attenuation from imperfect reliability.
Results
Assessment of Thurstonian IRT Models
Overall fit indices for the two Thurstonian IRT models are provided in Table 1. Since the two models have essentially the same fit according to RMSEA, and the difference between CFI and TLI were deemed insubstantial, the restricted thresholds model was chosen for use since it is more parsimonious. Of note is that the number of degrees of freedom in the chi-square and RMSEA calculations were corrected from the values provided by Mplus due to the 220 redundancies present in the ranking data (Maydeu-Olivares, 1999). The fit of the Thurstonian IRT model with restricted thresholds is questionable, since RMSEA shows good fit but CFI and TLI show poor fit. Additionally, the T-size RMSEA = .040 shows good fit but T-size CFI = .622, and T-size TLI = .618 are worse than the cutoffs.
Overall Fit Indices for Thurstonian IRT Models Using ULSMV.
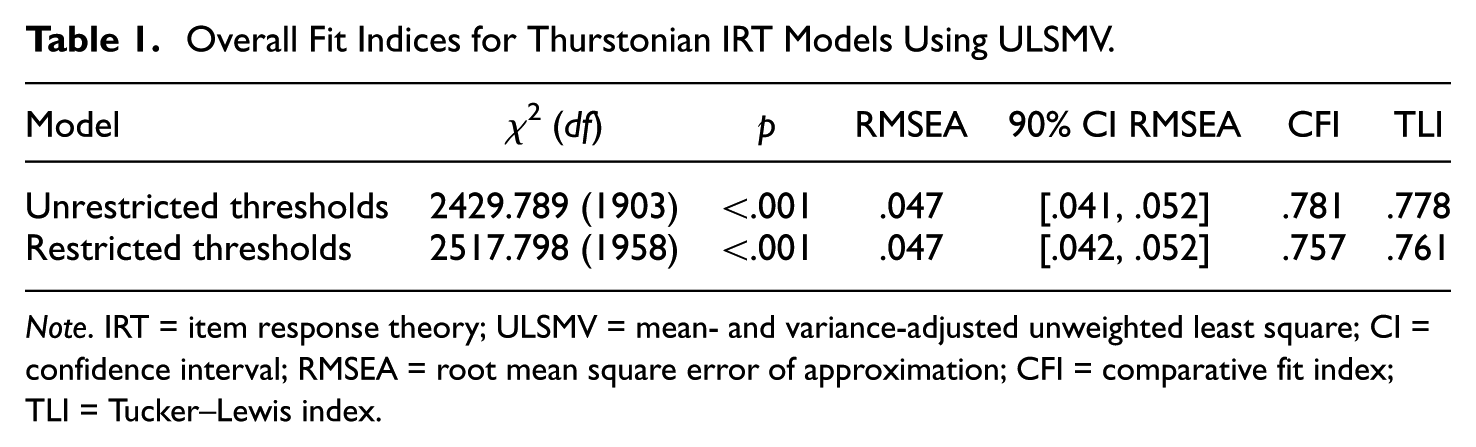
Note. IRT = item response theory; ULSMV = mean- and variance-adjusted unweighted least square; CI = confidence interval; RMSEA = root mean square error of approximation; CFI = comparative fit index; TLI = Tucker–Lewis index.
Table 2 displays the estimated factor loadings, intercepts, and uniqueness values from the modeled latent item utilities (note that the unrestricted thresholds model would not generate intercepts for the latent utilities of the items). It should be noted that factor loadings are not interpretable in the usual sense because only the difference in factor loadings is truly estimated in this model. As such, only the difference in factor loadings may be interpreted. In fact, when other items are used as marker items for identification, some factor loadings may be negative. For example, when Item 7 is used as the marker variable for identification, the loadings of items 1 and 2 are negative. This does not mean that Items 1 and 2 are negatively related to the construct, but rather simply that their loadings are less than Item 7’s. IRT parameters for the forced-choice comparisons are not listed because there are 66 of them. However, select comparisons are considered below, and their discriminations and thresholds are given in Table 3.
Factor Loadings, Intercepts, and Uniqueness Estimates of Latent Item Utilities for Thurstonian IRT Model.

Note. IRT = item response theory; λ = factor loading; μ = intercept; ψ = unique variance; SE = standard error.
Select Discrimination and Location Parameters of Comparisons for the Thurstonian IRT Model.
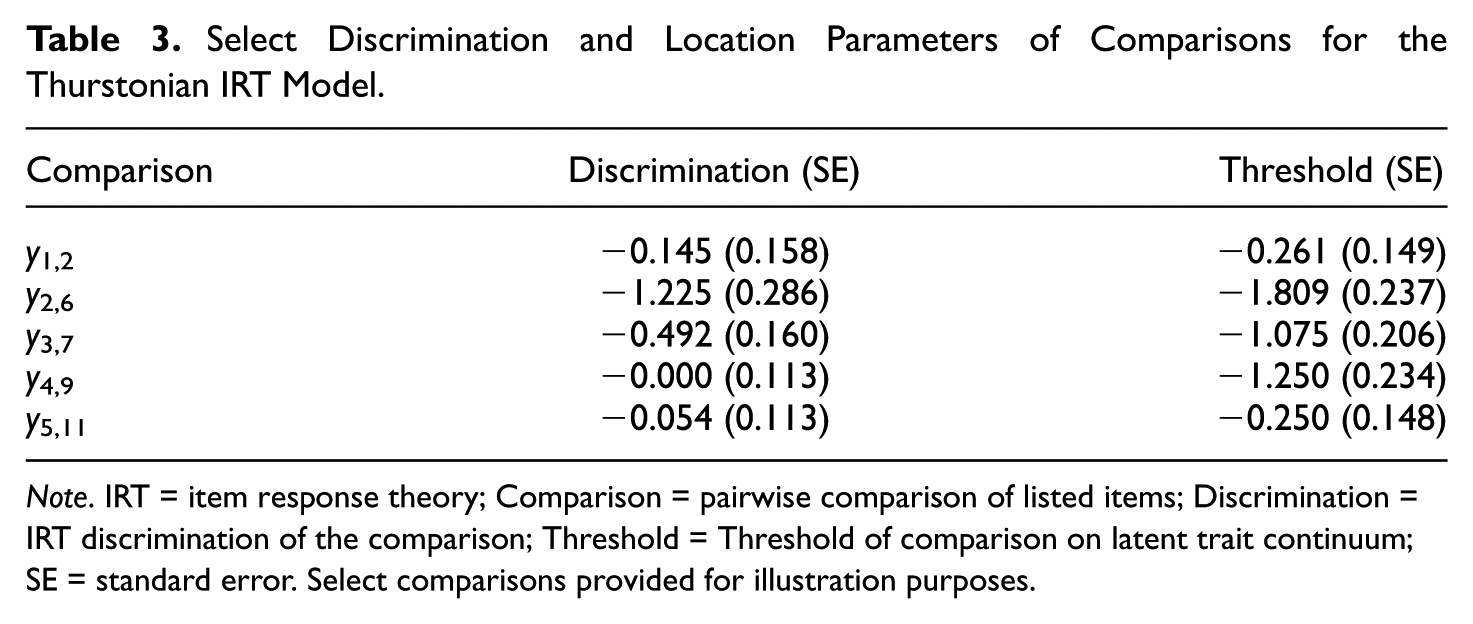
Note. IRT = item response theory; Comparison = pairwise comparison of listed items; Discrimination = IRT discrimination of the comparison; Threshold = Threshold of comparison on latent trait continuum; SE = standard error. Select comparisons provided for illustration purposes.
Interpreting the parameters in a Thurstonian IRT model involves complexity not present in standard IRT models. The examples provided in Table 3 illustrate these complexities. The comparison of Items 1 and 2 (denoted y1,2) has a negative discrimination indicating that a higher score on the ranking instrument are associated with a decreased probability of selecting Item 1 over Item 2. On the other hand, the comparison y2,6 has a positive discrimination, indicating that higher scores are associated with an increased probability of selecting Item 2 over Item 6. The zero discrimination of comparison y4,9 is a result of Items 4 and 9 having nearly identical factor loadings for their latent item utilities. This comparison therefore gives no information, and a location for that comparison would be meaningless. However, the threshold for this comparison is still meaningful. In addition, across all items the standard error of the threshold parameter appears to be inversely related to the item discrimination.
The empirical mean standard error for the EAP scores from this model was

which means that the empirical reliability using this Thurstonian IRT model was

where
Assessment of Graded Response Models
The data from the single-response format instrument was used to fit a graded response model with common discrimination parameters and another with freely estimated discrimination parameters. Overall fit indices for these two models are provided in Table 4. In terms of choosing which model fits best, the RMSEA, CFI, and TLI indices for the graded response model with freely estimated discriminations were slightly better. Additionally, the chi-square difference test between the two models was statistically significant,
Global Fit Indices for Graded Response Models Using ULSMV With Theta Parameterization.
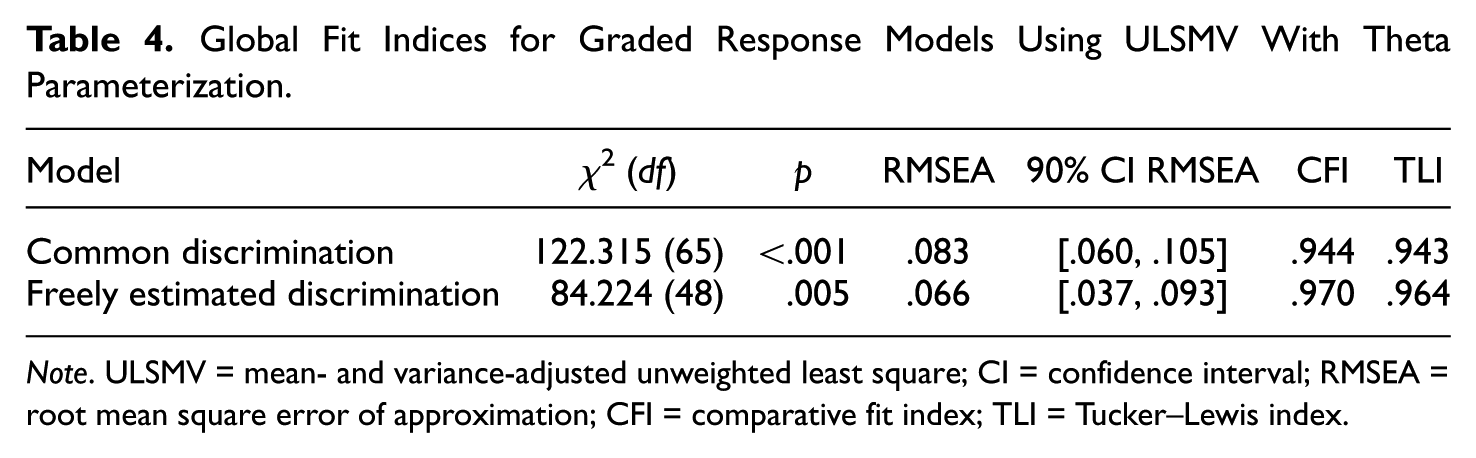
Note. ULSMV = mean- and variance-adjusted unweighted least square; CI = confidence interval; RMSEA = root mean square error of approximation; CFI = comparative fit index; TLI = Tucker–Lewis index.
Item Parameters for Graded Response Model Using ULSMV With Theta Parameterization.

Note. Linking function is probit or normal ogive as referred to in the item response theory literature. ULSMV = mean- and variance-adjusted unweighted least square; SE = standard error.
Model Comparison and Total Information Function
The latent traits from the two models (Thurstonian IRT and graded response models) were weakly correlated, Pearson’s r = .301. The factor loadings of the latent item utilities from the Thurstonian IRT model and item discriminations from the graded response model were moderately correlated with Pearson’s r = .639. When both models are put on a standardized scale, their information functions can be compared as shown in Figure 3. Note that the Thurstonian IRT model shows more information at higher values of the latent trait (η > 0.5), but less information at lower levels of the latent trait (η < −1).

Total information functions for Thurstonian item response theory (TIRT) and graded response (GR) models.
Discussion
Thurstonian IRT Model Findings
The directionality of the Thurstonian IRT scale depends on the choice of item for identification. Recall that the factor loading of the latent utility of Item 12 was set to 1 and the intercept of Item 12 was set to 0 in order for the model to be identified, but the choice of Item 12 was entirely arbitrary. In fact, of the 12 possible items to choose from to fix for identification, 5 of them result in a reversal of direction: The comparison discriminations, comparison thresholds, and factor scores are all the opposite of what they are in the Thurstonian IRT model we fit to the data (see Table 2). Moreover, these are the 5 items with the lowest loadings in Table 2. Given the correlation between factor loadings of latent item utilities in the Thurstonian IRT model and discriminations in the graded response model, item calibrations from an instrument fit with a graded response (or other single-response type) model can be used to choose the item with largest discrimination and thus minimize the possibility of this type of scale reversal. The issue of possible scale reversal can be overcome by using a distractor item unrelated to the construct in a ranking task and fixing its loading to zero. Assuming no crossloading(s), therefore, using items from multiple dimensions in a ranking task will naturally avoid the possible scale reversal problem. If care is not taken to eliminate the possibility of reversal, the resulting factor may be negatively correlated with the construct of interest; in our particular case, under identification constraints resulting in a reversal, higher factor scores from the Thurstonian IRT model would be indicative of lower latent construct scores (e.g., teacher self-efficacy in our example), which is an undesirable property for an instrument to have.
Results also indicated that across all items the standard errors of the threshold parameters were inversely related to the item discriminations. This makes sense, as a lower discrimination results in less information and therefore a lesser ability to distinguish between thresholds.
The Thurstonian IRT model has several unfortunate properties as well, including poor fit according to CFI and TLI. The poor fit could be the result of the very high cognitive complexity of ranking 12 items, sampling error within such a small sample, or, more concerningly, misfit between the Thurstonian IRT model and the actual response process(es).
Graded Response Model Findings
As demonstrated in Table 5 and Figure 3, the single-response model instrument does not effectively discriminate among participants with high teacher self-efficacy, which reflects a commonly documented problem with self-report measures. Many researchers contend that self-report measures like the TSEAS used herein come with a potential susceptibility of social desirability, or a tendency for respondants to respond according to what he or she feels is socially acceptable (Arnold & Feldman, 1981; Van de Mortel, 2008). Further, the measurement of self-efficacy has been veiled by repeated cautions (Henson, 2002; Klassen, Tze, Betts, & Gordon, 2011; Zee & Koomen, 2016) and it has historically been noted that individuals tend to overestimate their personal capabilities when completing self-report measures (Bandura, 1997). The results of this study echo those concerns, as the single-response model reflects teachers who more often respond as highly efficacious, when this may or may not be a completely accurate reflection of their teaching behaviors. Therefore, the Thurstonian IRT model is one attempt at addressing these repeated concerns, aimed at forcing teachers to make decisions on items instead of simply responding highly about their capabilities.
Comparison of Formats
Reviewing the total information function for both formats, it was noticed that the forced-choice format provides more information at higher η compared with the single-response format. This makes sense given the fact that teachers may capitulate to social desirability when using a single-response format, and thus are more likely to answer in the higher categories. This depresses item locations so that the graded response model shows fewer high location items, resulting in lower information there. By contrast, the graded response model shows higher information at lower levels of η.
The low correlation (r = .301) between latent traits in the joint model is concerning, since it is hoped (or believed) that they measure the same trait. Instead, it may be possible that the response process described in Equation (1) is cognitively different from the response process of choosing a category in the single-stimulus instrument. However, this low correlation may have other, less pernicious causes. The substantial cognitive complexity of ranking 12 items simultaneously, which is something existing studies have not asked of respondents in studies like this one, could introduce significant amounts of measurement error in the Thurstonian IRT latent variable. The possible poor global fit of the Thurtonian IRT model can be viewed as implying that the latent variable having imperfect correlation with the latent trait it is purporting to measure, and therefore suppress the correlation between the Thurstonian IRT and graded response latent traits. Finally, the social desirability responding evident in the single-response format data can add variance related to response bias to the latent trait, which would not be correlated to the Thurstonian IRT latent trait. Of note is that existing literature has typically found moderate to high (.6 to .9) mono-trait hetero-method correlations using the same methods as this study (Brown & Maydeu-Olivares, 2013; Guenole, Brown, & Cooper, 2018; Joubert, Inceoglu, Bartram, Dowdeswell, & Lin, 2015; Wetzel et al., 2016), although one notable exception (Anguiano-Carrasco, MacCann, Geiger, Seybert, & Roberts, 2015) found correlations similar to and lower than ours.
Limitations
One limitation of this study was the size of the sample that was used to conduct Thurstonian IRT. Maydeu-Olivares and Brown (2010) suggest that a sample size of 200 is minimally sufficient in accurately estimating item characteristic curves. Large sample sizes are needed in order to estimate individual parameters. Our sample of 128 is smaller than the recommendations suggested by researchers (Maydeu-Olivares & Brown, 2010). More generally, a sample of 128 is considered too small to effectively estimate two parameter IRT models. Furthermore, the possibly poor fit of the Thurstonian IRT model limits any inferences that can be drawn from that model or from comparisons between the two models. However, the purpose of our study was to introduce a new format and indicate whether or not more information was provided when using forced-choice format. This purpose was successful with the used sample size, and this paper can serve as a guide for larger and more appropriate data sets.
Ways to Improve Design
Because of the difficulty of ranking 12 items simultaneously, Brown and Maydeu-Olivares (2011, 2013) recommend separating items into triplets for the purpose of ranking, so that the task is easier to perform. The moderate correlation between the factor loadings of the latent items utilities and the discrimination parameters of the graded response model suggests that items’ characteristics from a single-stimulus instrument may be used to create effective sets of items for ranking and, as previously noted, for choosing a marker item for identification purposes. Because the discrimination of a given comparison relies on the difference in factor loadings of the latent item utilities, each set of items for ranking should be chosen to have as much diversity of factor loadings and therefore as large of discriminations as possible. Specifically, each triplet could be designed to include one item with a small loading, one item with a medium loading, and one item with a large loading. However, this is predicated on prior knowledge regarding item loading size which may possibly be obtained from traditional single-stimulus format or initial item calibrations.
In order to maximize that diversity of factor loadings, Brown and Maydeu-Olivares (2011) recommend using both positively and negatively keyed items. For example, if a triplet of items has factor loadings of latent item utility of 0.5, 0.8, and 1.1, the resulting discriminations of the comparisons will be proportional to 0.3, 0.3, and 0.6, respectively. However, if the item with a factor loading of 0.8 was reverse keyed, so that its factor loading is −0.8, the resulting discriminations will be proportional to 1.3, 0.6, and 1.9, representing a substantial increase in information. However, it is known that negatively keyed items increase cognitive demand, and appropriate phrasing of negative items so as to not distort the underlying response process is difficult (Brown & Maydeu-Olivares, 2011).
Finally, item information is greatly enhanced when each triplet contains items belonging to different dimensions which are as uncorrelated as possible. Therefore, when multiple traits are to be assessed with a single instrument, it is preferable to not include multiple items corresponding to a single trait in the same triplet (Brown & Maydeu-Olivares, 2011). If only a single trait is being considered, the beneficial effect of using items from multiple traits can also be obtained by using distractor items which are expected to not correlate with the trait of interest. The loadings of these items on the factor will be zero so that the discrimination of the comparison between a distractor and an item measuring the latent trait will not be decreased by the subtraction in Equation (5).
Avenues for Future Research
Given the significant lack of agreement between the level of fit indicated by RMSEA and CFI/TLI for the Thurstonian IRT models investigated, the question of model fit for the Thurstonian IRT model in our study is not easily addressed. Scant simulation studies have been performed addressing matters of model fit in the forced-choice/Thurstonian IRT setting. Guenole et al. (2018) simulated data based on their model parameters and found that RMSEA and CFI performed as expected. However, in simulation studies presented by Brown and Maydeu-Olivares (2011), nominal rejection rates of chi-square varied substantially based on exact model characteristics. In addition to this unclear picture is the total absence of recommendations concerning comparing the relative fit of different models. In our study, we retained a restricted threshold models based on parsimony, but Brown and her colleagues either fit unrestricted threshold models as a matter of course (Brown & Maydeu-Olivares, 2011, 2013; Maydeu-Olivares & Brown, 2010) or fail to address the possible distinction and do not mention which type of model was fit (Guenole et al., 2018; Wetzel et al., 2016). Although item intercepts may not be of substantive interest, it is worth noting that item calibration (e.g., for computer adaptive testing purposes) requires a restricted thresholds model lest parameters for every possible comparison require calibration as opposed to parameters for every item. Therefore, an accurate mechanism for testing the reasonableness of the restricted thresholds assumption is an important thing to try to figure out. Finally, no simulations (or arguments of any sort) have been performed to determine whether dimensionality of forced choice data can be assessed using Thurstonian IRT techniques, despite Wetzel et al. (2016) using an exploratory structural equation modeling procedure with Thurstonian IRT.
Also, the low discrimination of individual comparisons means that tests will have to be longer to obtain the same quality of results. In our study, the Thurstonian IRT and graded response models had similar empirical reliability despite the forced choice data involving 66 paired comparisons for the 12 items. If the items were to be used in ranking triplets, these same 12 items would only generate 12 paired comparisons and likely result in significantly lower reliability. The need for creating efficient ranking triplets is therefore great to avoid long tests that may tire participants. One of the suggestions frequently repeated in literature is to negatively key some items, which will greatly increase comparison discriminations. However, it is unknown whether this tactic will result in substantial methodological variance or even change the response process so that Thurstone’s law of comparative judgment is no longer relevant, and therefore Thurstonian IRT would be ineffective at creating scale scores. The issue of negatively keying items in ranking tasks is important because of its potential benefits, and our review of literature uncovered only one small study investigating this possibility (Brown and Maydeu-Olivares, 2011). In order to reduce test length, it is common to use computer adaptive tests to avoid presenting irrelevant items to the respondent (Kean & Reilly, 2014). Lin and Brown (2017) have provided some evidence that Thurstonian IRT item parameters may be context independent, meaning that the item parameters do not depend on which other items are contained in the same ranking triplet. However, their study was limited to the effect of removing an item from a ranking quad to obtain a ranking triad. Designing and validating computer adaptive testing forced-choice instruments for use with Thurstonian IRT is an important direction for researchers to pursue.
Given that Thurstonian IRT has already been successfully used in multimethod comparison studies including correlational validity evidence (Anguiano-Carrasco et al., 2015; Brown & Maydeu-Olivares, 2013; Guenole et al., 2018; Wetzel et al., 2016), the next step to take is to use instruments about which sufficient validity evidence has been acquired in the relevant population and use them in structural equation modeling contexts, such as mediation analysis. In sum, we find forced-choice data analyzed with Thurstonian IRT models to be potentially useful in overcoming uniform response biases, although much work needs to be done in order to validate the response process assumptions involved and to effectively create efficient tests.
Finally, using a forced-choice format is a method for preventing response bias that has enjoyed some success in the personality literature, but which is still only somewhat understood. Additionally, there are concerns that in some cases, the forced choice format may not eliminate response bias because the test takers may try to determine what response their evaluators would prefer (Feldman & Corah, 1960). As such, qualitative research to determine whether the response process assumptions made by Thurstone’s law of comparative judgment may shed some light into which contexts forced-choice data can be used to produce unbiased results.
Footnotes
Appendix
Authors’ Note
A previous version of this article was presented at the annual meeting of the American Educational Research Association, San Antonio, TX, April 27–May 1, 2017. Trisha A. Turner is now affiliated with Berea College, Berea, KY, USA.
Declaration of Conflicting Interests
The author(s) declared no potential conflicts of interest with respect to the research, authorship, and/or publication of this article.
Funding
The author(s) received no financial support for the research, authorship, and/or publication of this article.