
Abstract
Mechanisms causing item nonresponses in large-scale assessments are often said to be nonignorable. Parameter estimates can be biased if nonignorable missing data mechanisms are not adequately modeled. In trend analyses, it is plausible for the missing data mechanism and the percentage of missing values to change over time. In this article, we investigated (a) the extent to which the missing data mechanism and the percentage of missing values changed over time in real large-scale assessment data, (b) how different approaches for dealing with missing data performed under such conditions, and (c) the practical implications for trend estimates. These issues are highly relevant because the conclusions hold for all kinds of group mean differences in large-scale assessments. In a reanalysis of PISA (Programme for International Student Assessment) data from 35 OECD countries, we found that missing data mechanisms and numbers of missing values varied considerably across time points, countries, and domains. In a simulation study, we generated data in which we allowed the missing data mechanism and the amount of missing data to change over time. We showed that the trend estimates were biased if differences in the missing-data mechanisms were not taken into account, in our case, when omissions were scored as wrong, when omissions were ignored, or when model-based approaches assuming a constant missing data mechanism over time were used. The results suggest that the most accurate estimates can be obtained from the application of multiple group models for nonignorable missing values when the amounts of missing data and the missing data mechanisms changed over time. In an empirical example, we furthermore showed that the large decline in PISA reading literacy in Ireland in 2009 was reduced when we estimated trends using missing data treatments that accounted for changes in missing data mechanisms.
Keywords
National and international large-scale assessments (LSAs) in education have become increasingly important tools for evaluating the effectiveness of educational systems. The outcomes of educational systems are typically defined as the levels of proficiency students in a particular age-group or grade achieve in a particular domain. Subgroup differences in the attainment of proficiency levels such as disparities in terms of socioeconomic status, gender, or immigration background are of special interest because educational policies are often aimed at reducing inequalities. Another main focus of attention lies on changes in achievement over time. Trend estimations serve at least two purposes: First, they help estimate the impact of interventions and, second, they reveal how patterns of achievement between countries or subgroups develop over time (Lietz, Cresswell, Rust, & Adams, 2017).
Most LSAs have cross-sectional designs. Thus, trend estimation is equivalent to estimating differences between distinct (sub)groups because the target populations contain different individuals in each assessment cycle. In this situation, a link between the cycles cannot be established on the basis of common persons but has to be established on the basis of common items. This is referred to as the nonequivalent groups with anchor test (NEAT) design (e.g., Dorans, Pommerich, & Holland, 2007). The estimation of trends in a NEAT design is challenging. Generally, it is essential that as many factors as possible are not altered from one test administration to the next. For example, maintaining a common context, comparable constructs, and comparable data collection designs are some of the challenges that researchers face with regard to trend analyses (Mazzeo & von Davier, 2009, 2014). The focus of our study is to identify how best to treat missing data for trend analyses when the missing data rate and mechanism may change. Despite its importance, this issue has received little attention in the literature thus far. The following example illustrates its practical relevance.
The Case of Ireland
The Programme for International Student Assessment (PISA; e.g., OECD, 2016) is conducted every 3 years to provide information about changes in student proficiencies in addition to country comparisons. Typically, the test results have no consequences for the test takers. For this reason, these tests are considered low-stakes tests, which are potentially more prone to item nonresponse than high-stakes tests (DeMars, 2007).
In 2009, there was a sudden decline in PISA reading in Ireland (Figure 1). Cosgrove and Cartwright (2014) analyzed whether the decline could be traced back to changes in the sociodemographic composition of the sample, the implementation of the test, or response patterns as a measure of student engagement. They focused on comparing the 2003 PISA data with the 2009 PISA data and found a larger increase in missing data for Ireland between 2003 and 2009 than for the rest of the OECD countries. Particularly for items in the last block position, 1 the increase was accompanied by a decline in the percentage of correct item responses but not by an increase in incorrect responses. This was in contrast to the OECD average, where both percentages remained stable over time in the last block position. Furthermore, the increase in missing values and the decrease in correct responses were observed to be larger for the linking items than for the new items. Cosgrove and Cartwright (2014) hypothesized that a general decline in student engagement in Ireland in 2009 may have resulted in a change in the missing data mechanism. To examine changes in the average proportion of missing values, they calculated time-series correlations for the average proportion of missing responses from 2003 to 2009 for Ireland and for all OECD countries. From the results and from additional analyses by Cartwright (2011), they deduced that nonresponses are distinct from proficiency and that they are highly nationally idiosyncratic characteristics that change over time. Overall, Cosgrove and Cartwright’s (2014) findings suggest that missing values, especially changes in the percentages of missing values and changes in the missing data mechanisms, may have affected Ireland’s decline in reading achievement. However, the impact of the detected changes in the characteristics remained unclear.
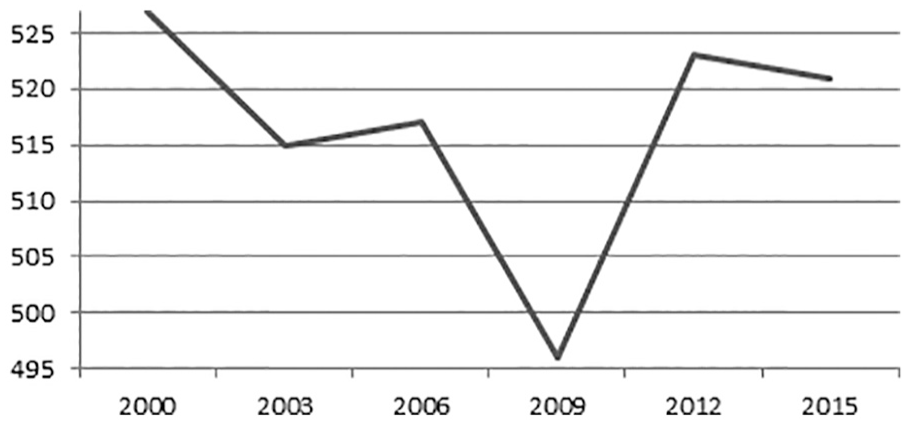
Trend in reading literacy in Ireland in the PISA (Programme for International Student Assessment) studies.
Nonignorability
There are different kinds of missing data mechanisms and different approaches for dealing with them. Parameter estimation using item response theory (IRT) models and direct likelihood or Bayesian inference can, under certain circumstances, lead to bias and invalid conclusions if the missing data are not appropriately accounted for. When data are missing completely at random (MCAR) or missing at random (MAR), they are ignorable (Little & Rubin, 1987), and multiple imputation or full maximum likelihood imputation will lead to unbiased estimates provided the (missing data) model is correct (Schafer & Graham, 2002). However, the assumptions about data that are MAR or MCAR do not always hold for omissions in LSAs because students are more likely to omit items when they do not understand what the item is asking them to do or when they do not know the answer (Mislevy & Wu, 1996; Stocking, Eignor, & Cook, 1988), and this behavior might not be associated with other variables in the data set. Furthermore, several quantitative studies have shown that item nonresponse is related to individuals’ proficiencies (Köhler, Pohl, & Carstensen, 2015; Pohl, Gräfe, & Rose, 2014; Rose, von Davier, & Xu, 2010). Years ago, Lord (1983) suggested that omissions may be due to a dimension of temperament that is correlated with proficiency. This idea is also in line with the findings from a qualitative study by Jakwerth and Stancavage (2003) who asked students about the reasons for their omissions and found that many students had an overarching motivation issue. Moreover, Köhler et al. (2015) related test takers’ propensity to skip items (i.e., their missing propensity or omission propensity) to many background variables and found relatively stable patterns across different age cohorts and test domains, suggesting that omission propensity can be regarded as a person-inherent construct.
The missing propensity is frequently treated as conceptually different for omitted items dispersed throughout a test than for consecutively omitted items at the end of a test (e.g., Rose, von Davier, & Nagengast, 2017). The so-called not reached items can be attributed to testing time limits, and it is likely that—in contrast to items that were skipped earlier in the test—the test taker did not deliberately decide to skip the last items but was forced to do so by time constraints. Using response times, Ulitzsch, Pohl, and von Davier (in press) showed that not reached items are due not only to time limits but also to quitting. Nevertheless, in contrast to items that were skipped earlier in the test, the test takers did not see these later items. Thus, not reached missingness processes are usually handled separately from omission missingness processes.
In either case, it is likely that the parameters of the missing data model are related to those of the response model. If the missing data are not MAR, and if the parameters of the missing data model are not distinct from those of the response model, the missing data mechanism is called nonignorable (Little & Rubin, 2002). In this case, one needs to specify an appropriate model for the missingness process in order to obtain unbiased parameter estimates (Greenlees, Reece, & Zieschang, 1982; Schafer & Graham, 2002). Incorporating an appropriate model for the missingness process also means that it is necessary to model different mechanisms for the omissions and for the not reached items where needed (Pohl et al., 2014; Rose et al., 2017).
Missing Data Treatments
In dealing with potentially nonignorable missing data, researchers have to choose between different methods. One frequently used approach in LSAs is to score nonresponses as wrong. This practice is based on the rationale that the student did not provide a correct response, which should thus be treated in the same way as an incorrect response. Several studies have shown that this practice might not be appropriate in all situations (Finch, 2008; Lord, 1974; Pohl et al., 2014; Rose et al., 2010).
Another alternative is to ignore missing values, that is, to treat missing items as though they had never been presented to the test taker. The practice of ignoring missing data has been shown to be more robust than scoring missing items as wrong in many situations (e.g., Finch, 2008; Pohl & Carstensen, 2013; Pohl et al., 2014; Rose et al., 2010). Yet treating missing values as if they were ignorable might not be suitable for all testing situations either. If an examinee knows the scoring rule and wants to optimize his or her scores, the examinee “can obtain as high a theta hat as he [or she] pleases, simply by answering only those items he [or she] is sure he [or she] can answer correctly and omitting all others” (Lord, 1980, p. 228).
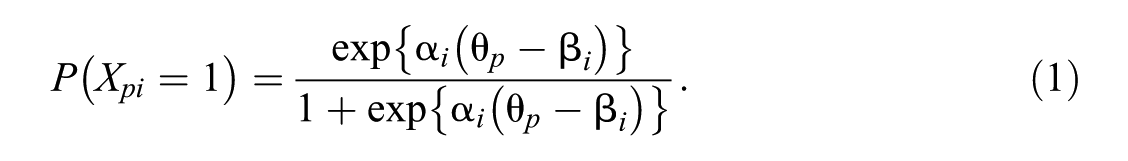
More recently developed model-based approaches model the missingness process by including the missing propensity as either a manifest or a latent variable. The inclusion of a latent missing propensity was introduced by O’Muircheartaigh and Moustaki (1999) and goes back to Knott, Albanese, and Galbraith (1991). In the model, a latent variable represents the tendency to omit items, which may depend on the test taker’s proficiency that is being measured. Holman and Glas (2005) drew on this research and proposed a multidimensional IRT model with an additional dimension based on response indicator variables. To illustrate the model, consider the two-parameter logistic (2PL) IRT measurement model, where a person by item data matrix
More dimensions can be added by expanding the trait parameter

The measurement model for the second dimension, which links the probability that person p will work on item i via the logistic function to the item’s propensity to be omitted

whereby the omission propensity and the proficiency are allowed to correlate:

Glas, Pimentel, and Lamers (2015) further extended this model to allow for covariates:

where
Multidimensional IRT models with covariates have also been proposed for modeling nonignorable missing responses due to omitted and not reached items separately (e.g., Rose et al., 2017). As mentioned before, nonresponses at the end of the test are conceptually different from omissions. Also, their indicators (which can be defined in a manner that is analogous to Equation 2) cannot be treated as items that measure a second dimension, mainly because they violate the IRT assumption of stochastic independence. Thus, Rose et al. (2017) proposed that researchers should model the not reached process by incorporating a latent regression of the omission propensity and of the proficiency on the person-wise average number of not reached items:

with
Latent regression can also be used for trend modeling. If the trend modeling uses traditional concurrent calibration (Wingersky & Lord, 1984), that is, the data from two time points are scaled together,
An alternative is to use IRT linking procedures with separate calibration such as mean–mean linking, mean–sigma linking, fixed common item parameter (FCIP) calibration, or characteristic curve methods (Kolen & Brennan, 2014). When groups are analyzed separately, the covariances are allowed to vary between groups. When FCIP equating is used, all item parameters are fixed to be exactly the same in both groups. This is usually obtained by setting the item parameter values in the calibration of the second group equal to the values of the first group. Trend estimates using separate calibration and one of the abovementioned linking methods can be obtained by calculating the difference in group means because the proficiency estimates are already on the same scale due to the linking.
Another alternative approach to estimating trends and accounting for missingness processes is to employ multigroup models. Multigroup models also allow for different variances and covariances in the dimensions between groups or time points, respectively. The multigroup version of the 2PL IRT measurement model described above can be written as

for groups g = 1, . . ., G and with

and proficiency and omission propensity are bivariate normally distributed:

Operational Practice in LSAs
In the most prominent international LSAs, omissions are scored as incorrect in operational practice. In PISA, omitted items are scored as wrong, and not reached items are accounted for with the manifest model-based approach (see Equations 5 and 6) proposed by Rose et al. (2010; OECD, 2017). Before 2015, omissions were scored as wrong, not reached items were ignored in item parameter estimation, and both were treated as wrong for the purpose of obtaining person parameters (OECD, 2014). The Trends in International Mathematics and Science Study (TIMSS; Martin, Mullis, & Hooper, 2016) uses a similar approach: Omissions are scored as incorrect throughout the test. Not reached items are ignored when item parameters are estimated and are scored as wrong when person parameters are estimated. The same procedure is applied in the Progress in International Reading Literacy Study (PIRLS; Foy & Yin, 2017). In the Programme for the International Assessment of Adult Competencies (PIAAC), omissions are treated as wrong in the paper-and-pencil version. In the computer-based version, omissions are treated as wrong when a respondent spent more than 5 seconds on an item and are ignored otherwise; not reached items are always ignored (Yamamoto, Khorramdel, & von Davier, 2013). However, none of these LSAs explicitly accounts for changing missing data mechanisms.
Research Questions
The treatment of missing data is important for accurate parameter estimation in LSAs (Finch, 2008; Glas & Pimentel, 2008; Holman & Glas, 2005; Rose et al., 2017), but it has received little attention in the context of trend estimation based on cross-sectional designs or, equivalently, for the estimation of group differences. Yet this topic is highly relevant because estimating trends and group differences are two of the key reasons for conducting LSAs such as PIAAC, PISA, PIRLS, or TIMSS. 2
For trend analyses, it could be argued that as long as all single estimates are biased to the same degree in the same direction, the trend estimation will be unbiased. For example, it can be inferred from previous studies that, in some situations, scoring items as wrong may result in biased group mean estimates (Finch, 2008; Pohl et al., 2014). If the group mean estimates at both time points are biased in the same direction, their difference (i.e., the trend) could still be unbiased. However, this argumentation depends on the unrealistic assumption that the mechanism and the percentage of missing values as well as the proficiency to be measured remain constant, which is implicitly being made by the operational practices applied in many LSAs (see above). It has already been shown that missing data mechanisms and percentages of missing values in international LSAs can vary between countries (e.g., Rose et al., 2010) and that percentages of missing data change over time within and between countries (Cartwright, 2011). However, whether and how missing data mechanisms change within countries over time has not yet been investigated.
There are a few studies that have at least begun to address the issue of how to treat missing data when estimating trends. Köhler, Pohl, and Carstensen (2017) evaluated the performance of different missing data treatments with respect to group differences. They simulated percentages of missing data that changed across groups and a latent omission propensity as the missing-data-generating mechanism. Using the model-based approach presented by Holman and Glas (2005) with concurrent calibration, they found unbiased estimates and biased estimates when omissions were coded as wrong or ignored, respectively. However, they did not investigate the effect that would occur when missing data mechanisms changed across groups or time. Kuha et al. (2018) proposed multigroup mixture models and applied them to an attitude scale to show that it is not plausible to assume equal missing data mechanisms between countries. Yet they did not investigate whether and how mechanisms change in a proficiency test and over time, and they did not evaluate the performance of their models in comparison with alternative missing data treatments. Thus, we do not know how prevalent changes in missing data mechanisms are in proficiency testing over time and how missing data treatments affect trend results.
Our main goal in this study is to provide empirical evidence for enhancing the estimation of trends and group differences in LSAs by investigating the missing data mechanisms present in these data and by evaluating the performance of different approaches for dealing with missing data.
Specifically, we addressed three research questions:
How stable are missing data mechanisms in LSAs over time?
How do traditional and current missing data approaches perform for trend estimation when the amounts of missing data and the missing data mechanisms vary over time?
What are the practical implications of choosing different approaches for the treatment of missing data for trend analyses in LSAs?
We conducted three studies, one for each research question. For the first research question, we analyzed a broad range of data covering different competence domains as well as different countries and assessment cycles of PISA. This study was chosen because of its broad country coverage, frequency of administration, widespread use in international and national policy relevant documentation, and the fact that the Irish case represented an interesting starting point from which to build the present study. The results provided insights into the missing data mechanisms that occur in practice and also provided information about how we could create the realistic data generation settings that we used in the subsequent simulation study. The second research question was addressed in a simulation study in which specific conditions were manipulated to evaluate the performances of different missing data approaches under these conditions. In the third study, we showed how the choice of missing data treatment affected trend estimation by applying different missing data approaches to our initial example, the Irish PISA reading data.
Study 1: Investigating the Occurrence of Missing Data Mechanisms in LSAs
Sample and Test Design
We reanalyzed PISA data from 35 OECD countries for the 2006, 2009, and 2012 assessment cycles. The PISA samples are representative of the population of 15-year-old students attending educational institutions in each country (OECD, 2014). We analyzed data from a total of N = 905,517 students across all countries, with sample sizes per country varying between Nmin = 293 students in Liechtenstein in 2012 and Nmax = 38,250 students in Mexico in 2009 (mean sample size per country: MN = 8,634, SDN = 7,616). In each country, the test takers received booklets with items for assessing three proficiency domains—namely, reading, mathematics, and science.
Statistical Analyses
For each country in each cycle and in each domain, we calculated the average number of omitted items and not reached items per person. Furthermore, we investigated the nonignorability of item omission by estimating the correlations between students’ proficiency and students’ omission propensity. For estimation, we used the model by Rose et al. (2010) and Rose et al. (2017), which comprises a latent omission propensity (see Holman & Glas, 2005) as well as the number of not reached items in the background model for both proficiency and omission propensity. We followed the PISA operational practice and set all discrimination parameters to 1. This results in the 1PL version of the model described in Equations (1) to (6). To estimate proficiency, omitted items and not reached items were coded as not available (N/A), but when we estimated the omission propensity, omitted items were given a score of 1, not reached items were coded as N/A, and valid responses were given a score of 0.
To examine the stability of the nonignorability and the proportions of omissions, we calculated descriptive statistics and additionally specified two autoregressive models. In the first autoregressive model, the correlation between proficiency and omission propensity was predicted by the correlation between proficiency and omission propensity in the respective previous cycle. The second autoregressive model was specified analogously for the percentages of omissions.
Results
Figure 2 shows the percentages of omitted values in all 35 countries for all cycles and domains. On average, the omission rate was 8%. The mean percentages of omissions (mo) varied considerably across cycles, countries, and domains (momin = 1% and momax = 21% with SD = 3.15), indicating substantial differences in test-taking behavior. For some countries, omission rates were relatively homogeneous across cycles, whereas for other countries, omission proportions varied considerably across cycles. The maximum change in omissions from one administration cycle to the next within one country and domain was 12%, and the mean change was 4%. When considering the sum of omissions and not reached items, the maximum observed change in missing values from one cycle to the next within one country was 20%.

Mean percentage of omissions (mo) in 35 OECD countries across three domains and three cycles.
The second column of Table 1 shows the standardized residual variances of the autoregressive model in which linear dependencies were estimated between the percentages of omissions for all 35 countries between points in time. These results indicate that the percentage of omissions was stable over time to some extent. However, the proportion of variance that could not be explained by the autoregressive effects was still considerable, indicating a nonnegligible change in the percentage of omissions over time.
Standardized Residual Variances From Two Autoregressive Analyses of (a) the Mean Percentage of Omissions and (b) Nonignorability.

Note. Variables were predicted by their respective values in the previous PISA (Programme for International Student Assessment) cycle.
Correlation between omission propensity and proficiency.
Figure 3 shows the average estimated correlations between omission propensity and proficiency. Across all countries, cycles, and domains, the mean estimated correlation was
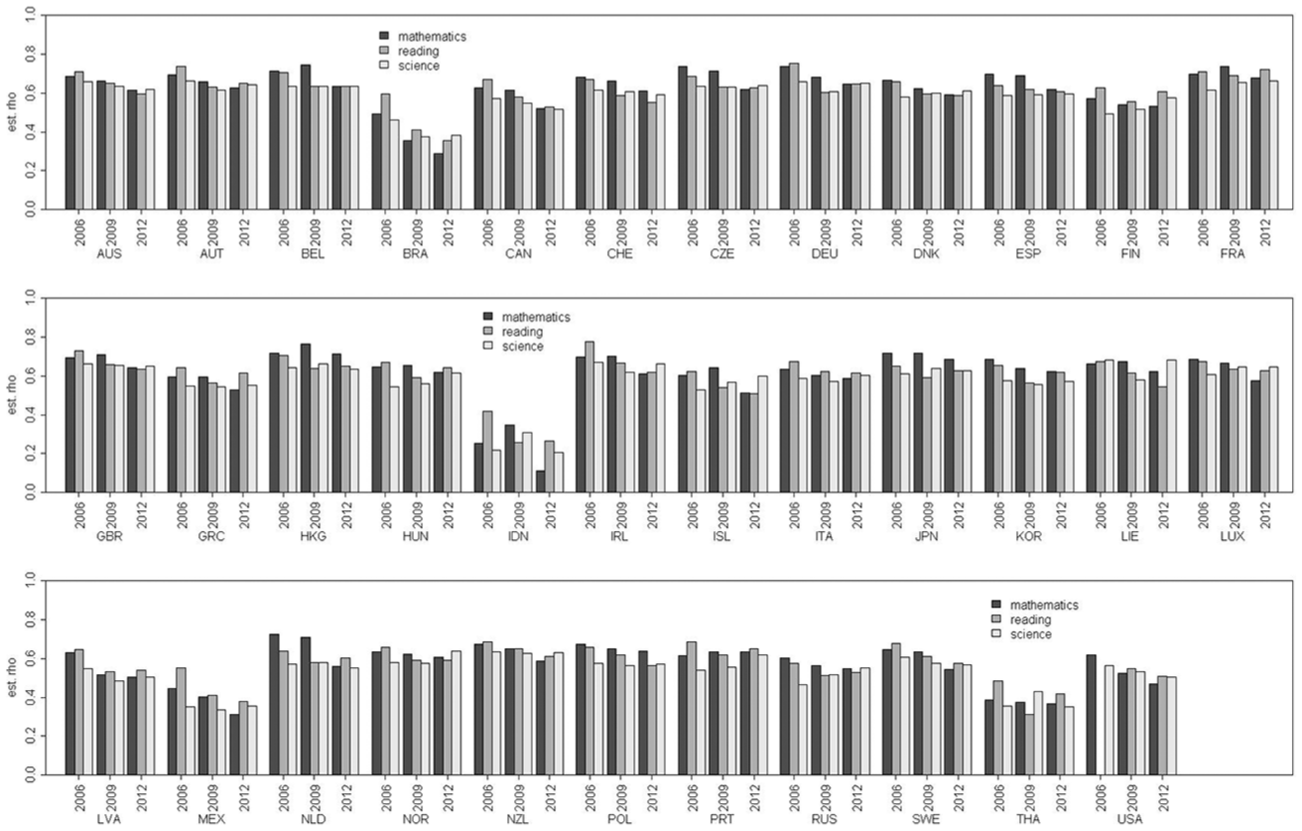
Estimated correlations between omission propensity and proficiency in 35 OECD countries across three domains and three cycles.
The substantial differences in mean percentages of omissions and in correlations between omission propensity and proficiency across countries, domains, and cycles, as well as the presence of relatively high overall nonignorability already indicate that the mean differences between groups or time points might be biased when an adequate missing data model is not used. We investigated the extent of this bias in Study 2.
Study 2: Performance of Missing Data Approaches
Data Generation
We conducted a simulation study to evaluate the performance of different missing data approaches for trend estimation under extreme and realistic conditions. We considered the case of a two-group comparison and drew two independent random samples of N1= N2= 5,000 test takers and simulated two points in time (which, in cross-sectional designs, is equivalent to simulating two groups). Data were generated for the two groups separately in accordance with the model presented by Holman and Glas (2005) as described in Equations (1) to (3). Individuals’ proficiencies θ p and individuals’ omission propensity ξ p were generated as draws from a multivariate normal distribution:
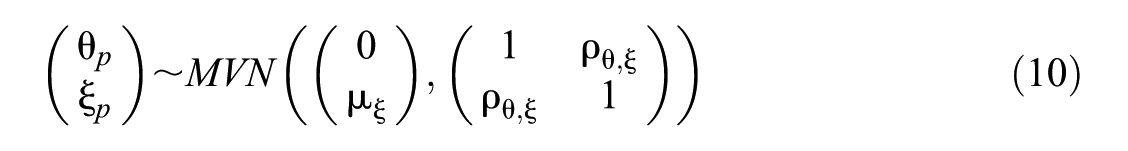
For simplicity, we set the mean and variance of the proficiencies
Factors of Investigation
Two factors with five levels each were fully crossed (Figure 4), and five different models were compared for every combination. The first factor describes the amount and change in nonignorability across time. It consists of five levels of changes in missing data mechanisms at the two time points by varying the correlations
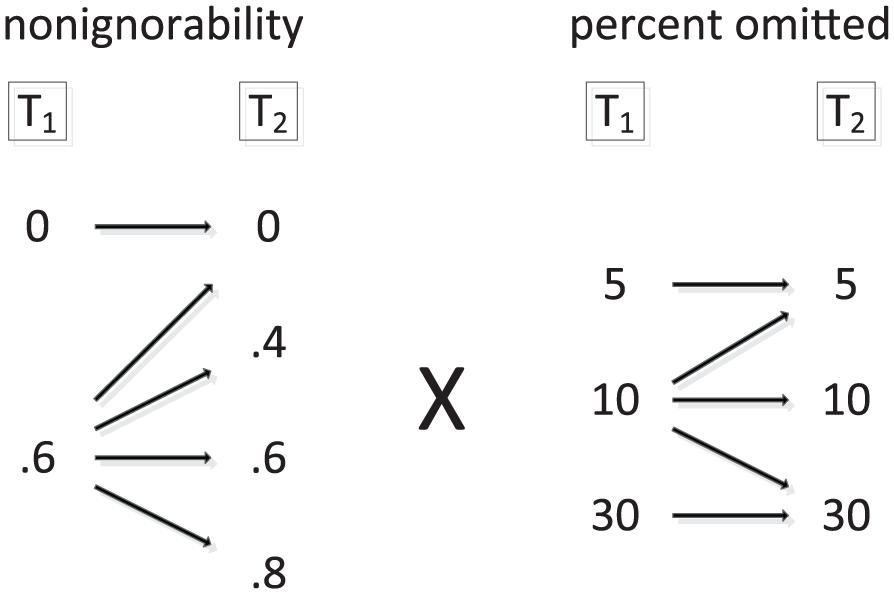
Simulation conditions: five levels of change in nonignorability (correlations between proficiency and omission propensity) crossed with five levels of change in mean percentages of omissions.
In each of the 25 conditions, we applied five different missing data treatments. These included two classical approaches typically used in LSAs as well as three recent model-based approaches with different assumptions about the missing process.
Scoring as wrong (M1): a unidimensional 2PL IRT model (Equation 1) in which omissions are scored as wrong. Concurrent calibration is used, and trends are estimated using a dummy-coded latent regression variable that represents the cycle (Equation 6).
Ignoring (M2): a unidimensional 2PL IRT model (Equation 1) in which omissions are ignored. Concurrent calibration is used, and trends are estimated using a dummy-coded latent regression variable representing the cycle (Equation 6). This approach assumes that missing values are MAR at both time points, and as such, the same missing data mechanism is assumed over time.
Model-based with concurrent calibration (M3): a two-dimensional (proficiency and omission propensity) 2PL IRT model (Equations 1 to 4). Concurrent calibration is used, and trends are estimated using dummy-coded latent regression variables representing the cycle (Equations 5 and 6).
Model-based with FCIP (M4): a two-dimensional (proficiency and omission propensity) 2PL IRT model (Equations 1 to 4). FCIP is used, and trend estimates are differences in group means.
Multigroup model (M5): a two-dimensional (proficiency and omission propensity) 2PL multigroup IRT model (Equations 7 to 9). Trend estimates are differences in group means.
M1 and M2 correspond to the “classical” approaches to missing data treatment, whereas M3, M4, and M5 belong to the group of model-based approaches. M1 is most similar to the operational approach in PISA, PIRLS, TIMSS, and other LSAs (see above), with the exception of the treatment of not reached items, which we did not consider in our simulation study. M3 is one of the recent approaches that have been well-investigated in the literature. However, in this approach, it is assumed that the missing data mechanism is the same across time points. In contrast to the other methods, approaches M4 and M5 allow for certain heterogeneity in the missing data mechanism across time. M4 and M5 are very similar but have their origins in different schools. M4 is set up using typical IRT approaches, whereas M5 derives from a structural equation modeling perspective. The main technical difference is that in M5, the group parameters are estimated jointly for both time points, whereas in M4, they are estimated successively, time point by time point or group by group. M1 to M4 were estimated in TAM (test analysis modules; Kiefer, Robitzsch, & Wu, 2015), whereas M5 was estimated in Mplus (Muthén & Muthén, 2013). The estimation in TAM was conducted by an expectation–maximization algorithm employing marginal maximum likelihood and the analyses in Mplus were conducted using maximum likelihood estimation with robust standard errors and numerical integration. 3
Evaluation Criteria
Our parameter of interest is the estimated difference in mean proficiency between the time points

Bias was defined as the mean deviation of the focal country’s trend estimation
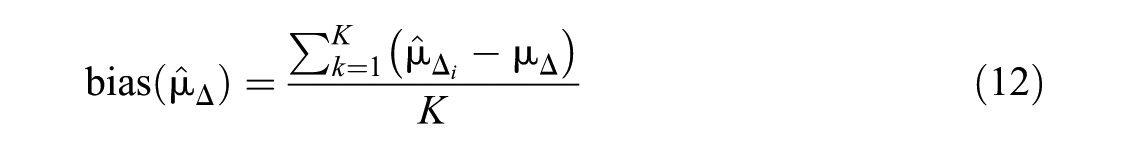
We further computed the standardized bias according to Collins, Schafer, and Kam (2001):

where SE denotes the true standard error of the trend estimate that is obtained from the standard deviation of the parameter estimates across all repetitions. Thus, bias is also reported in percent relative to the standard error of the parameter. As a rule of thumb, Collins et al. (2001) considered any standardized bias with an absolute value greater than 40% as practically significant because in these cases, the bias had a noticeable adverse impact on efficiency, coverage, and error rates. In addition, we marked results with an absolute standardized bias greater than 100%.
Results
The simulation study’s results for bias and the RMSE are shown in Figures 5 and 6.

Mean absolute bias across 500 replications for all conditions and models.Note. Graphs in the lower row are interrupted by a scale break (values between .2 and .6 are not shown). ρ = correlation between proficiency and omission tendency; mo = mean percentage of omissions; * = standardized bias >40; + = standardized bias >100.

Mean root mean square error (RMSE) values across 500 replications for all conditions and approaches.
Equal Nonignorability and Equal Percentages of Missing Values
In conditions with equal correlations between proficiency and omission propensity (equal level of nonignorability) and equal percentages of omissions at both time points, all methods worked equally well. There was no substantial bias (upper left of Figure 5), and the RMSE was low (upper left of Figure 6).
Changes in Nonignorability and Equal Percentages of Missing Values
When the level of nonignorability changed between time points, both bias and the RMSE visibly increased for approaches M1, M2, and M3 (upper right graphs in Figures 5 and 6). This was expected because all three approaches assume a constant missing data mechanism across time. The increase was especially pronounced when the level of nonignorability changed to an extreme degree from
When the amount of change in the level of nonignorability was realistic (.2 in either direction), and when it went along with a medium or high percentage of missing data (mo = 10% or mo = 30%), the trend estimates were always biased for conditions in which omissions were scored as wrong (M1). For ignoring (M2) and for the homoscedastic model-based approach (M3), bias and the RMSE visibly increased, especially when there were extreme changes in the level of nonignorability and a high percentage of missing values. There were no conditions in which the heteroscedastic model-based approaches M4 and M5, which allowed for changes in levels of nonignorability, exhibited substantial bias that exceeded the threshold values.
Equal Nonignorability and Changes in Percentages of Missing Values
The impact of changes in percentages of omissions was especially pronounced when missing values were scored as wrong (M1, lower left graphs in Figures 5 and 6). Results produced by M1 exceeded the threshold value of 100% in all conditions. The results of ignoring the missing data (M2) were affected by changes in percentages of missing values only when the missing data mechanism was nonignorable. This finding corroborates the findings by Köhler et al. (2017), who showed that when missing values were scored as incorrect or ignored, the parameter estimates were biased when the percentage of missing values was related to the group variable and when the missing data mechanism was highly nonignorable. For large changes in the percentages of omissions, the standardized bias exceeded 100%, and for small changes in the percentages of omissions, the standardized bias still exceeded 40%. Applying M3, M4, and M5 resulted in equally accurate estimates and did not lead to any substantial bias when the level of nonignorability remained unchanged. This is because these approaches allow the relations between omission propensity and proficiency to differ per cycle.
Changes in Nonignorability and Percentages of Missing Values
In conditions in which both the level of nonignorability and the percentages of missing values changed (lower right graphs in Figures 5 and 6), the differences between models were even more pronounced than in conditions where one of the two remained constant. First, scoring missing items as wrong (M1) resulted in highly biased estimates and exceeded a standardized bias of 100% in all conditions. The absolute bias could be greater than 1 logit in conditions with greatly changing percentages of omissions (from moT1 = 10% to moT2 = 30%) and in conditions with realistically changing levels of high nonignorability (
Study 3: Implications for Practice
To illustrate the practical implications and the effects of choosing different missing data approaches, we reanalyzed the Irish PISA trend data.
Sample and Test Design
We reanalyzed the Irish subsample of the PISA reading assessments in the years 2006, 2009, and 2012. We included all students with at least one valid response on the reading items, resulting in sample sizes of N2006 = 2,468, N2009 = 3,922, and N2012 = 3,439 students. The PISA reading assessments in 2006, 2009, and 2012 were presented as paper-and-pencil tests, and the items were arranged in multimatrix designs (Frey, Hartig, & Rupp, 2009). Of the 133 items, 30 items with no valid responses or with no variance were excluded from the analysis. We thus kept a total of 103 reading items, 26 of which were linking items between 2006 and 2009, 43 were linking items between 2009 and 2012, and 3 were linking items between 2006 and 2012. The data contained different types of missing values that are potentially nonignorable (i.e., omissions and not reached items). Detailed information on the missing data that we found in Ireland and the 35 OECD countries can be found in Table 2. Overall, the rate of omission was about 6%, which is below the OECD average of approximately 10%. Note that the percentages of missing data changed across the years.
Percentages of Different Types of Missing Responses for the Reading Domain in the Irish Data Sets (IRL) and the OECD Average in PISA.

Note. All values are in percentage. PISA = Programme for International Student Assessment.
Statistical Analyses
We applied the five different approaches that we evaluated in our simulation study to the Irish PISA data. Because the data contained not only omissions but also missing values due to not reaching the end of the test (Table 2), a missing data treatment for not reached items was added to each model. To emphasize this difference between the models in Studies 2 and 3, we named the models m1 to m5 in Study 3 instead of M1 to M5. In the first model (m1; Equations 1 and 6), all omitted items were scored as wrong, and not reached items were ignored in the estimation. In the second model (m2; Equations 1 and 6), all omissions and all not reached items were ignored. In m3 and m4 (Equations 1 to 6) and m5 (Equations 7 to 9), we added another variable to represent the number of not reached items as a predictor in the background models for predicting both proficiency and omission propensity (cf. Equations 5 and 6). To investigate the impact of the choice of the missing data approach, we compared the resulting differences in trend estimates for the five approaches.
Results
Table 3 provides an overview of the results. As described in the Introduction, the distinctive feature of the Irish reading data is that there was a sudden dip in mean reading competence in 2009 shown in the official PISA reports (OECD, 2016; Perkins, Cosgrove, Moran, & Shiel, 2012; Shiel, Kelleher, McKeown, & Denner, 2016).
Standardized Mean Differences in Irish Reading Data From Different Years Compared With 2012, Correlations between the Omission Propensity and Reading Literacy, and Regression Coefficients for the Regression of Proficiency on the Average Number of Not Reached Items Estimated using Different Missing Data Approaches m1 to m5.

We found that the missing data mechanisms changed across time in the data. The estimated correlation between omission propensity and proficiency in 2006
When omissions were scored as wrong (m1), the dip was, like the officially reported one, very large. Ignoring the omissions (m2) reduced the dip. When the nonignorable missing data mechanisms were modeled (m3 to m5), the dip found in the results in 2009 was still less pronounced and least pronounced when approaches were used to model the changes in the missing data mechanisms. This shows that the choice of missing data treatment can have a considerable impact on the results of an analysis and thus on the conclusions drawn from the data.
Discussion
Summary
In this study, we examined how changes in nonresponse mechanisms and omission percentages affect trend estimation under different missing data treatments in cross-sectional LSAs of student achievement. In sum, our results showed that changes in missing data mechanisms and percentages of missing data may occur in LSAs and that the approach to treating missing data can have a large impact on trend estimation.
First, our reanalysis of PISA data from 35 countries, three domains, and three cycles (Study 1) revealed that it is likely for mechanisms to change and also that percentages of missing data can vary between assessment cycles. We found considerable variability in nonresponse percentages and in correlations between the proficiency to be measured and the assumed latent omission propensity. This led us to conclude that assumptions of constant proportions of omissions and constant missing data mechanisms do not generally hold in practice. Furthermore, we found relatively high correlations between omission propensity and proficiency across all countries, domains, and cycles, suggesting that missing data due to omission were nonignorable in all data sets. Thus, not adequately modeling the missing data mechanism could affect results from all countries, domains, and cycles.
Second, on the basis of these findings, we designed a simulation study (Study 2) and compared different missing data treatments. Data were generated under the assumption of a latent omission propensity, which was correlated with the proficiency to be measured. The simulation study’s results showed that trend estimates can be considerably biased depending on missing data mechanisms and amounts of missing data unless these factors are accounted for in the missing data treatment. As expected, when the mechanisms and the amounts of missing data were not constant, the bias in our simulation study was highest when omissions were scored as wrong. In almost every condition, scoring missing values as wrong resulted in noticeably strong bias except when there were no changes in mechanisms and when the changes in percentages were small (5%) or nonexistent. Particularly when the amounts of missing data changed, the error produced by scoring omissions as wrong was very high. In the most extreme condition, the trend estimate increased by 650% relative to its standard error, and the bias exceeded 1 logit—that is, one standard deviation of the population proficiency distribution. This demonstrates that the choice of missing data treatment is highly relevant in trend estimation, especially when percentages of omissions and missing data mechanisms change, as we found when we used the nonsimulated PISA data from 35 countries in Study 1. As assumed, we also found considerable bias when the omissions were ignored and when we applied model-based approaches that did not contain additional parameters for modeling the changes in the mechanisms. Generally, when the missing data mechanism changed to an extreme degree (i.e., exceeding Δρ = .2), our results indicate that there are often severe problems with operationally applied missing data treatments frequently exceeding a standardized bias of 100% and more. When only the percentage of missing data changes and the missing data mechanism remains constant, substantial bias occurred only when missing answers were scored as wrong or were ignored. This confirms the findings by Köhler et al. (2017). In all conditions, model-based approaches that contained parameters for changes in mechanisms led to the most accurate results, a finding that is in line with the conclusions drawn by Kuha et al. (2018) about mechanisms that change between countries in survey data.
Third, the practical implications of our simulation study’s results were illustrated by comparing different missing data treatments in a reanalysis of the Irish PISA reading data (Study 3). We showed that the dip observed in 2009 was less pronounced when model-based approaches for nonignorable missing values and especially models that allowed for changes in mechanisms were employed. Thus, the choice of the missing data approach can substantially affect trend estimates. Provided that the nonresponse mechanism in the real data was similar to the one in our simulation study, the results of the model-based approaches that allowed for changes in correlations between proficiency and omission propensity were more correct.
Assumptions, Limitations, and Future Research
It is important to note that the validity of our conclusions from the simulation study for real-life settings heavily depends on whether the data-generating model used in the simulation mirrors the empirical situation. Which missing data approach is most appropriate depends on (a) which target ability is to be estimated and (b) which missing data mechanism is assumed (Pohl & von Davier, 2018; Tijmstra & Bolsinova, 2018). We take the view here of aiming to estimate effective ability given the chosen speed (van der Linden, 2007) and the chosen percentage of missing values. Concerning the missing-data-generating mechanism, we assumed a linear relationship between the proficiency to be measured and the omission propensity. Note that nonignorability may also occur when this relationship is not linear or when item omission depends directly on the true item response (Pohl & Becker, in press; Robitzsch, 2016). A special case of the latter missing data mechanism can lead to the extreme situation in which missing values occur only on items that would otherwise be incorrect. In this case, scoring missing values as wrong would be an accurate missing data treatment. However, such a missing data mechanism does not seem particularly likely in practice. Yet in empirical situations, the true missing data mechanism is unknown, and it is up to the researcher to make plausible assumptions. Future research could aim to further investigate the true nature of missing data mechanisms in various settings such as the sensitivity analyses conducted by Robitzsch (2016) or the qualitative study by Jakwerth and Stancavage (2003).
Furthermore, we assumed that the omission propensity was normally distributed and unidimensional. Köhler, Pohl, and Carstensen (2014) showed that a violation of the unidimensionality assumption hardly affects person parameter estimates, but a violation of the normality assumption can bias person parameter estimates to a greater extent. This finding is in line with research by Zwinderman and van den Wollenberg (1990), who investigated the effect of nonnormality on marginal maximum likelihood estimation in general. The categorical variable models proposed by Kuha et al. (2018) may be a good alternative to the model-based approaches that we used in our study when the omission propensity is not normally distributed or nonlinearly related to the proficiency dimension. Additional research could address in more detail whether our main conclusions also hold for different distributional assumptions.
Another limitation is that we did not vary the true trend. However, if there was a shift in true proficiency, the bias for scoring missing values as wrong would still be larger, even with the same correlation between proficiency and omission tendency and the same amount of missing data. This is because the approach performs differently for each time point. More potentially correct item responses would be scored as wrong when the average proficiency is high than when it is low because there are more correct responses in data with high than with low average proficiency. Furthermore, when there is a true trend, the FCIP method we used can lead to additional bias (Kim, 2006; Paek & Young, 2005; Sachse, Roppelt, & Haag, 2016), but it can simply be replaced by alternatives like mean–mean linking (Loyd & Hoover, 1980).
Implications for Real Data Analyses
The interaction of a true trend with changes in mechanisms and percentages of missing data may also explain some of the differences between the results of the simulation study and the results of the analyses of the real Irish PISA data. Comparing the results of the real-data analyses for Ireland with the results of our simulation study, an interesting pattern emerged: In the simulation conditions that were most similar to the Irish data, only scoring the missing data as wrong produced considerable bias, whereas the trend estimates under the other missing data treatments hardly differed from each other. In the real data, however, there was a difference in the trend estimates between all models. This may be due to additional differences between our simulation and the real data: (a) The nonresponse mechanism in the real data might differ from the simulated missing data mechanism, (b) we simulated only two time points, (c) the amounts of missing data and the nonignorability decreased in the real data, whereas they increased in the simulation, or (d) the simulation did not include any not reached items (and the treatment of not reached items differed between the approaches). Further differences between the reported Irish trend in the official PISA reports and our analyses could be due to the fact that we calculated the marginal trend (Gebhardt & Adams, 2007), which is free from sources of error due to country-specific differential item functioning that normally leads to additional errors in trend estimation when the original trend is estimated (Robitzsch & Lüdtke, 2018; Sachse & Haag, 2017). Certainly, the Irish data must contain many more idiosyncrasies that could potentially be responsible for the differences such as the fact that in 2009, school teachers rather than school inspectors administered the PISA tests (Perkins et al., 2012). However, what we did show is that there was a visible effect of the missing data treatment in the real data. For the purpose of trend estimation, when our main assumptions held, scoring missing values as wrong, ignoring them, or even applying simple model-based approaches that assume constant missing data mechanisms between time points may lead to bias. Trend estimates will change to some extent when a different approach is used to deal with missing data.
In conclusion, group difference and trend estimates in cross-sectional LSAs would be more accurate if, in addition to taking into account changes in percentages of missing data and changes in proficiencies, models would also take into account changes in the missing data mechanisms. Until now, this has not been done in operational practice in most LSAs (e.g., PISA, PIAAC, TIMSS, or PIRLS). We would suggest that researchers employ multigroup models similar to our M5, which led to unbiased trend estimates when the mechanisms were changing, provided that the true missing-data-generating mechanism is similar enough to the latent omission propensity described above. Because estimating group mean differences (e.g., between academic tracks or gender groups) is technically equivalent to estimating trends in cross-sectional assessments, all conclusions also hold for these scenarios. As we have shown that percentages of missing values in the PISA test data as well as the missing data mechanisms could vary considerably across countries, the choice of missing data approach should also heavily affect country rankings (see Robitzsch, 2016; Rose et al., 2010, for results when only varying percentages of missing values were modeled). This underlines the high relevance of this issue through its broad range of applications.
Footnotes
Declaration of Conflicting Interests
The author(s) declared no potential conflicts of interest with respect to the research, authorship, and/or publication of this article.
Funding
The author(s) received no financial support for the research, authorship, and/or publication of this article.