
Abstract
Student assessment nonparticipation (or opt out) has increased substantially in K-12 schools in states across the country. This increase in opt out has the potential to impact achievement and growth (or value-added) measures used for educator and institutional accountability. In this simulation study, we investigated the extent to which value-added measures of teacher quality are affected as a result of varying degrees of opt out, as well as a result of various types of nonrandom opt out. Results show that the magnitude of opt out and choice of classification scheme has a greater impact on value-added estimates than the type of opt-out patterns simulated in this study. Specifically, root mean square differences in value-added estimates increased as magnitude of opt out increased. In addition, teacher effectiveness classification agreement decreased as opt out magnitude increased. One type of opt out, where the highest achieving students in the highest achieving classrooms opted out, had the largest impact on stability than the other types of opt outs.
Introduction
Students choosing to not participate in annual summative assessments (hereafter “opting out”) is a relatively new phenomenon in United States K-12 education, with substantial increases in some states and districts over the past several years. Student participation in assessments has important implications: the scores are used for a host of instructional and accountability purposes, including student grade promotion or graduation and for accountability of teachers, schools, districts, and states.
Much of the literature related to opting out of assessments is based on recent news reports or press releases about which students were expected to participate in assessments, and who ultimately did. Reports about the characteristics of students who opt out differ across localities, with some states or districts finding that wealthy, higher achieving students opt out, such as in Oregon, while New York education officials reported that lower achieving students in relatively wealthy districts were slightly more likely to opt out.
Pizmony-Levy and Green Saraisky (2016) conducted a survey of approximately 1,600 opt-out activists in early 2016 as a means to better understand parent motivations for supporting the opt-out movement and for allowing their children to opt out. Average income of respondents was $125,000, compared with a median of $53,000 for U.S. households. In addition, 97% reported having completed postsecondary education, with almost 60% reported as having a graduate degree. Finally, 45% of respondents reported that they were teachers or educators, and another 16% reported having teachers or educators in their circle of friends.
Most activists reported positively about their own schools, either their child’s or the ones where they work. Sixty-eight percent responded they would give their own school an A or a B, which is more positive than the U.S. general public, whereas 51% gave schools in their community the same grades. The authors hypothesized that this could be due to one of two situations (or both): Activist respondents are wealthier, and have access to what most would consider better quality schools in their neighborhoods, and/or they reject the current popular notion that schools in the United States are failing.
According to Pizmony-Levy and Green Saraisky (2016), 44% of educators who took the survey reported that they did not support the use of test scores in teacher evaluation. Thirty-two percent reported that standardized tests force teachers to teach to the test, 22% reported that standardized tests take away valuable instructional time, and 25.8% did not support the implementation of Common Core State Standards. They also found that 63.3% of respondents reported opting all of their children out of a state assessment, and 11.2 opted some of their children out. Most of the parents also reported that they would likely opt their children out in the future as well (82.8% very likely; 9.3% likely).
Unverified media reports by the National Center for Fair and Open Testing (hereafter FairTest) (2015), reported that at least 14 states had nonnegligible numbers of students who chose to opt out in 2014-2015, ranging from approximately 4,600 in Pennsylvania to 240,000 in New York. FairTest, along with other organizations, had been advocating for students to opt out of the newly implemented national consortium assessments because some believe they are perceived as more difficult than previous assessments, thus leaving students and teachers uncertain about how they will perform (Clark, 2015). Opting out of a state assessment can have implications for many within the education community who rely on assessment results for decision-making purposes.
Student opt out is likely to affect accountability measures based on test scores, such as achievement measures used for school accountability or value-added measures used in teacher evaluations. Value-added measures purport to represent the extent to which students in a classroom grew in an academic year. In reality, they are the result of conditional status change calculations, which represent the extent to which a student and/or classroom changed in the distribution of similar students or teachers (Castellano & Ho, 2013). This change is then attributed to teachers for evaluation purposes. The comparative nature of these value-added models creates a situation in which student opt out can influence both the accuracy and stability of teacher evaluation measures, depending on several factors, such as the magnitude of opt out and whether opt-out patterns are considered to be nonrandom. Random opt out in large numbers could affect the standard errors of any measure created with student assessments because fewer students are likely included in the calculations. Value-added measures typically only include the students in a teacher’s classroom for that year, which is roughly 30 or fewer students in a given elementary classroom.
Nonrandomness driven by student-level characteristics may affect the accuracy of teachers with large concentrations of a characteristic. For instance, teacher value-added measures could be biased up or down if all English learners chose to opt out of the assessment, depending on how systematically different their performance is as a group from other students taking the assessment. Nonrandomness driven by classroom-, school-, or district-level characteristics could affect measures created for each level as well. For instance, value-added estimates could be biased if all higher achieving students concentrated in certain classrooms opt out of the assessment, because this essentially removes the upper end of the distribution of test takers. This would not only affect these teachers but would also likely affect teachers with no students choosing to opt out, because of the comparative nature of the value-added methodology.
In this study, we investigate the impact of nonrandom opt out on student achievement-based value-added measures used for evaluating teachers. Using simulated data generated from empirical data from one state, the magnitude of opt out is varied in teachers’ classrooms, as well as in the overall sample, to determine the impact on the stability of teacher evaluation measures. The nonrandomness of opt out is then varied by relating it to prior achievement in classrooms to determine the impact on teacher evaluation measures for those with and without opt-out students. We chose to simulate opt out as a function of prior achievement because early media reports found this to be true, though patterns varied by locale. Finally, the interaction between magnitude of opt out and nonrandomness is also varied.
Assessment Participation
Under Section 1111(2)(I)(ii) of the 2001 No Child Left Behind Act (NCLB), the United States Department of Education (USDE) required that 95% of eligible students participate in the Grades 3 to 8 assessments for English Language Arts (ELA) and Math at the aggregate and subgroup levels. This means that 95% of all eligible students were required to participate, as well as 95% within each of the federally protected subgroups, such as English language learners or students with disabilities. Overall and subgroup participation rates were calculated at the school, district, and state levels. Not included in participation rate calculations were the approximately 1% of students with the most significant cognitive disabilities, as long as these students took the state’s alternate assessment. As noted in policy guidance from the USDE in 2013, these participation requirements have historically been enforced by the USDE, with states providing regular retake opportunities for absent students (USDE, 2013). The Institute of Education Sciences (IES) found in 2007 that less than 1% of schools did not make their accountability targets because of the participation rate requirement.
State education agencies missing their 95% participation rate requirement can face sanctions such as a formal request to comply, a cease-and-desist order, or the withholding or suspending of Title I funds that are meant to support low-income students (Camera, 2015). States are not necessarily required to meet a 95% participation rate if they do not receive Title I dollars, which is a major policy lever for USDE. Under the new Every Student Succeeds Act (ESSA) passed in 2015, states are now required to factor low participation rates into school-level accountability ratings and to have some level of discretion over how they do so (Ujifusa, 2015b). Perhaps in preparation for this change, the USDE sent letters to 12 states to ensure that they had a plan to address low-participation rates in the assessment at the state, district, or subgroup levels (Klein, 2015).
Opt Out in the United States
According to Bennett’s 2016 research across states, the greatest proportion of opt out took place in New York, where it was about 20% in ELA and Math. Rhode Island, Colorado, and Maine all had rates higher than the 5% rule set by USED as part of NCLB. Bennett reports that the rate of refusal in high schools was also much higher than at the elementary grades. In Washington state the 11th grade refusal rate was 49% in ELA and 53% in Math, where over all grades, the rate was 2% and 3%, respectively. He also reports that the high school refusal rate was the primary reason states were put on alert by USDE for low-participation rates.
Oregon Department of Education officials reported that approximately 5% of students opted-out in 2014-2015, most of whom were nondisabled White students who traditionally perform well on the assessment (Hammond, 2015). After the 2015 assessment administration ended, Governor Kate Brown urged districts to work with parents to stress the importance of assessments and the potential implications of low-participation rates, while at the same time she signed a bill requiring districts to notify parents twice a year of their right to not participate in the state assessment (Ujifusa, 2015a). This bill also created two school ratings systems, one of which penalizes schools for low-participation rates, while the other does not.
In Delaware, 10% of high school juniors statewide did not participate in the assessment in the 2014-2015 school year (Albright, 2016). A bill designed to allow students to opt out of the state assessment was vetoed by the governor, even after gaining support from the Delaware Teachers’ Union and the State House of Representatives. In New Jersey, where the percentage of students opting out was reportedly just under 10%, a bill was introduced in the state legislature that would allow parents to provide written notice to the school that their child would not be sitting for the assessment (Walker, 2015). The bill, however, was not considered when the senate acted on other legislation related to the state’s participation in Partnership for Assessment of Readiness for College and Career assessments (Clark, 2015).
In 2013, as opt out momentum grew across the state, New York State Education Department (NYSED) officials issued guidance to superintendents and principals of all public schools stating that there was no statute or regulation specifically related to allow students to opt out of the assessment (Katz, 2013). In the guidance, NYSED officials stated that taking state assessments is considered part of the “course of study” and that opting out could negatively affect their child’s school or district accountability standing.
According to media reports cited by NYSED, the percentage of students statewide choosing to opt out from the New York state assessment was at its highest level ever in 2014-2015, at approximately 20%, with estimates as high as 90% in some districts on Long Island and in the eastern part of the state (NYSED, 2015). This represented approximately 240,000 fewer students taking the Grades 3 to 8 assessments in ELA and Math According to NYSED, opt-out students statewide were more likely to come from average or low-need districts, and were more likely to receive scores in the lowest two achievement levels in ELA or Math (NYSED, 2015). Opt out at the high school level in New York was not reported on or studied, because students need to complete a series of Regents exams to graduate—and the test-taking pattern varies by district, school, and even student.
American Institutes for Research (AIR, 2016) compared value-added measure results with and without opt out effects and found similar results for the complete model (i.e., 2013-2014 model with complete data) and after excluding the nonparticipation students from 2014-2015 (incomplete opt-out model). They found very similar results between the models. The R-square was approximately 0.7 across grades, with differences no larger than .01 between the complete and incomplete models. At the student level, the root mean square of the difference between the two model predictions was never larger than 0.5, which translated to one half of one scale score point. The correlation of growth percentiles at the student level for those with student growth percentiles was 0.999 in the complete and incomplete models.
AIR (2016) also calculated teacher mean growth percentiles (MGP) in 2013-2014 with and without nonparticipating students in 2014-2015 and found they correlated about 0.98, suggesting a strong linear relationship between them. They concluded the relationship between the change in a teacher’s MGP and classroom characteristics was not large and/or systematic for most characteristics. Teachers with large positive changes in MGP tended to have lower proportions of economically disadvantaged students. Similarly, large positive changes in MGPs were also related to lower nonparticipation rates.
According to AIR, 82% of teachers were expected to receive the same classification rating used by the state under both models as a result of opt out, 3.7% were expected to increase one rating category, 4.3% were expected to decrease one rating category, and about 0.1% were expected to move both up and down by two rating categories. Almost 3% of teachers would have expected transitions from the top two categories in the complete model to the bottom two in the incomplete model (without opt-out students).
Classification agreement between the complete and incomplete model effectiveness ratings across all teachers was high—at 93%. This is higher than the expected rate of classification agreement AIR reported in the previous section. Teachers in categories of consequence, however, had lower agreement—only 80% of teachers in the bottom two rating categories in the complete model remained in the same category in the incomplete model. Similarly, 90% in the top two categories in the complete model did not change categories in the incomplete model.
Rice, Marland, and Meyer (2016) found that lower achieving students, based on prior achievement scores, in higher achieving districts were more likely to opt out in their analysis of 28 districts in New York. In addition, there was variance across districts in the types of students who were more likely to opt out. Higher achieving students were more likely to opt out in some districts, while lower achieving students did in others. NYSED, like many state education agencies, uses assessment scores for a host of accountability purposes, including status and growth measures.
Opt Out Regulations and Legislation
Thirty states and the District of Columbia currently have specific legislation that would compel students to take state assessments (Croft & Lee, 2016). An additional five states allow for exemptions, such as in Oregon where students can exercise a religious exemption, which is one of several available exemptions to students in different states. Other exemptions include physical disability, medical reasons, or emergencies. Five states do not have explicit opt-out policies, but allow districts or schools to create their own, eight states have no formal policy and do not promote opt out by notifying parents about their rights, and two states allow for opt outs and notify parents. In the wave of 2015-2016 legislation spurred by the increase, most of which were not successful, bills were typically crafted outlining the opt-out process, including parent notification and how parents could request an exemption. For the most part, guidance to parents typically cites Section 111 of NCLB, which states students should take part in the state assessment.
Introduction to the Present Study
Although some important research in the area of opt out has been done, it is still unclear whether specific types and magnitudes of opt out have effects on teacher evaluation. Thus, the purpose of the current study is to consider the extent to which teacher value-added estimates are affected by the magnitude of random and nonrandom opt-out patterns, as well as by the relationship between opt out and prior achievement. The specific questions addressed were the following:
What is the impact of opt out on value-added measures of teaching effectiveness?
a. How does opt out in different magnitudes within a teacher’s classroom impact value-added measures? b. How do varying degrees of relationship between opt-out patterns and prior achievement impact value-added measures?
What is the impact of opt out on teacher effectiveness classifications?
Method
A simulation study was conducted to examine the amount of bias introduced into value-added estimates under various opt-out conditions and to determine the extent to which opt out affected classification of teacher effectiveness. The details of the simulation are described next. Essentially, observed scale scores were simulated to represent students’ test scores on a typical statewide assessment for four grades, hereafter referred to as Grades 3, 4, 5, and 6. The probability of opting out was simulated using parameter estimates from empirical data. Students were then identified for deselection from the analysis randomly, based on the probability of opting out of the assessment, and based on their prior achievement. Grade 6 observed value-added estimates were calculated in separate models using Grades 3, 4, and 5 as conditioning years and with a shrinkage estimator applied to account for small numbers of students included in the estimates.
The data were generated using a multivariate sampling approach from Castellano and Ho (2015) to produce a nested structure observed in real data; that is, students nested within classrooms. Furthermore, to simulate realistic data, the parameters in this simulation were based on real test data from empirical analysis from one state. Correlations and root mean square differences (RMSDs) were investigated across conditions to better understand the extent to which error is a function of opt out. Two state approaches were used to classify value-added estimates to determine rates of agreement between complete and incomplete value-added estimates across replications for every classroom.
Empirical Data
Four years of empirical assessment and demographic data for 32,722 students in Grades 3 to 8 in 122 schools in 28 districts in one state were made available to generate parameter estimates for this simulation study. The included school years spanned 2011-2012 to 2014-2015. Because these data represent a subset of the state, we compared several generating parameter estimates with publicly available data from the state’s website. As mentioned, we generated sixth-grade scale scores in Math, so we restricted the subsample data to only those students, which resulted in 8,023 students (Table 1). This is approximately 4% of the state’s total sixth-grade population.
Descriptive Statistics for Sixth-Grade Math in Sample and Statewide.
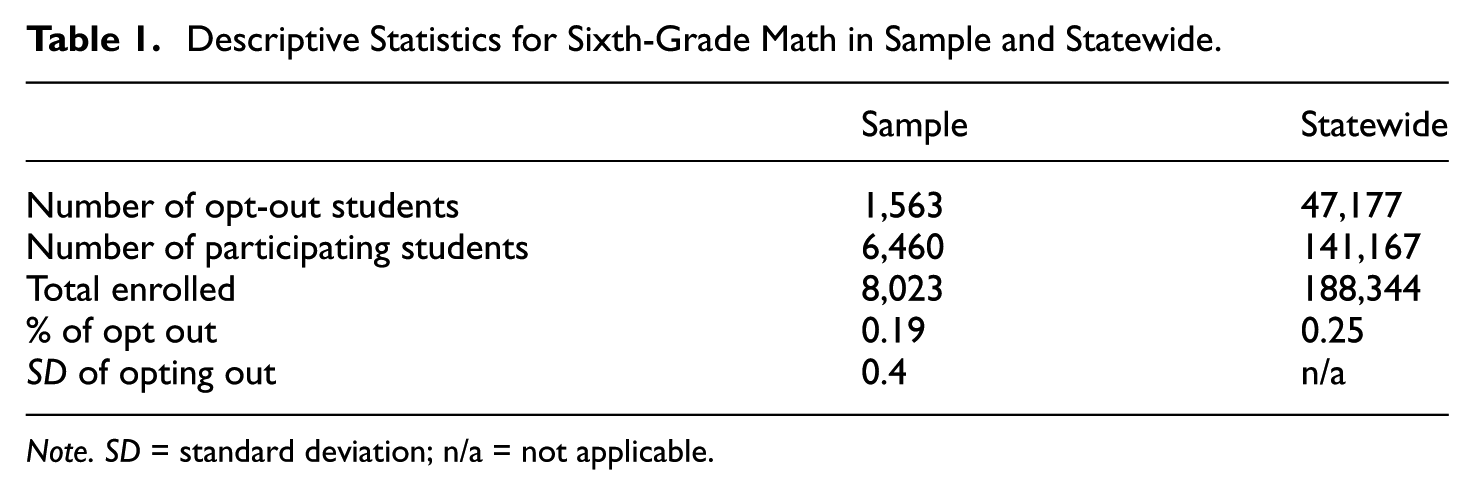
Note. SD = standard deviation; n/a = not applicable.
Identifying Students as Opt Out in Empirical Data
As part of the requirements under the evaluation process in this state, each district must report to the state teacher–student linkage information that identifies a teacher-of-record for every student. Also included are the number of minutes a student is in a teacher’s classroom during the course of the year. The state uses this information when calculating growth measures for use in evaluation and returns to each district a data file with a reason for why the student was or was not included in growth calculations.
Using the empirical data provided by the state, students were considered opt outs if they were linked to teachers for the entire year but had no valid current year test score. This means that the student was in a tested grade and linked to a teacher but had no valid test score for the same year. Students who did not meet minimum enrollment and attendance duration requirements were dropped from analysis, unless they were also identified as not having a valid current year test score, in which case they were also considered opt outs. Using this approach does likely slightly inflate the percentage of opt out, because it includes students who could have received a medical exemption from the state. All students with valid test scores were considered test-takers for the purposes of the analyses.
Data Generation
Generating Observed Scale Scores
Scale scores were generated using a multivariate normal sampling approach used in Castellano and Ho (2015) and with parameter estimates from empirical data, where within- and between-classroom deviations were sampled from multivariate distributions and summed to create student-level observed scores. This sampling allowed observed scale scores to be generated for each student in a classroom with the addition of a common classroom effect. The multivariate sampling procedure begins with Equation 1:

where
In Equation 2, we have the multivariate sampling procedure for within-class deviations:
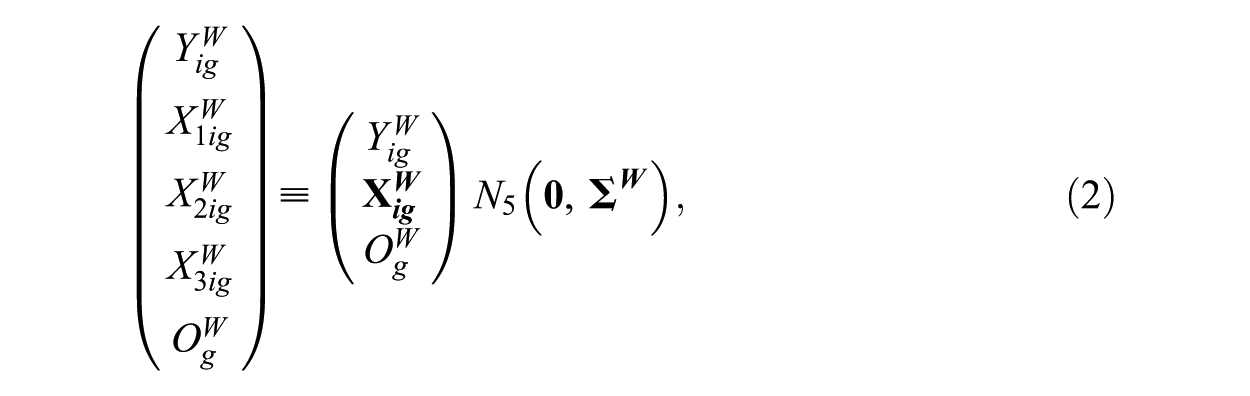
where


where
Data generation required the use of student- and teacher-level correlations of scale scores across years, the student-level standard deviation of scale scores, and the intraclass correlation (ICC) observed in real data, which is the proportion of the variance attributed to classroom-level differences in scale scores. Intertemporal correlations of scale scores at the student level were set to 0.85 between adjacent years, 0.83 for scores with a 2-year lag (i.e., current with 2 years prior, 1 year prior with 3 years prior), and 0.75 for scores with a 3-year lag (i.e., current with 3 years prior).
For generating the probability a student opts out, we used the student-level correlation between the dichotomous indicator for opting out from the empirical data and the immediate prior year scale score, the correlation between average prior achievement and percent of students opting out in a classroom, the student-level standard deviation of the dichotomous indicator for opting out, and the ICC of opting out. The dimensions of the correlation matrix that includes scale scores and probability of opting out, denoted as
Using the administrative data, correlations across years at the teacher-level were set to 0.90 for adjacent years, 0.85 for scores with a 2-year lag, and 0.80 with a 3-year lag. The correlation between average prior achievement and the percent of students opting out in a classroom was set to −0.05. These correlations are expressed in a 5 × 5 matrix denoted as
First, the total variance–covariance matrix,

Next, the between-classrooms variance–covariance matrix,

The difference between these two matrices results in the within-classroom variance–covariance matrix

Estimating Value-Added Measures of Teacher Quality
To estimate value-added measures of teacher quality, we used a common method also used in Guarino, Reckase, Stacy, and Wooldridge (2014) that estimates a teacher effect through the use of dichotomous indicators for each of the 1,000 teachers. The model is parameterized as follows:

where

where

Simulation Conditions
As mentioned, the mean probability of opt out was set to 5%, 10%, and 20%, which is meant to simulate realistic, varying degrees of opt out in the data. We simulated 100 data sets for each condition, for a total of 300 data sets. In each data set, students were chosen for opt out (or deselected from analysis) randomly (Condition 1 below), based on their probability of opting out generated in the previous steps (Condition 2), or based on their place in the prior achievement distribution (Conditions 3 and 4). There are four conditions for each magnitude of opt out that simulate possible real-life scenarios across states.
Random: Refers to students who were dropped randomly from analysis. Including a random opt-out condition serves as sensitivity check for our other conditions, against which we can compare our other nonrandom conditions;
Highest probability: Refers to the condition where students were dropped based on the probability of opting out, which was predicted using prior achievement from the actual state data. Students with the highest probability of opting out were selected until we reached the desired magnitude. This condition most closely mirrors a real opt-out condition because it is based in empirical data, though we recognize students with the highest probability in reality may not all choose to opt out;
Lowest achieving: Refers to the condition where 50% of opt-out students had the lowest prior achievement in the top quartile of prior achievement of all classrooms, and the other 50% of opt-out students were randomly selected from the other three quartiles. This was meant to simulate a situation where a high percentage of students might feel pressured to opt out, because they may be considered the lowest achievers in their high-achieving classrooms.
Highest achieving: Refers to the condition where 50% of opt-out students had the highest prior achievement in the top quartile of prior achievement of all classrooms, and the other 50% of opt-out students were randomly selected to opt out. This was meant to simulate the highest achievers in high achieving classrooms deciding to opt out because they do not need the “signal” a state assessment provides.
Additionally, magnitude when applied to a condition, refers to the 5%, 10%, and 20% opt-out conditions that were simulated for each of the four opt-out conditions.
Value-added estimates were calculated once with all students in the analysis for the 100 complete data sets, and once for each of the four conditions with students deselected from analysis. This results in 500 value-added estimates of effectiveness for teachers: one complete value-added estimate, and four “incomplete” based on opt out simulation conditions.
The number of students associated with teachers was varied to have a mean of 30 and standard deviation of 10, which mirrors a typical elementary school classroom in the empirical data. The minimum classroom size was 1 student and the maximum was 63. However, as noted later, classrooms with fewer than 11 students were excluded from stability analysis, because states and districts often set a minimum number of students required to receive an effectiveness rating. Excluding classrooms smaller than 11 students limits inferences in this study to general education settings, because inclusion classrooms typically have fewer than 10. The total sample size of students per replication was approximately 30,000, and the total sample size of teachers per replication was 1,000.
The stability of the complete and incomplete value-added models was examined by calculating the RMSD between the incomplete and complete value-added models across replications from AIR (2016) in Equation (12):
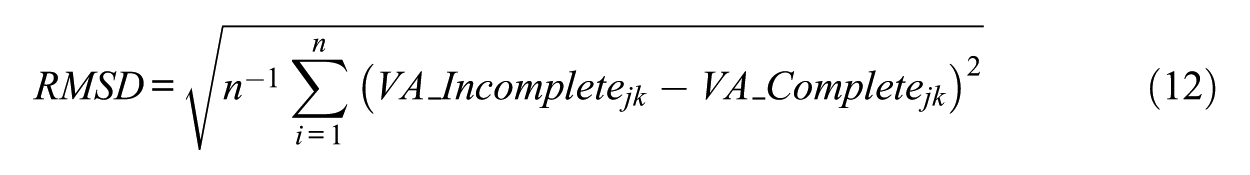
The difference between the incomplete and complete VA estimate was calculated for each classroom, j, as well as k replications (k = 1, 2, . . ., K), where K = 100. The result will be on the value-added scale, which is represented in student standard deviation units. We also calculated the RMSD between value-added estimates obtained under the missing at random condition and estimates from the other four missing not at random conditions.
Last, to investigate the practical implications of opt out on value-added estimates, we classified teachers into four rating categories using two state approaches, New York and Florida, with teachers classified based on their complete and incomplete value-added estimate for each of the data sets as a means for comparison between the two states. The states were chosen because their approaches are fairly different in how far above or below average a teacher needs to be to be classified into a rating of consequence; however, both require the use of confidence intervals. We also used New York’s approach to classification because AIR (2016) provided classification agreement statistics against which we can compare. The number and proportion of classifications in agreement between complete and incomplete value-added estimates across all replications and conditions were calculated.
Results
Data Generation
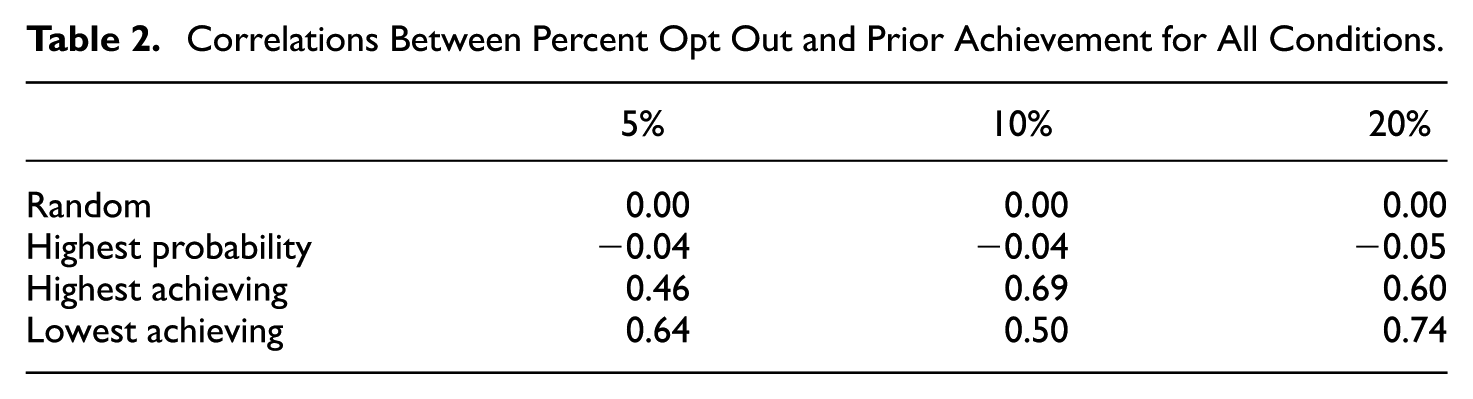
As a first check, we review simulation diagnostics to ensure the data generation process performed as expected and to support in understanding how prior achievement is related to opt-out patterns. In Table 2, correlations between percent opt out in a classroom and average prior achievement are listed. Correlations are zero in the random condition across all magnitudes, and −0.04 to −0.05 in the highest probability condition (by design). In the other two conditions, the correlations between prior achievement and percent opt out in a classroom are much higher, which, as mentioned, was intentional to create extreme scenarios.
Correlations Between Percent Opt Out and Prior Achievement for All Conditions.
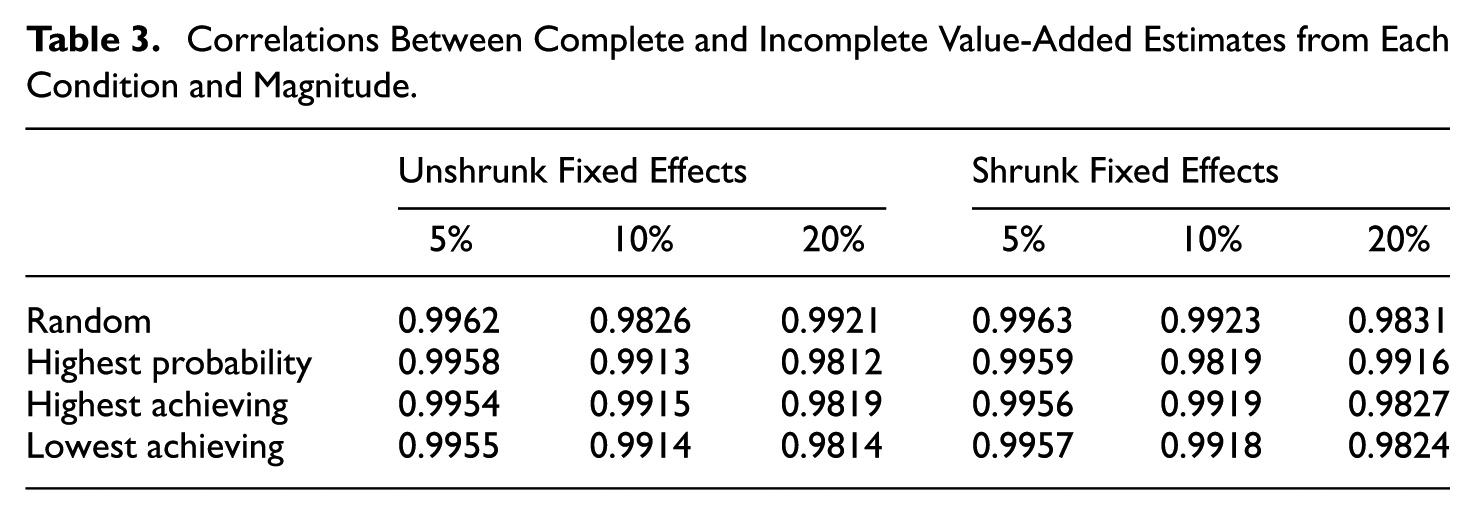
Correlations Between Complete and Incomplete Value-Added Estimates from Each Condition and Magnitude.
RMSD for Unshrunk and Shrunk Fixed Effects for Each Condition and Magnitude.
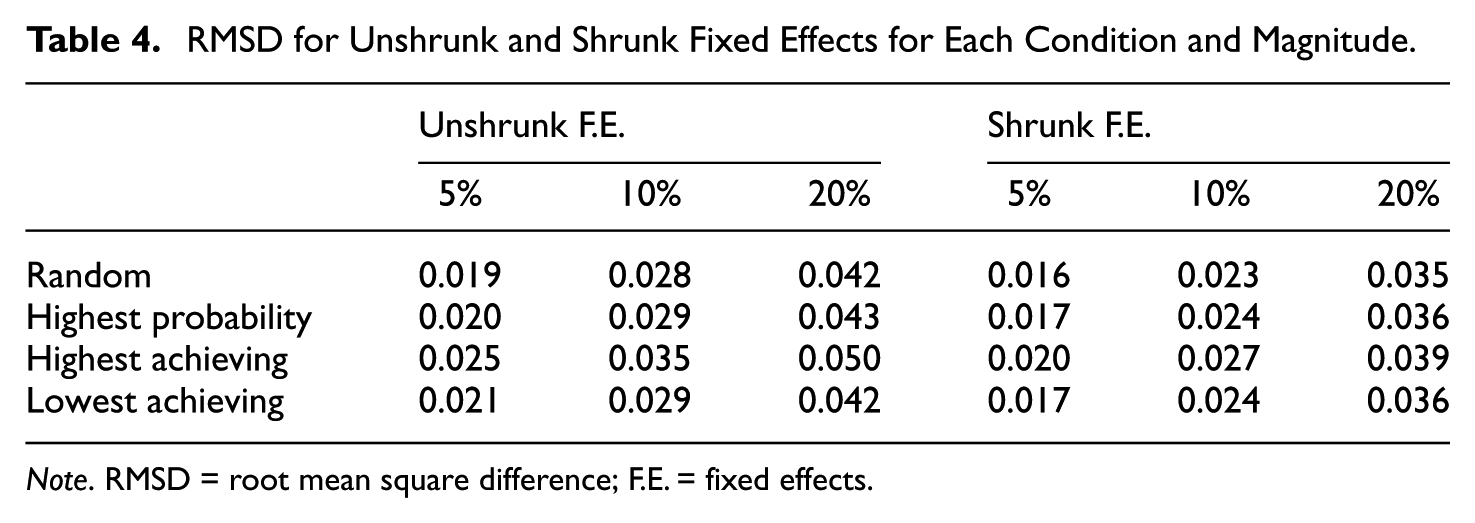
Note. RMSD = root mean square difference; F.E. = fixed effects.
Value-Added Classification Rules for Florida (FL) and New York (NY).
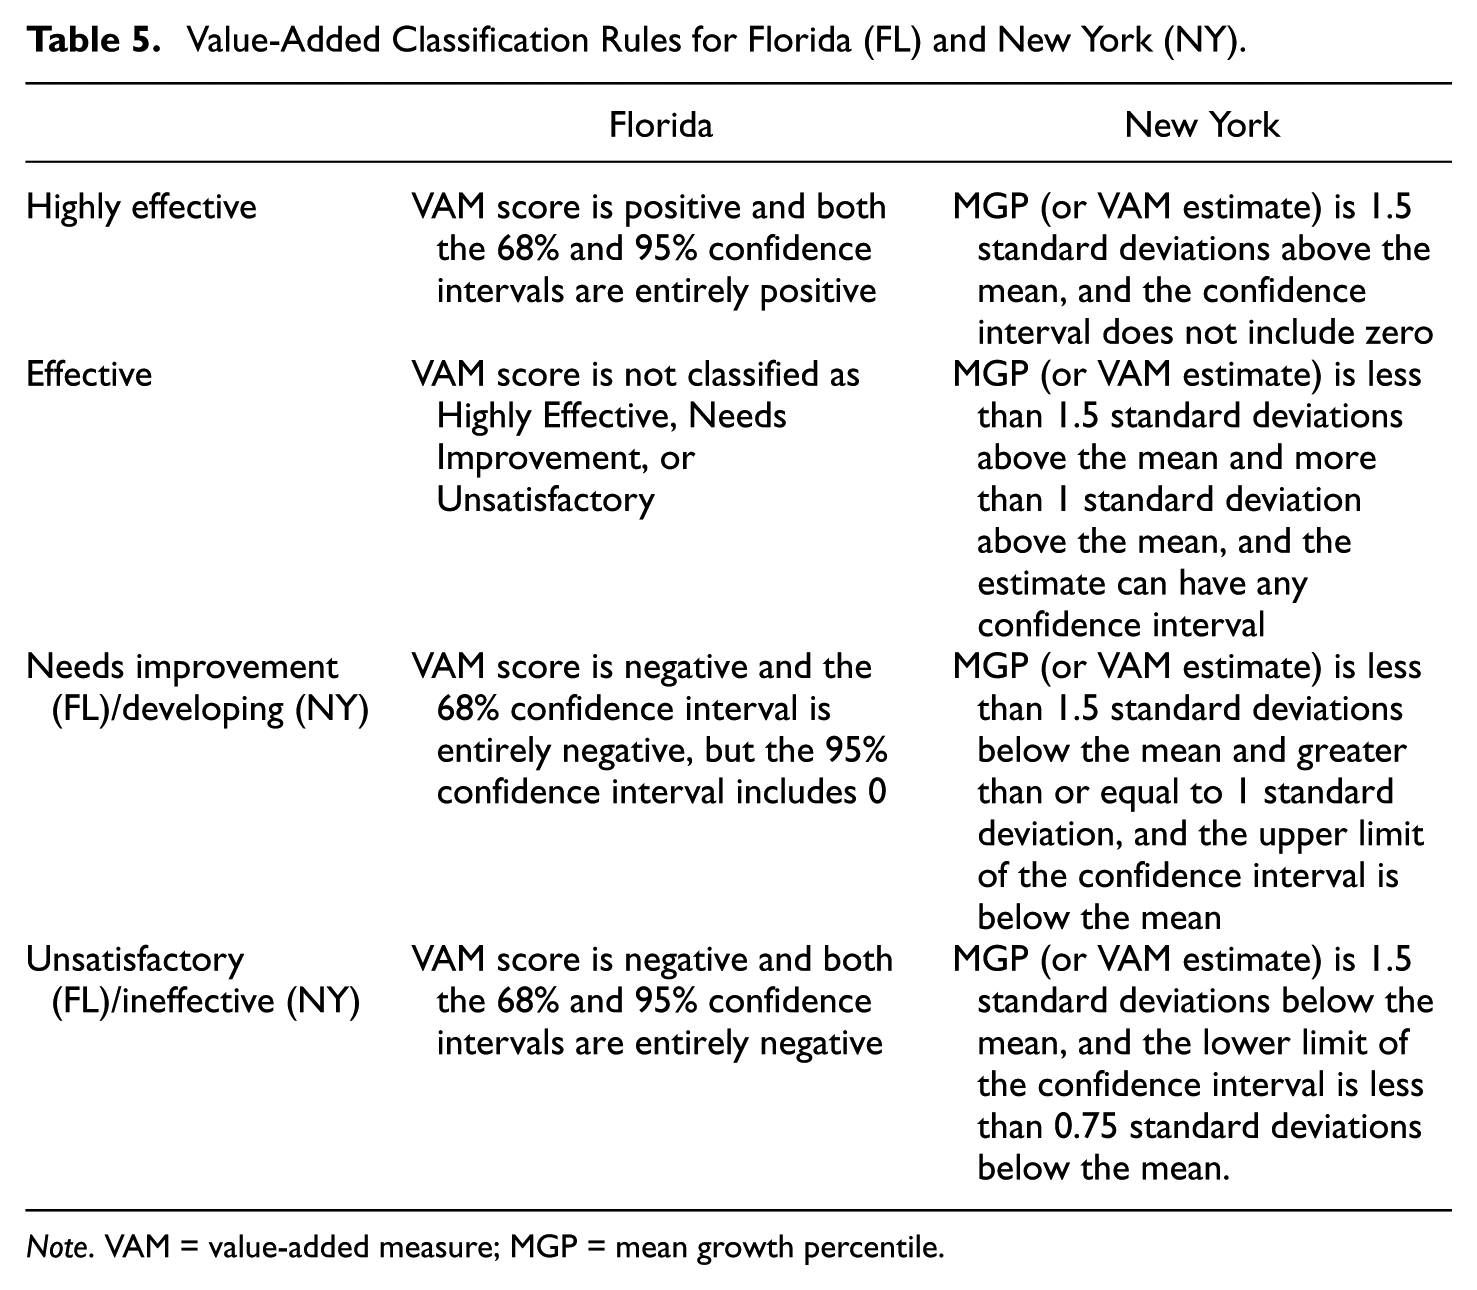
Note. VAM = value-added measure; MGP = mean growth percentile.
The standard deviation of unshrunk fixed effects (hereafter referred to as unshrunk F.E.) ranged from 0.22 to 0.25 across magnitude and opt-out conditions. For shrunk fixed effects (hereafter referred to as shrunk F.E.), the standard deviation ranged from 0.18 to 0.20. Correlations between average prior achievement and unshrunk fixed effects, as well as shrunk fixed effects, ranged between 0.07 and 0.08.
Stability of Value-Added Estimates
Correlations
As a first step toward investigating stability of value-added estimates, we calculated the Pearson’s correlations of complete estimates with the incomplete estimates from each of the four opt-out conditions and three magnitude conditions, for a total of 12 correlation coefficients. In Table 3, we see that the correlations are all higher than 0.99 for the 5% and 10% magnitude conditions. The correlations range from 0.97 to 0.98 for the 20% condition, which is only slightly lower than the other two magnitudes. These results suggest the estimates are stable.
Root Mean Square Difference of Value-Added Estimates
As outlined in the Method section, we calculated the RMSD between the complete value-added estimates with all students included, and for the incomplete value-added estimates for each opt-out condition (4 conditions) in each of the three magnitude conditions. The RMSDs for the random condition serve as a baseline, by which we can compare estimates from the other three conditions to determine the extent to which the simulated nonrandomness impacts the estimates.
As we see in Table 4, RMSDs increase in each condition as the magnitude of opt out increases for both unshrunk and shrunk estimates, with slightly smaller RMSD for shrunk estimates. We see an average of 0.016 to 0.025 for the 5% magnitude condition across replications, 0.023 to 0.035 for the 10% condition, and 0.036 to 0.050 for the 20% condition. An RMSD of 0.05 in the 20% condition represents an average difference in value-added estimates of almost 0.25 of a standard deviation (Table 2), which is sizeable. This can be interpreted to mean that a teacher could expect to move up or down 0.25 of a standard deviation in value-added estimates if 20% of students opt out.
Across opt-out conditions, we see that RMSDs are fairly consistent, with the exception of the highest achieving condition, where we see a slight increase over the random condition. This increase of approximately 0.004 to 0.008 in RMSD across each magnitude of opt out is fairly minimal, but does represent a difference that is due to this type of nonrandomness, where 50% of the students opting out are the highest achieving in the highest achieving classrooms. Figure 1 demonstrates that average prior average prior achievement is fairly constant across the percent of opt out in all conditions, except in the highest achieving condition. Here, we see that average prior achievement increases as percent opt out increases, which is by design as part of the simulation. Figure 2 demonstrates for each condition how the difference in value-added increases as the magnitude of opt out increases. The difference in value-added is fairly consistent across the percentage of opt out except for the highest probability condition, which we might expect given the simulation design. The student-level probability of opting out was calculated using the student-level correlation with prior achievement, as well as the correlation between average prior achievement in the classroom and the percent of students opting out.
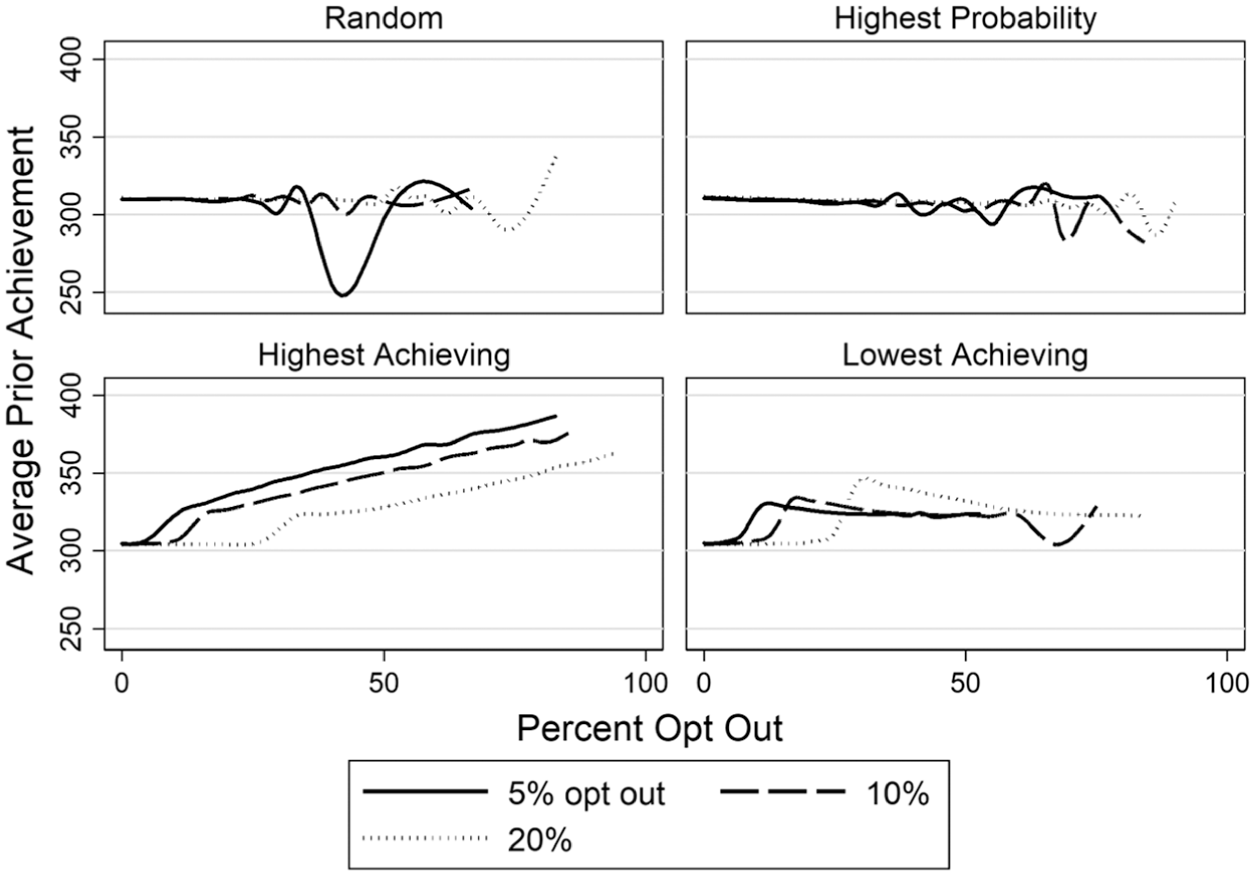
Average prior achievement by percent opt out by magnitude and condition (mspline smoothing, bands = 25).

Difference in complete and incomplete value-added estimates by percent opt out: All conditions (mspline smoothing, bands = 25).
Classification Agreement
As a final investigation into the stability of the value-added estimates, and one that would have the most direct consequences for teachers, we classified the complete and incomplete fixed effects into “effectiveness” categories of teachers used by two states—Florida and New York (see Table 5). We then calculated the percentage of teachers where the complete and incomplete rating were in agreement. We discuss the results of each state in more detail next. In Table 3, we see that classification agreement using Florida’s approach is similar across opt-out conditions and increases as the magnitude of opt increases for both unshrunk and shrunk fixed effects estimates. For instance, in the 5% opt-out condition where we use unshrunk estimates, teacher effects are classified the same 94% of the time. This means that the teacher would receive the same rating in the no opt-out condition and the one where approximately 5% of students opt out of the total sample. However, the percent of classification agreement decreases as the magnitude of opt out increases, where we see that approximately 13% to 15% of teachers would receive a different rating in Florida if 20% of students opted out, depending on the type of opt out.
We also see in Table 6 that there is essentially no difference in classification agreement when shrunk fixed effects estimates are used, when compared with the unshrunk estimates. Classification agreement is also slightly higher for the highest and lowest achieving conditions, which may not be an intuitive result. This increase could be due to the lower number of teachers receiving ratings in these two conditions. We investigate in a later section. Last, classification changes were typically ±one rating category for all conditions and magnitudes. The average percentage of teachers changing more than category was less than 0.1% across.
Average Number and Percent of Teachers Remaining in Same Rating Category—Florida Classification System.
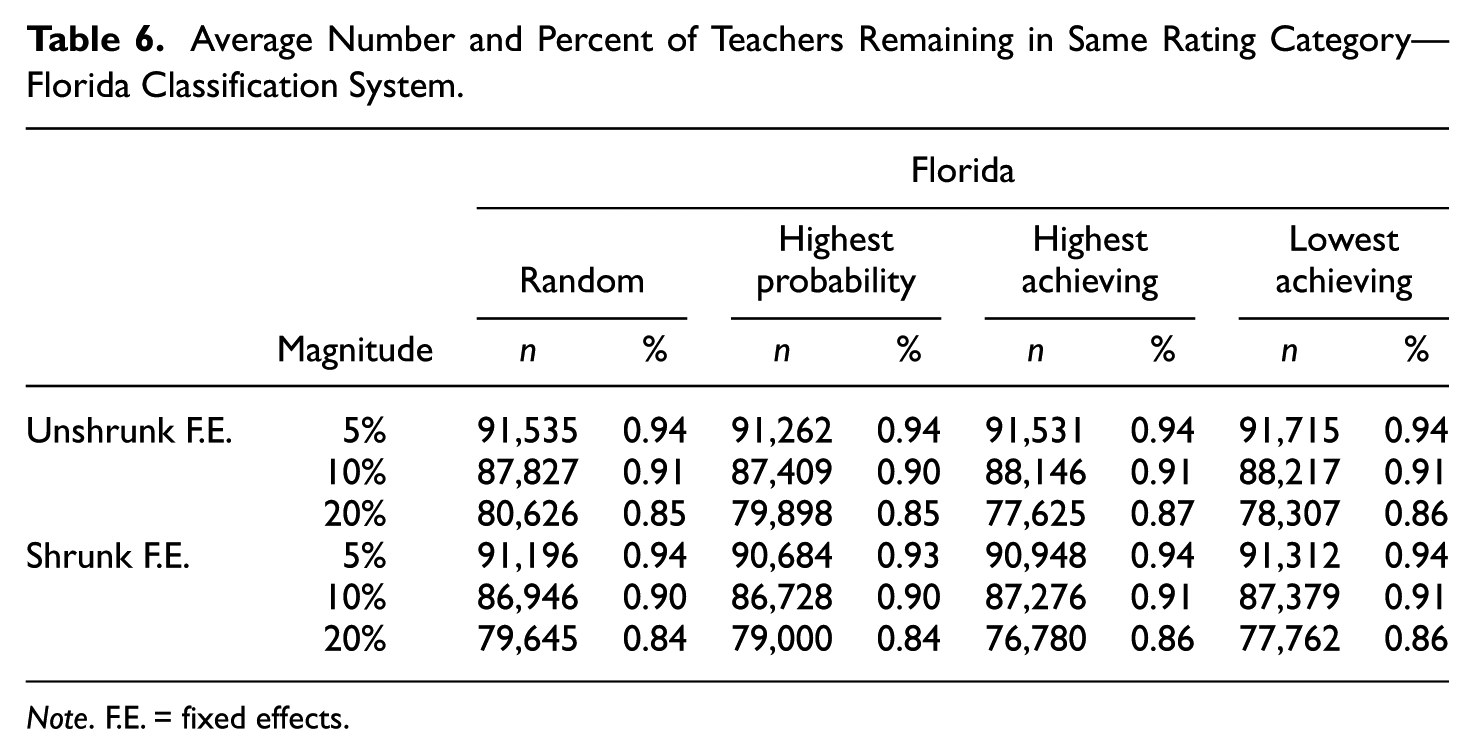
Note. F.E. = fixed effects.
Results using New York’s classification approach are presented in Table 7, where we see similar results to the Florida approach where classification agreement is similar across opt-out conditions. However, on average, agreement is slightly higher across all conditions and magnitudes. This is likely due to more rigorous classification rules for what constitutes as different from average that would lead to a rating of consequence. One noticeable difference from the Florida approach is that agreement is lower when shrunk estimates are used for classification, when compared with the unshrunk estimates. Agreement is approximately 4 to 5 percentage points lower when shrunk estimates are used across all magnitudes and conditions. The lower agreement could be due to the increased standard errors that are used in creating confidence intervals and the more rigorous rules for classification into rating categories.
Average Number and Percent of Teachers Remaining in Same Rating Category—New York Classification System.
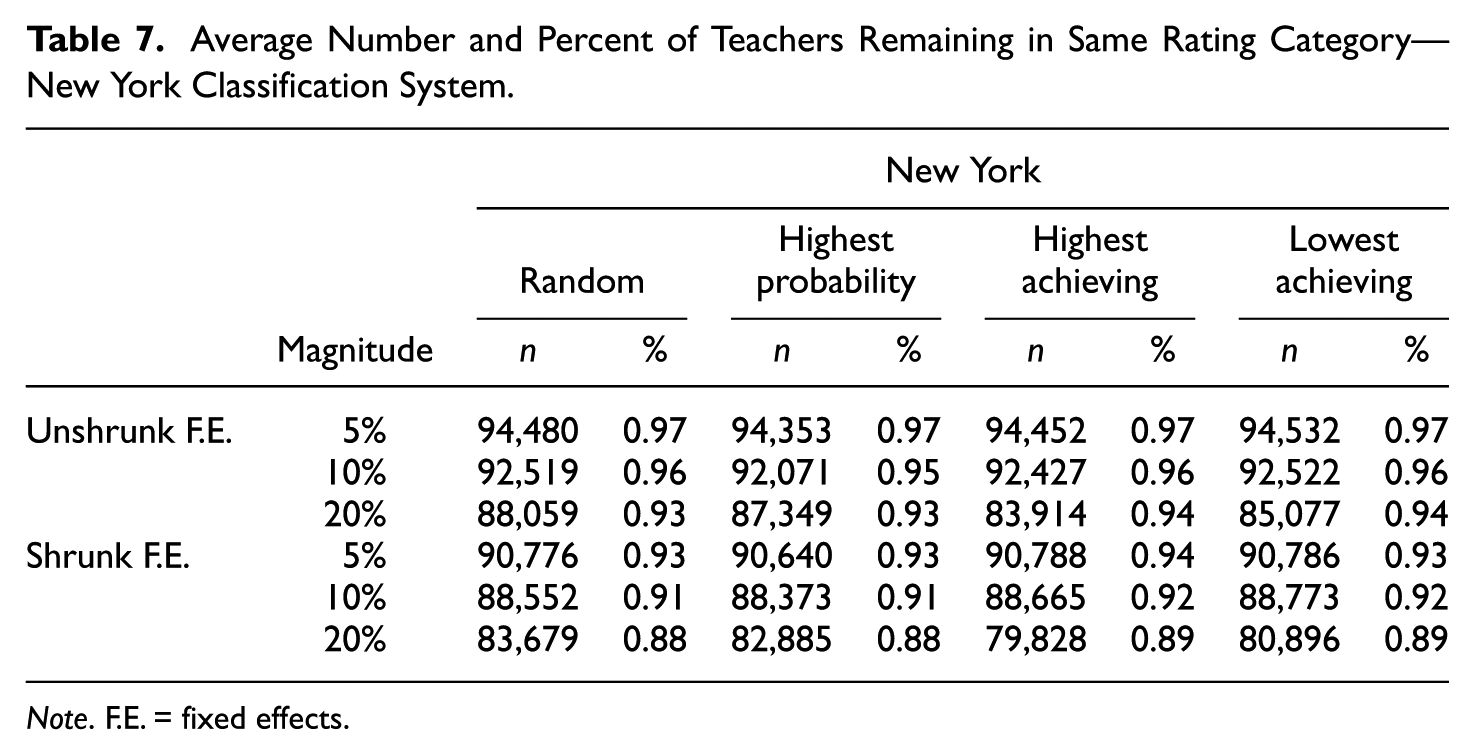
Note. F.E. = fixed effects.
Classification Agreement by Prior Achievement Quartile
As a further investigation into classification agreement, we also calculated agreement by prior achievement quartiles, because we might expect that those with higher achieving students or classrooms to receive different ratings. As a reminder, in the higher achieving condition, 50% of excluded students were the highest achieving in their high-achieving classrooms. In the lowest achieving condition, 50% of excluded students were the low-achieving in high-achieving classrooms. We expect two possible outcomes for these teachers, the first of which is they would not receive ratings because they were more likely to have higher magnitudes of opt out. The second is they may receive different ratings because their relative rank in the distribution changed. In Table 8, we see teachers of higher achieving students would have lower classification agreement if those same students had chosen to opt out. Using shrunk estimates in Florida’s approach where 20% of students opt out, we see that about 70% of teachers would receive the same rating in the highest and lowest achieving conditions. The percent agreement for top quartile teachers increases using New York’s approach to 81% for both conditions. Results are fairly similar across conditions and across prior achievement quartiles.
Percent of Teachers Remaining in the Same Rating Category by Prior Achievement Quartile (20% Condition)—Florida and New York Classification Approaches.

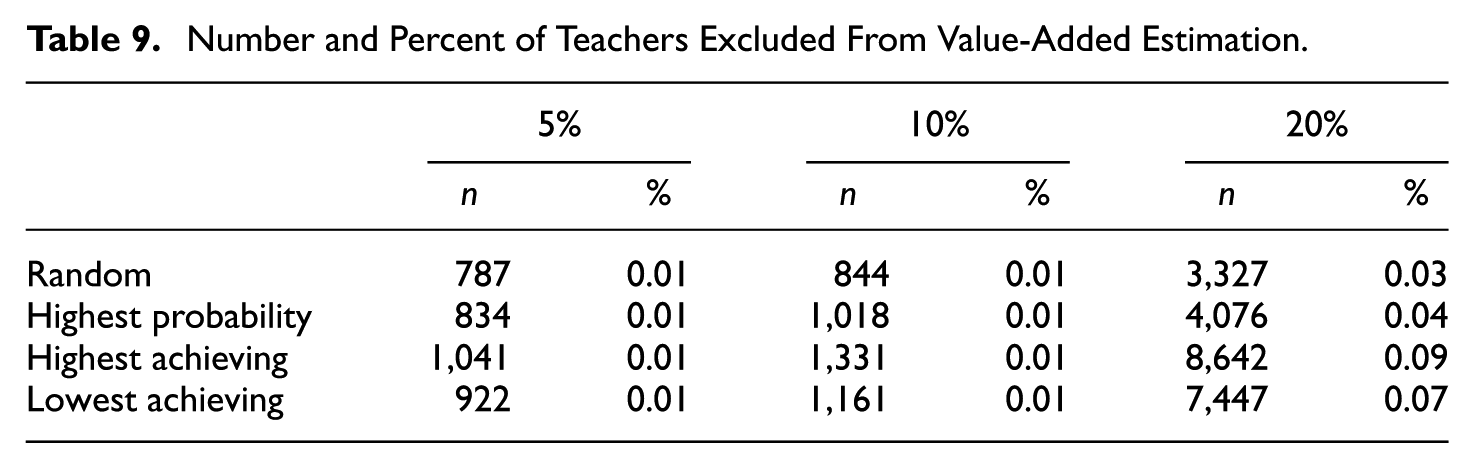
Finally, in Table 9, we show the percent of teachers who would be excluded under each opt out and magnitude condition, where we see that results are fairly similar for the 5% and 10% magnitude conditions, but increase in the 20% magnitude condition. In the 20% highest achieving condition, approximately 9% of teachers do not receive a value-added estimate. In the lowest achieving, approximately 7% do not.
Number and Percent of Teachers Excluded From Value-Added Estimation.
Discussion
The purpose of this study was to investigate the extent to which student opt out of state assessments used for accountability impacts value-added measures of teacher effectiveness. As mentioned in the Introduction section, there was a substantial increase in the number and proportion of students choosing to forego assessments administered in some states, the reasons for which appear to vary across locales. In New York, the State Education Department found that students who chose to opt out were from wealthier districts and were slightly more likely to be lower achieving than students who chose to take the assessment. Rice et al. (2016) found corroborating results in New York and added that these opt-out students in districts they studied were also slightly more likely to require special educational services. In Oregon, opt-out students were reported to be wealthier, higher achieving students (Hammond, 2015).
Given the demographic trends of this phenomenon, it is fair to say that opting out is potentially nonrandom, and that students who are no longer included in the test-taking population are systematically different. Accepting these facts, one could hypothesize that excluding these students from accountability measures (both achievement and growth) could potentially affect calculations and the resulting inferences about schools and educators. This study specifically focused on the extent to which growth measures, as implemented in a value-added model and used for educator accountability, are affected by nonrandom opt out trends in various magnitudes.
There are several prominent findings that contribute to the discussion about the impact of opt out on value-added estimates. The magnitude of opt out did appear to have a large impact on stability statistics, where we saw that RMSDs of value-added estimates more than doubled when opt out increases from 5% to 20% of students choosing to opt out. As the magnitude of opt out increased, classification agreement dropped 7% to 10% using Florida’s classification approach, and 3% to 5% when using New York’s approach. The types of opt out that we simulated did not appear to have a strong impact on classification agreement for a majority of teachers in the study. As mentioned, classification agreement was lowest for teachers of high-achieving students in the two conditions that were meant to represent extreme examples of opt out. In the highest achieving, 20% opt-out condition, where half the students were the highest achieving, we saw classification agreement drop to 70% using the Florida classification approach. As mentioned, this was meant to represent an extreme example, where all high achieving students systematically choose to opt out of the assessment, which has not yet been reported in the United States. In the more realistic scenario where students were chosen to opt out based on their probability, classification agreement was consistent across prior achievement quartiles.
The use of a shrinkage estimator did not appear to have a substantial impact on value-added estimates either, with only a slight decrease in the RMSD when shrinkage was applied across conditions. Perhaps somewhat contradictory, we see a decrease in classification agreement when shrinkage is applied and when using New York’s classification approach. The decrease could be due to the size of the shrinkage adjustment for small numbers of students made to value-added point estimates or standard errors for small numbers of students.
A substantial portion of teachers were completely excluded from classification in the highest and lowest achieving conditions, which could also be driving changes to teacher classifications. As mentioned, the correlations between complete and incomplete value-added point estimates were highly correlated at above 0.98 for all conditions, which means that rank ordering was relatively similar for those with estimates in both scenarios. Exclusion because of opt out also represents a challenge for those designing the evaluation system if they do not have plans in place for a substitute measure when value-added cannot be calculated.
As may be expected, the classification approach employed by states and districts has a substantial impact on stability estimates. We see lower classification agreement across opt out conditions when using Florida’s approach when compared with New York’s, which could be due to Florida’s less restrictive rules around which teachers receive a rating of consequence. New York requires point estimates to be 1.5 standard deviations above or below the mean, and the confidence interval to also be significantly different from the mean. In Florida, point estimates only need to be above the mean and the confidence interval cannot include zero. Their rules as implemented could allow for small changes in a point estimate or confidence interval to result in a change to teacher classification.
Limitations
This is a simulation study, which carries with it some limitations regarding generalization to realistic settings. While this certainly represents many important aspects of generating nested classroom scale score data, there are some factors that were not controlled. For instance, students in realistic settings are affected by grade-, school-, and district-level influences as well, which were not included in this study. The ICCs of scale scores and percent of opt out were used to represent between classroom differences that suggest nonrandom assignment of students to teachers, but the teacher-level ICC neglects school and district-level differences in achievement. Including school and district effects might also create more variation in teacher fixed effects generated as part of this study and should be considered in the next round of analysis.
In addition, the empirical data used to generate the parameter estimates were a subsample of the state and did not fully represent the state as well. Only 37.6% of students were considered as living in poverty in our sample, where 51.9% were statewide. This fact may affect the generated parameter estimates somewhat, if students living in poverty tend to have different growth trajectories than those who do not (which is the case in other locales). That said, we based our simulation conditions on the data observed from actual test administrations in a state, and so there should be reasonable generalizability, and the opt-out conditions we simulated could realistically occur at any time.
Last, we created two extreme examples of opt-out conditions because very little has been published on the types of students who opt out. We were able to obtain data from one state that allowed us to simulate a realistic scenario (highest probability), but even that was designed as a function of only prior achievement because of data availability challenges. Additionally, the design of the other two conditions (highest achieving and lowest achieving) were chosen by the author and may not approximate realistic scenarios. That stated, the results we see in those two conditions were not substantially worse than the one based in empirical data, which could allay some state or district concerns about their own opt-out patterns.
Conclusion
This study has several implications for accountability and teacher evaluation efforts across the United States. States put these growth measures in place to hold teachers, schools, and districts accountable for improving student learning, and ultimately, many teachers are not accountable because of a reduced number of students eligible for inclusion in value-added estimates. Thus, opt out can affect which teachers are classified as effective or not. The possibility that teachers (or their friends) may encourage students to opt out suggests this can be a particularly troubling problem.
Furthermore, most states employ a normative classification scheme for teacher effectiveness, where place in the distribution of fixed effects ultimately determines a teacher’s classification. Given how opt-out results affect this distribution, the results provide another reason for states and districts to consider using a criterion-referenced classification system. As seen in the literature, this requires experts to determine what qualifies as low, average, and high “growth.” A criterion-referenced classification system may be preferable to a system where teachers are more likely to change classifications because of another teacher’s (or their students’) behavior. However, criterion-referenced classification systems bring with them their own challenges, such as continuing to define standards and thresholds. Additionally, state assessment designs change every several years, which could also make maintenance of the system more difficult.
The results also suggest that states and districts should consider standard errors when classifying teachers into effectiveness categories. In this article, we used standard errors when classifying teachers into effectiveness categories to mitigate against misclassification, and as such, advocate that states and districts do the same. Growth estimates appear to be relatively robust to opt out, but the same may not be true of achievement measures used for school accountability if opt out is, in fact, systematically driven by student characteristics. Finally, as we read in the literature, many parents and teachers have concerns about test-based accountability. Policymakers should continue to investigate the impact of using assessments for various decisions in education, both intended and unintended, to ensure that the system is achieving desired results for students.
Footnotes
Declaration of Conflicting Interests
The author(s) declared no potential conflicts of interest with respect to the research, authorship, and/or publication of this article.
Funding
The author(s) received no financial support for the research, authorship, and/or publication of this article.