



Abstract
Many approaches have been proposed to jointly analyze item responses and response times to understand behavioral differences between normally and aberrantly behaved test-takers. Biometric information, such as data from eye trackers, can be used to better identify these deviant testing behaviors in addition to more conventional data types. Given this context, this study demonstrates the application of a new method for multiple-group analysis that concurrently models item responses, response times, and visual fixation counts collected from an eye-tracker. It is hypothesized that differences in behavioral patterns between normally behaved test-takers and those who have different levels of preknowledge about the test items will manifest in latent characteristics of the different data types. A Bayesian estimation scheme is used to fit the proposed model to experimental data and the results are discussed.
Keywords
The rapid shift toward a digitally reliant society necessitates the continual updating of the environments in which students learn. To improve the effectiveness and efficiency of learning, technology-enhanced learning infrastructures and approaches, such as artificial intelligence–enhanced and virtual reality–based learning, are called with greater frequency to bridge this gap (see, e.g., Ercikan & Pellegrino, 2017; Hao et al., 2016; Jiao & Lissitz, 2018; Man & Harring, 2019; Mislevy, 2011). In the technology-enhanced learning system (TELS), students’ learning status regarding biological and psychological reactions are continuously recorded in a formative manner via integrated detectors (e.g., eye-tracker, motion detectors, and virtual reality goggles) within the environment. This intensively collected, spontaneous biological and psychological information can be further used by practitioners to (1) better understand the learners, (2) improve their instruction and design, (3) monitor students’ learning, and (4) secure online-delivered exams, which could in turn, promote increases in students’ learning outcomes. And highly relevant to the recent global pandemic, the TELS can help transfer knowledge remotely like online-teaching, which makes the learning experience independent of space, pace, and time.
The tremendous amount of real-time data collected by the TELS are of different types and come in different forms, which can be modeled differently in terms of their functionalities. Outcome data (e.g., item responses and total scores) can be modeled to show students’ responding accuracy either at the item- or test-level. Traditionally, item response theory (IRT) models were created to explain the association between a test-taker’s observed binary correct/incorrect responses and their latent ability—the latter of which is consider either to have a unidimensional or multidimensional structure (see, e.g., Birnbaum, 1968; Lord, 1952; Rasch, 1960; Reckase, 1972).
Because of its availability with emergent technologies, process data (e.g., response times, keystrokes) can augment information about the test-taker above and beyond what item responses afford in isolation. As De Boeck and Jeon (2019) state, “abilities refer to levels of performance, whereas processes are the activities involved in reaching a performance outcome” (p. 1). Bergner and von Davier (2019) describe the process in process data and its relation to outcome measures in the following ways:
The process is irrelevant or at least ignorable given the outcome.
The process is auxiliary to the outcome.
The process is essential to understanding the outcome.
The outcome, and process scores are derived from an expert rubric, in the sense of a holistic rating.
The process is the outcome, and process scores are derived from a measurement model that accounts for dependencies in sequential data.
Among various types of process data, response times (RTs), the time a respondent takes to answer an individual item or task, have been frequently modeled to either show individuals’ working efficiency or to account for the speed-accuracy trade-off by jointly modeling them with item responses (e.g., Bolsinova et al., 2017; Man et al., 2019; Molenaar et al., 2015; Man et al., 2020; van der Linden, 2006). In addition, RTs can be used as a motivation indicator to identify aberrant item-responding behaviors such as carelessness and guessing (Guo et al., 2016; Wise & DeMars, 2006). By collecting, analyzing, and reporting process data (e.g., RTs) in large-scale assessment, process data, as a means to an end of understanding how a outcome had been reached as a result of sequences of actions, can be essential in evaluating and diagnosing task-performers’ weaknesses and strengths in solving problems (Wang et al., 2018).
Biometric data (e.g., eye-tracking, heart rate recording, electroencephalography), a subcategory of process data, are only beginning to be used in educational assessments. Although its importance in understanding the complexities of the learning process, notwithstanding integration and modeling of biometric data in practice has been slow because these data must be captured concurrently in real-time with other more conventional data types (Man, 2020). One type of biometric data that is emerging is eye-tracking data (Bergner & von Davier, 2019). Eye-tracking data has been used in various disciplines for some time and different attributes of eye-movement such as visual fixation counts (VFCs) have proven to be conducive in understanding many cognitive processes (Poole et al., 2004). The collected eye-tracking data can be used to address questions related to cognition such as: Where does a test-taker or task performer gaze? When does blinking occur? How does the pupil react to different stimuli? What information does a task-taker ignore during the performance causing failure? The answers to these questions (among the many others that could be asked) can potentially provide finer-grained diagnostic information regarding how high-order cognitive constructs are used in performing a task—information that would be unattainable by depending solely on the analysis of item responses or/and RTs.
Many methods have been proposed to analyze the different types of process data independently (e.g., Fox & Marianti, 2016; Lu et al., 2020). However, few attempts have been made to evaluate, in a more panoramic manner, task-takers’ abilities with process information, which analyzes outcome and process indicators in a single model. A two-factor hierarchical structure model proposed by van der Linden (2007) for jointly modeling item responses and RTs with random item and person parameters could be an ideal foundation for jointly modeling various process indicators. This method can provide interpretable parameter estimates, which can reveal not only the underlying behavioral patterns reflecting the trade-off between responding accuracy and working efficiency but item characteristics such as item difficulty. Moreover, this modeling framework has been used to timely calibrate online rendered items in the computer-based adaptive learning system with marginal maximum likelihood estimation making this type of joint-modeling method computationally feasible with large datasets (Kang et al., 2020). An interesting extension of this joint modeling is to a model with general linear factors that have a multilevel, multigroup structure. The multilevel–multigroup (ML-MG) model provides a general framework that considers more latent constructs than ability and work speed, and as we will demonstrate shortly, this ML-MG structure allows for the comparison of differences in both item characteristics and behavioral patterns across groups such as cheaters and noncheaters.
In the field of test security, many methods (e.g., Lu et al., 2020; van der Linden, 2007) have been proposed to evaluate cheating behavior by modeling item response and RTs jointly or separately. Yet no study that we are aware of has proposed a modeling framework that also incorporates eye-tacking indicators (e.g.,VFCs) to assess the behavioral pattern differences between the cheaters and noncheaters. Studies have shown that VFCs can be used to demonstrate cognitive information process efficiency and difficulty (Schaeffer et al., 2019). In addition, VFCs can show how familiar a person is with a visual target (Constantinides et al., 2019). Coupled with item responses and RTs, it is just this type of biometric data that we hope to demonstrate helps uncover aberrant test-taking behavior.
In this study, a ML-MG three-way factor model is proposed for jointly modeling item responses, RTs, and VFCs across three groups using experimental data from a study in which participants were randomly assigned to treatment conditions. The models allows for the investigation of the association among latent factors: ability, working speed, and test engagement, underlying item responses, RTs, and VFCs, respectively. The proposed ML-MG joint modeling approach is an extension of the Bayesian multilevel modeling framework proposed by van der Linden (2007). In this three-way ML-MG joint modeling approach, the Rasch model, an RT model, and a VFCs model are specified at the measurement level. The variance–covariance structures of the person-side and item-side parameters are specified at level two. Bayesian estimation is used to estimate the proposed three-way ML-MG joint model. An empirical example using data collected in an eye-tracking lab is provided. The findings from the real data analyses are discussed.
Multilevel–Multigroup Model Specification
Level-1: Measurement Models Across Different Groups
Item Response Model
A one-parameter logistic (1-PL MG; or Rasch MG) model, the multiple group version of the conventional 1-PL model (Lord, 1952), was selected to model the relation between latent ability reflecting the responding accuracy and item responses, and was fitted to each group. The model is specified as

where
On the person-side, using the I-PL MG model can manifest an individual’s latent ability to solve the test items and reveal systematic differences between groups in responding accuracy. On the item-side, item difficulties can be estimated for different groups of test-takers.
Response Time Model
In addition to the 1-PL MG model, a log-normal RT model (van der Linden, 2006) with MG structure is used to describe a test-taker’s working speed. Specification of the log-normal MG RT model extends the basic form outlined by van der Linden (2006) to

where
Similar to the 1-PL MG model, the person-side parameters can be used to demonstrate how efficient a person was working on the test items. And, this parameter would be jointly modeled with latent ability and visual engagement at level-two, the structural model. Besides, the differences in overall working efficiencies between groups can be manifested as well. In terms of item parameters, time intensities could be used to show how much time effort was required for each item.
Visual Fixation Counts Model
VFCs are fitted using a negative binomial fixation (NBF) model proposed by Man and Harring (2019), which describes the relation between observed VFCs and latent test visual engagement. 1 The NBF model is specified as:

where parameter
Level 2: Multigroup Item Domain and Person Domain Models
The second-level models incorporate two variance–covariance structures, named as person-domain and item-domain structures separately, to account for the dependencies of both item and person parameters jointly. These are estimated from the Level-1 models for different groups.
Person-Domain Parameters
In this joint modeling approach, the person domain of each group covers three latent person-side parameters: (1) latent ability

with mean vector,

The parameters on the diagonal of the
Item Domain Parameters
A multivariate normal distribution is also assumed for the item parameters such that

The mean vector and symmetric covariance matrix,

By estimating the two structural variance–covariance matrices, the associations among item parameters and the relationships among person parameters can be manifested across groups. Those structural nuances across groups represent distinct test-taking behavioral patterns among individuals who have preknowledge of test items. The impact of having preknowledge can be evaluated by measuring the magnitude of drifts in the associated parameters, such as item difficulties and time intensities. The model constraints will be illustrated in the estimation section.
Testing Item Parameter Drift Across Groups
Item drift occurs when items function differently for various groups of test-takers. Usually, item drift was caused by the presence of new construct or irrelevant traits (e.g., test-takers have preknowledge on items) affecting the individuals’ responding accuracy, which violates the unidimension assumption of testing (Hambleton et al., 1991; Smith & Prometric, 2004). Therefore, the distributions of additional traits/constructs differ across groups. One group of test-takers might have lower probabilities to answer the items correctly. To evaluate whether item parameter drift exists across experimental groups, pairwise differences among the same set of item parameters are defined as follows:
The drift in item difficulties:
In terms of time intensities, the drift in time intensities are defined as:

To summarize the uncertainty of the posterior distribution of the different item drift differences, standardized Wald-statistics are defined for difficulties, time intensities, and visual intensities, separately:

The calculated
Figure 1 displays the graphical representation of the ML-MG joint model of item response, response time, and VFCs.
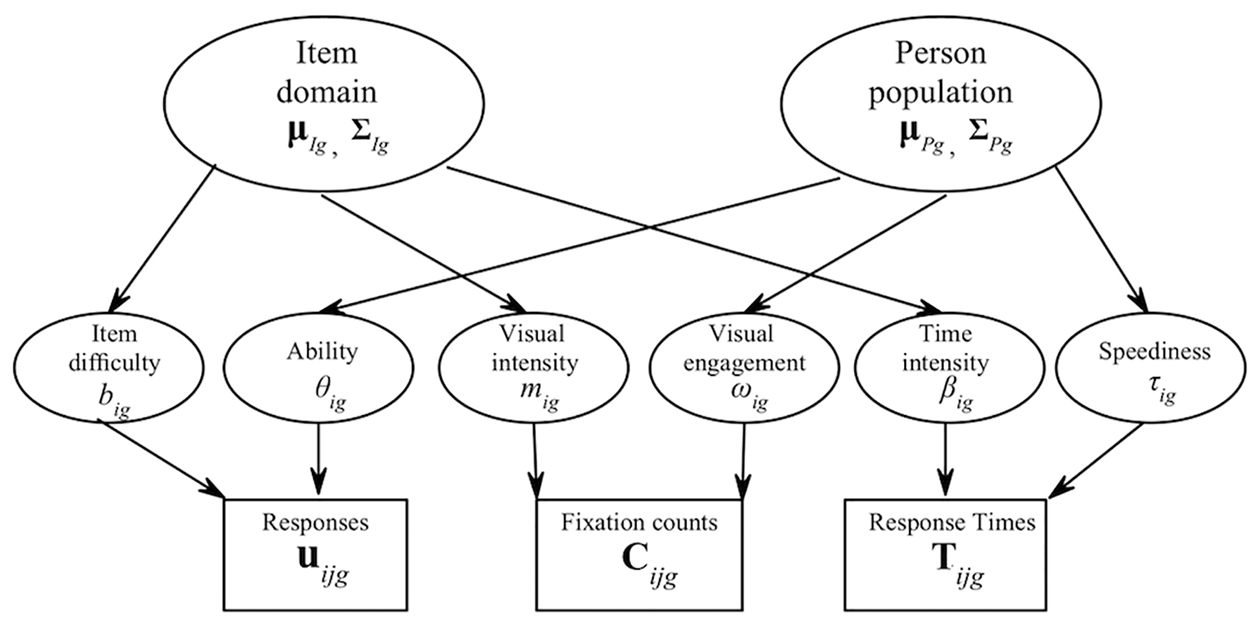
Multilevel–multigroup (ML-MG) three-way joint model approach of item response, response time, and visual fixation counts.
Bayesian Estimation Using MCMC Sampling
Bayesian estimation was used for model parameter estimation in Just Another Gibbs Sampler (Plummer, 2015), which is housed in the R2jags package (Su & Yajima, 2015). Convergence is assessed via the coda package. Four chains using 60,000 total iterations with thinning of 4 to reduce autocorrelation among draws were executed. Model parameter estimates and standard deviations were summed up dependent on the posterior densities using the final 10,000 iterations after burning-in 50,000. The potential scale reduction factor was used for assessing convergence for all model parameters (Gelman et al., 2003). For the present study, a potential scale reduction factor value of 1.2 or less for each model parameter was used as the arbiter indicating convergence.
Model Identification
To properly identify the scales of the latent variables, model constraints are needed either on the item side (fixing the summation of item thresholds to zero) or the person-side (fixing the expectation of the latent ability parameter to zero). In this study, the model identification scales were fixed on the person-side by following the convention used for IRT model estimation (Volodin & Adams, 1995; Wu et al., 1998).
Within each group

Prior Distributions
Weak informative priors are preferentially used in this study to increase the generalizability of our code by imposing vague prior beliefs on estimating parameters. The setting of priors in this way was also implemented in Man et al. (2020) and Man and Harring (2019).
The prior distribution of item parameters,

where
Similarly, the prior specification for the person parameters,

The joint posterior probability for the proposed model can be represented as

where
Posterior Predictive Model Checking
In this study, posterior predictive model checking (PPMC) was used for evaluating whether the proposed model adequately accounted for the variability existing in the data. Specifically, PPMC was used to check our model-data fit (see, e.g., Gelman et al., 1996; Levy et al., 2009; Rubin, 1996; Sinharay et al., 2006).
Introduction of the Method
Let

To check the model-data fit by PPMC, predicted data are generated from the joint posterior distribution. The generated replicated dataset is denoted as

Model fit is evaluated by comparing the differences between the predicted data
The model-data fit can be evaluated by comparing the difference between the

where
Draw the item parameter and person parameter estimates for the proposed model from the posterior distribution (see, Equation 9).
Draw
Compute the values of observed and predictive discrepancy measures (e.g., item-fit statistics or descriptive statistics only based on data) from the above draws of parameters and data set.
The data–model fit can be evaluated based on the computed PPP-values, which are given by the Equation 11. Figure 2, a modification of a schematic presented by Sinharay et al. (2006), graphically demonstrates the detailed procedure of using the PPMC method to evaluate the data-model fit.
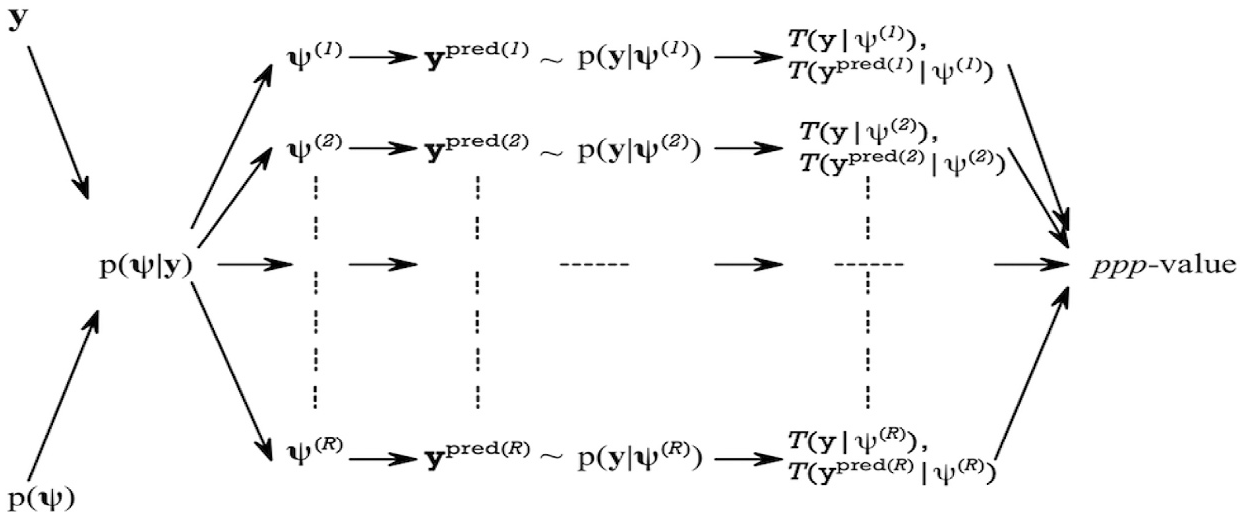
Graphical demonstration of posterior predictive model checking (PPMC) method.
A posterior predictive probability (PPP) value near .5 indicates that there are no systematic differences between the realized and predictive values, and thus an adequate fit of the model (Sinharay et al., 2006). In the results section, the item-wise data–model fit for the item responses, RTs, and VFCs will be calculated by averaging over all the persons’ PPP-values for each item, and the results will be reported in a table later.
Real Data Analysis
The proposed ML-MG three-way joint model of item responses, RTs, and VFCs were fitted to the data. Parameter estimates of the Level-1 measurement models were reported. In addition, the trade-offs of the person-side and item-side parameters at the Level-2 were discussed by summarizing the corresponding variance–covariance estimates.
Data Description
Data were collected in an eye-tracking lab setting at a large university with IRB approval. A total of
Number of Subjects in Each Condition.
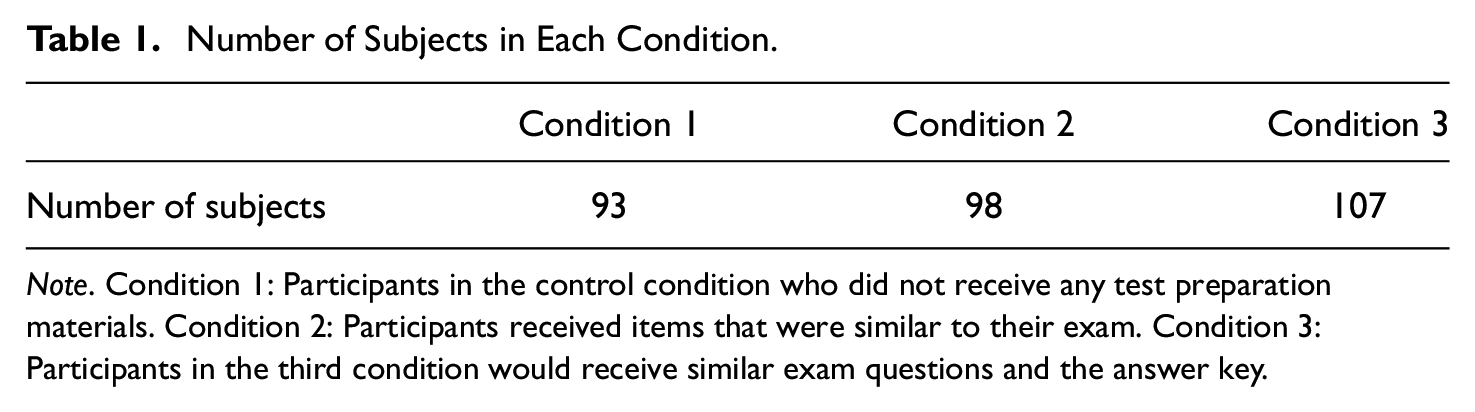
Note. Condition 1: Participants in the control condition who did not receive any test preparation materials. Condition 2: Participants received items that were similar to their exam. Condition 3: Participants in the third condition would receive similar exam questions and the answer key.
Students were invited to a room and seated approximately 80 cm away from a

Scatterplots of essential variables across three conditions. The variable names showing in the matrix from the top left to the bottom right are: total.score, total.gaze, total.time. The distribution of each variable is listed on the diagonal of the plot matrix. The bivariate scatterplots are listed on the off-diagonal.
Data Visualization Across Different Experimental Conditions
Based on the descriptive statistics of the collected data, it is not hard to gain insights about the group differences by comparing the means for each variable across three experimental conditions. To have better understanding about the data and to properly model it for accurate inferences, the collected data was explored by showing the bivariate scatterplots of the major variables, which are quite useful and straightforward for interpreting trends and the associations among the key variables. All scatterplots were created based on the total scores for each individual, see Figure 3. For instance, on the top left of Figure 3, the total scores were calculated by summing up the 10 item scores. Visualizing the key variables is helpful to understand the most appropriate means for answering our research questions.
In Condition 1, distribution of each variable (listed on the diagonal of the plot matrix) was relatively normal. In addition, by looking at the bivariate normal density contours (listed on the off diagonal), the correlation between total score and total time, and the one between total score and total gaze are expected to be relatively weak due to its round contours. In contrast, the correlation between total gaze and total time is expected to be positive due to its up-tilted elliptical contour. In terms of Condition 2, their panel plots show bimodal and skewed distributions, which are different from those shown in Condition 1. The bimodal distribution may indicate a mix of two groups of test-takers with different test-taking strategies, responding to the items in different ways. In addition, the total gaze and total RTs are skewed to the right, which means, on average, test-takers tend to spend a shorter time finishing the items on their tests. Regarding Condition 3, generally speaking, all the distributions listed on the diagonal are relatively more skewed with less variability. The distributions are very skewed with high peaks, which indicate the responding behavioral patterns of test takers under Condition 3 are dramatically different from test-takers in the other conditions. The results show that test-takers in this group correctly answered the items more rapidly with less visual attention. Also, all the test-takers in Condition 3 behaved more alike.
Accessing Data Model fit based on PPMC Method
Table 2 shows the item-wise PPP-values for assessing data model fits across conditions. The PPP-values were summarized based on 10,000 iterations after dropping burn-in iterations with thinning of 4. On comparison of the PPP-values for the three models across 10 items, in general, most of the PPP-values were close to .5 for I-PL, RT, and NBFM model, indicating satisfactory fit of all three measurement models. One thing to note, the PPP-values for Condition 3 were more extreme than the ones in Conditions 1 and 2. Yet all of them are within the range between 0.05 and 0.95.
Item-Wise PPP Values for Assessing Data–Model Fits Across Conditions.
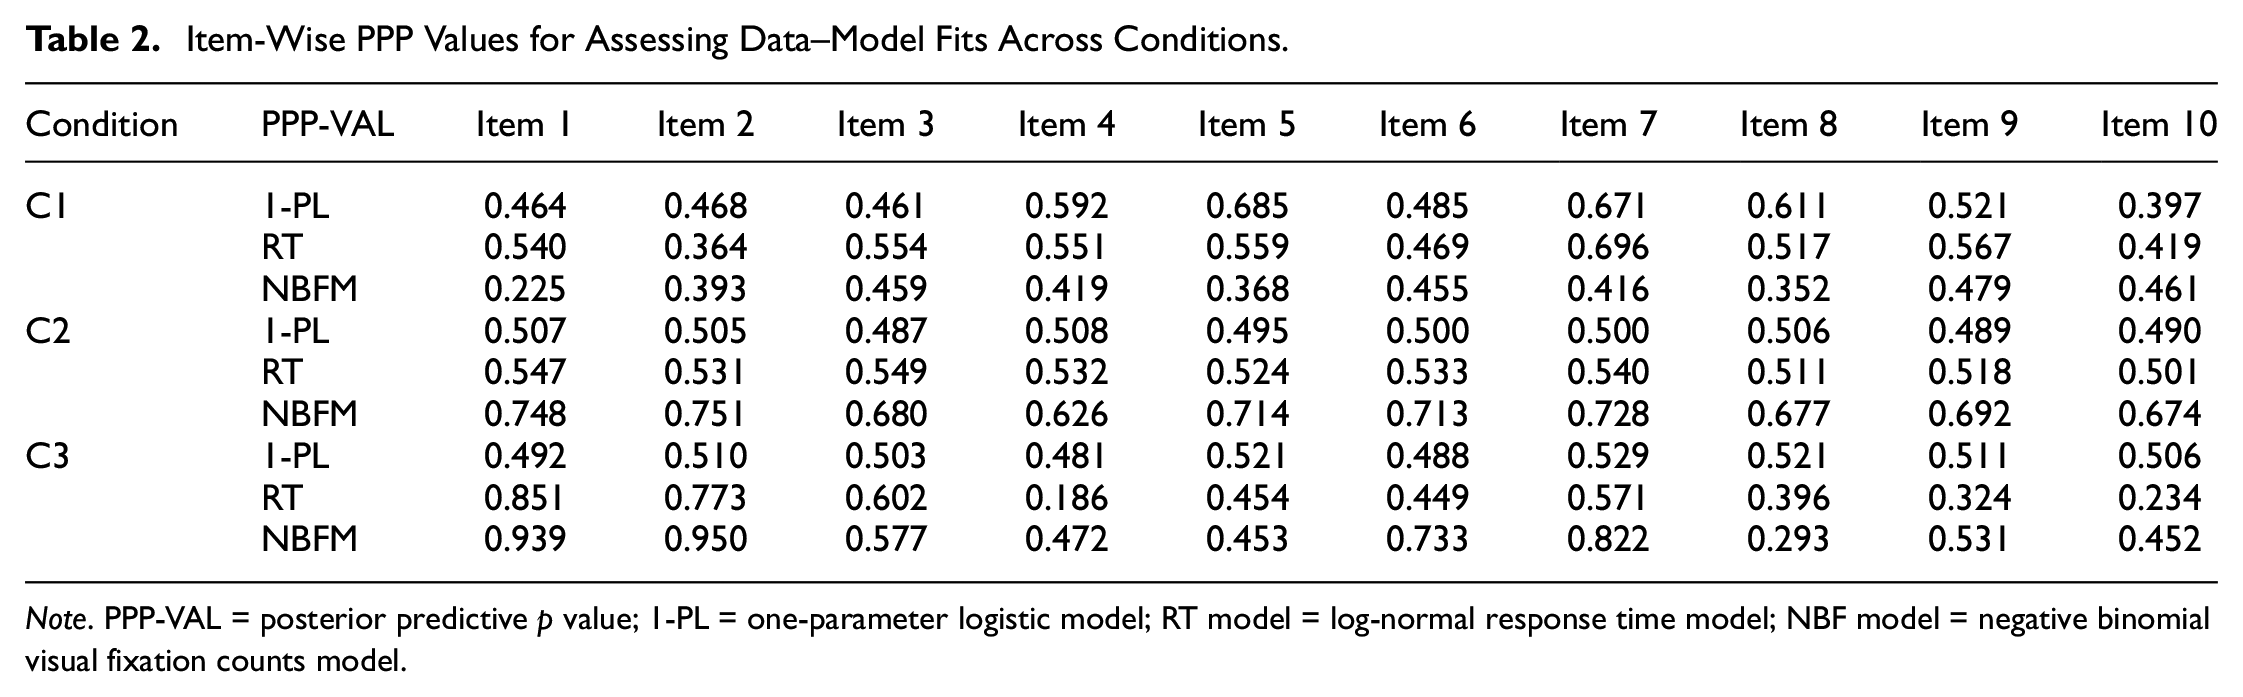
Note. PPP-VAL = posterior predictive p value; 1-PL = one-parameter logistic model; RT model = log-normal response time model; NBF model = negative binomial visual fixation counts model.
To understand and evaluate the pattern differences in test-taking behaviors across distinct experimental conditions, a multiple-group joint three-way factor model of item responses, RTs, and VFCs were fitted separately to the data in different conditions. Parameter estimates of the Level-1 measurement models across the three conditions were reported. Moreover, the distinctions of the associations of the person-side and the item-side parameters were reported by showing the corresponding covariance estimates across the contrasting experimental conditions.
Impact of Having Preknowledge of Test Items on Item Characteristics
To evaluate the impact of having preknowledge of test questions on the properties of test items (see Figure 4), Table 3 displays a comparison of item parameter estimates of the proposed model with regard to the three experimental conditions. In general, item difficulties (
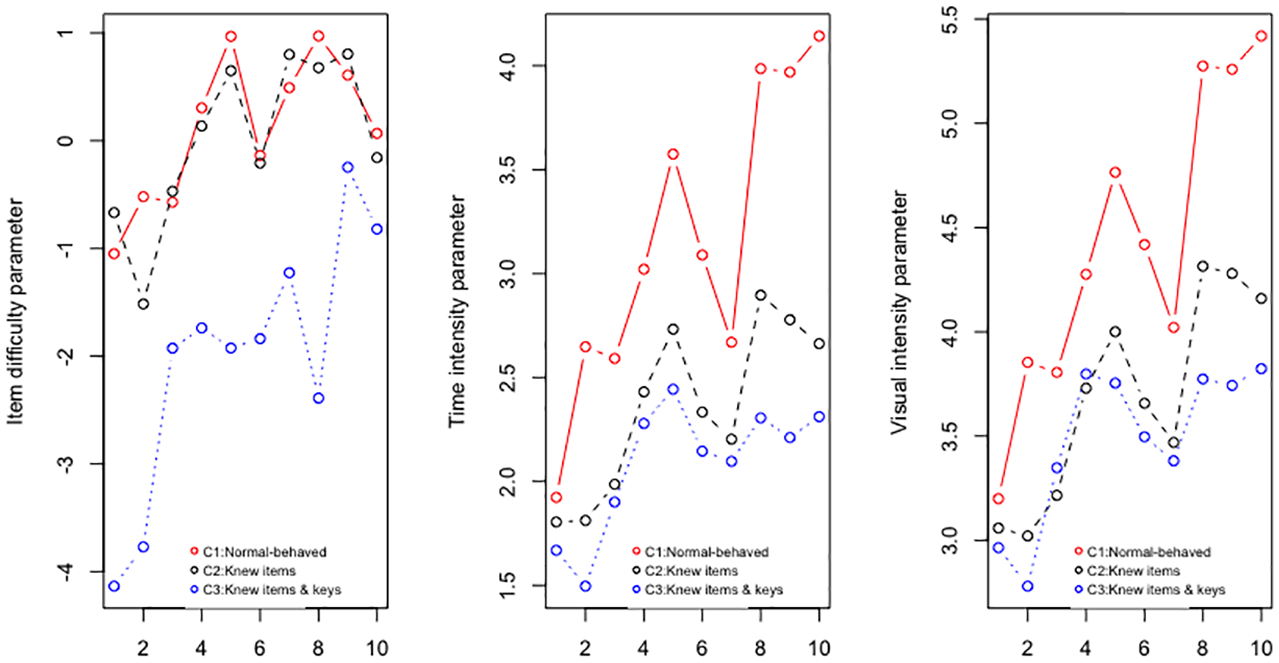
Scatterplots for item parameter estimates. A loess nonparametric smoothed curve is plotted for each scatterplot.
Item Parameter Estimates Across Different Experimental Conditions.

Note. 1-PL = one-parameter logistic model; RT = log-normal response time model; NBF = negative binomial visual fixation counts model.
Item Difficulty Estimates Across Conditions
In general, items, on average, appeared to be much easier in Condition 3 than the other two conditions. Across item difficulties,
Impact of Having Preknowledge of Test Items on Item Drifts.

Note. Par. = Parameter;
Time Intensity Estimates Across Conditions
Similarly, test-takers who practiced the items or knew the answer keys beforehand tended to take less time to finish their tests. By averaging the time intensities across the 10 items,
Visual Intensity Estimates Across Conditions
A trend of visual intensities similar to the summarized response patterns in the previous session was observed, which indicates test-takers familiar with the items tend to put less visual effort on searching for information to answer the questions (see Figure 4). By averaging the visual intensities across the 10 items,
Impact of Having Preknowledge of Test Items on Test-Takers’ Behavior
Table 5 shows the impact of having preknowledge of test items on the test-takers’ behaviors. The behavioral pattern differences were demonstrated via comparison of the three person-side covariances, indicating association among the interested latent constructs (ability, working speed, and visual engagement) across the three experimental conditions. As a trend, as students gain more preknowledge of the test items the correlation between latent ability and working speed increased from 0.005 in Condition 1 (95% credible interval: −0.023 to 0.020) to 0.672 (95% credible interval: 0.496 to 0.621) in Condition 3. The increased correlation between latent ability and working speed might be caused by test-takers in Condition 3 receiving practice items with answer keys. Therefore, they answered more items correctly than the ones who did not receive any test preparation materials.
Person-Side Correlation Matrix Estimates.
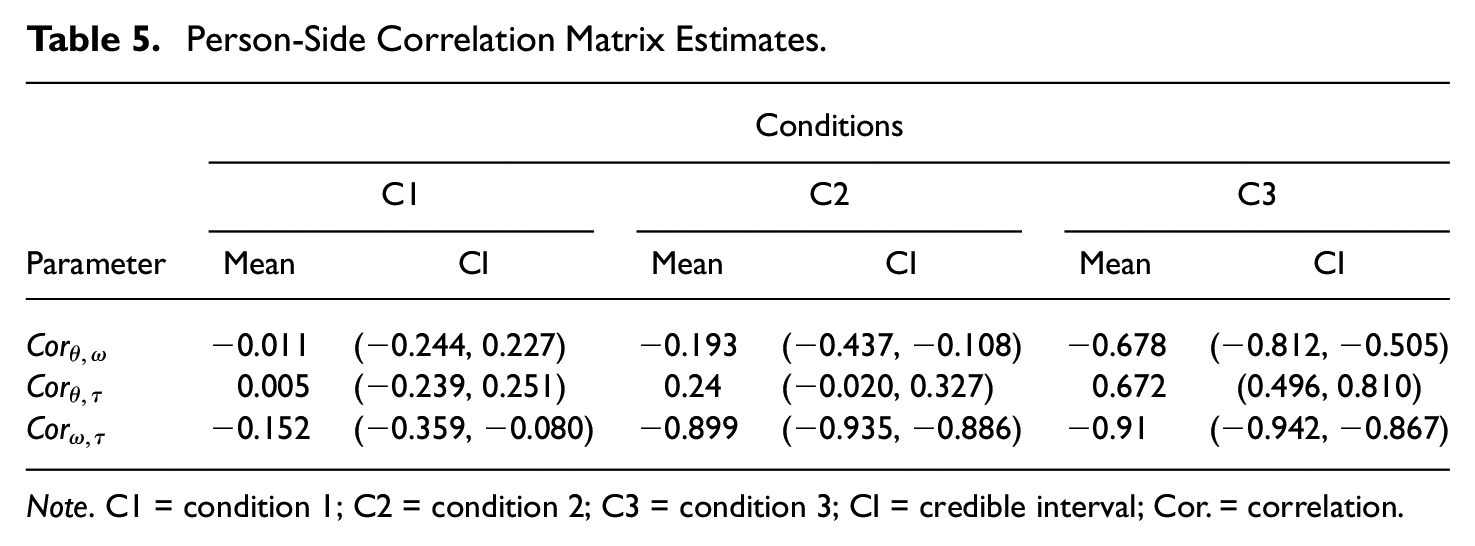
Note. C1 = condition 1; C2 = condition 2; C3 = condition 3; CI = credible interval; Cor. = correlation.
In terms of changes in the trade-offs between the latent ability and visual engagement across conditions, Figure 5 shows that test-takers who were familiar with the test items tended to put less visual efforts on answering items. The correlation between those two latent constructs dropped from −0.011 in Condition 1 (95% credible interval: −0.244 to 0.227) to −0.678 in the Condition 3 (95% credible interval: −0.812 to −0.505). Similarly, negative trade-offs between the working speed and visual engagement were observed. The correlation (

Scatterplots for person-side parameter estimates. A loess nonparametric smoothed curve is plotted for each scatterplot.
Discussion
As is becoming increasingly evident, gaining a more comprehensive understanding of complex test-taking behaviors necessarily requires collecting and modeling supplementary information beyond conventional item responses. To this end, technology-enhanced assessments allow the collecting of response process data, such as RTs and gaze fixation counts, that can be used to systematically reflect the characteristics regarding item parameters and spatial patterns of test-takers’ cognitive capacities (Fox & Marianti, 2016). Incorporating process data information has been demonstrated to facilitate estimation of person and item parameters in IRT (Man & Harring, 2019; van der Linden et al., 2010) while providing insights of test-takers’ behaviors that is hard to be identified from item responses only.
The proposed ML-MG three-way joint model can help (1) integrate visual fixation—an eye-tracking indicator—into a traditional psychometric modeling framework and (2) investigate pattern differences in the trade-offs of visual attention, working speediness and accuracy across groups. With this modeling framework, some important test takers’ cognitive processes can be evaluated in a virtual-based learning system by estimating the relations among the responding accuracy, task decoding speed, and visual engagement. Those manifested relations could facilitate practitioners to better understand and classify different types of responding behaviors. Especially now, due to the outbreak of pandemic, it is essential to have tools to differentiate cheaters from normally behaved test-takers, which can keep our online delivered tests as secure as possible (Jiao & Lissitz, 2018).
Results from the real data example show that the proposed model captures the underlying patterns of data set showing a satisfactory data model fit. In addition, the proposed ML-MG three-way joint model demonstrates additional benefits. Both the associations among item parameters and trade-offs among person parameters can be assessed across groups. This may help practitioners and substantive researchers to better understand behavior nuances and cognitive processes in test-takers’ performance belonging to different groups in the technology-enhanced environment. For instance, with the proposed model, the impact of having preknowledge on items could be evaluated by quantifying the differences in working efficiency, visual engagement, and responding accuracy across groups.
Moreover, other eye-tracking related biometric information variables (e.g., blinking rates, pupil diameters) could be added as auxiliary information to reflect other characteristics of test-taking behaviors. For example, the diameter of the pupil has been reported to be negatively correlated with levels of fatigue (e.g., Morad et al., 2000; Yoss et al., 1970). Also, many other types of biometric information (e.g., blood oxygen level–dependent signal, electroencephalography, or heart rate) could be integrated into the current modeling framework to assess whether these involuntary bodily processes could provided any new, systematic insights into the learners’ learning progressions in the ITELS. For instance, heart rate could be used to track test-takers’ anxiety levels in ITELS (e.g., Friedman & Thayer, 1998). Furthermore, other background variables like gender could be added as covariates to show the difference between groups.
Lastly, the proposed model could be further expanded. An interesting next elaboration might be to model multidimensional compensatory responses (Molenaar et al., 2015) and its functional relation to RTs and VFCs rather than modeling unidimensional item responses. Of course, the measurement model can also be extended to two-parameter logistic IRT model (2PL), three-parameter logistic IRT model (3PL), or polytomous item responses in a straightforward manner as long as the sample size is sufficiently large to estimate item parameters with satisfactory precision. However, due to the budget and time constrain we had for conducting this study, 1-PL model was used to fit item responses. This is an essential elaboration as many educational and psychological tests and assessments include items that are Likert-type scaled. Finally, the current assumptions that visual engagement and working speed are constant over the entire test, and this assumption could be relaxed in a future study. This may provide individualized items-specific information regarding changes of behavioral patterns of test-takers over items.
Footnotes
Declaration of Conflicting Interests
The authors declared no potential conflicts of interest with respect to the research, authorship, and/or publication of this article.
Funding
The authors received no financial support for the research, authorship, and/or publication of this article.
