



Abstract
Although collecting data from multiple informants is highly recommended, methods to model the congruence and incongruence between informants are limited. Bauer and colleagues suggested the trifactor model that decomposes the variances into common factor, informant perspective factors, and item-specific factors. This study extends their work to the trifactor mixture model that combines the trifactor model and the mixture model. This combined approach allows researchers to investigate the common and unique perspectives of multiple informants on targets using latent factors and simultaneously take into account potential heterogeneity of targets using latent classes. We demonstrate this model using student self-rated and teacher-rated academic behaviors (N = 24,094). Model specification and testing procedures are explicated in detail. Methodological and practical issues in conducting the trifactor mixture analysis are discussed.
In educational and psychological studies, it is recommended that data be collected from multiple informants (Achenbach et al., 1987). However, there is often low agreement across raters depending on the construct of interest (Laird & De Los Reyes, 2013) and the correlation between informants is generally low (e.g., .40 or less; Achenbach et al., 2005; Flake & Petway, 2019). The informant disagreement is not necessarily ascribed to informant bias, but rather considered as unique perspectives because multiple informants may observe a target in different settings and hence provide valuable information that cannot be observed if only one of them is surveyed (Roskam, 2018). For example, student self-report can contribute unique and valuable information when combined with teacher ratings in predicting distal academic outcomes (von der Embse et al., under review). Thus, it is recommended to use multi-informant data rather than one source of information (e.g., Standards for Educational and Psychological Testing, American Educational Research Association et al., 2014).
Although collecting data from multiple informants is highly recommended, synthesizing multi-informant data is challenging and methods for multi-informant research are still limited (Kim et al., 2018; Flake & Petway, 2019). Two intertwined challenges include (1) how to appropriately model and assess the discrepancies between informants and (2) how to use such incongruous information (De Los Reyes, 2011). To measure discrepancies between multiple informants, a mean difference, correlation, and interrater reliability between informants are often reported (Achenbach, 2011; Kim et al., 2018). In the use of multi-informant ratings, researchers may choose a sole or optimal informant, simply average scores across informants, conduct separate analyses by informant, or use clinical cutoff scores aggregated across informants (Bauer et al., 2013; Kraemer et al., 2003; van Dulmen & Egeland, 2011). However, previous studies (e.g., Kraemer et al., 2003; van Dulmen & Egeland, 2011) reported the limitations of these methods: for example, choosing only one may lead to incorrect treatment decisions (De Los Reyes, 2011).
On the other hand, Bauer et al. (2013) noted the advantages of a factor analytic approach over the aforementioned methods. The factor analytic approach can afford the disentanglement of effects from various sources (e.g., rater effect as a method factor in the multitrait multimethod or MTMM model) and model the uniqueness as well as commonalities between informants. Specifically, Bauer et al. suggested a trifactor model that decomposes the variances into three primary sources, including (1) a common factor that represents the common view of the targets across informants, (2) informant perspective factors that represent each informant unique view of the targets not shared by the others, and (3) item-specific factors that are unique to items. The trifactor model was used to demonstrate differences in father and mother ratings of child negative affect and show how each item was related to the unique rater factors (father and mother) as well as the common factor, and how these factors were associated with child age, child gender, and parental impairment (Bauer et al., 2013).
The decomposition approach to multi-informant data has inherent assumptions, including that the underlying item and construct structure is dimensional (Clark et al., 2013). However, multi-informant data (e.g., children rated by both parents) could have heterogeneous groups of targets (e.g., children) not only in terms of the construct (e.g., low and high in negative affect) but also due to the disagreement between informants (e.g., children who were rated high by mother but not by father or vice versa). Thus, we employ a latent categorical variable approach to understand the categorization of targets of raters. This approach, usually called mixture modeling or latent class analysis 1 , assumes that the underlying structure of items is categorical and is used to extricate heterogeneous groups of individuals based on their responses to the items (Clark et al., 2013). 2
The present investigation extends Bauer et al.’s (2013) work on the trifactor model by applying factor mixture modeling to multi-informant data: We introduce the trifactor mixture model that combines the trifactor model and the mixture model. The trifactor mixture model distinguishes the common factor from the informant perspective factors and item-specific factors and simultaneously classifies individuals into different subgroups in terms of those factors. This combined approach allows researchers to investigate not only the dimensionality of the construct the items measure (latent factors) but also the classification of individuals (latent classes). 3 Specifically in multiple informant studies, the informant congruence and incongruence are separately modeled as latent factors and further the covariates associated with informant congruence and incongruence can be investigated. In addition, using the trifactor mixture model, researchers can examine how similar or dissimilar the targets are in terms of the common factor and informant perspective factors. If the targets are heterogeneous, researchers can further investigate what predictors are related to such heterogeneity and how the heterogeneous groups affect other outcomes.
The article is structured as follows. We first present the technical overview of trifactor mixture model and discuss its advantages in the use of multi-informant data. Then, we demonstrate the model with student self-rated and teacher-rated academic behaviors. The illustration includes the trifactor mixture model with predictors and outcomes of latent class membership. In this illustration, model specification and testing procedures are explicated in detail. Finally, the article concludes with discussions on several methodological and practical challenges in conducting the trifactor mixture analysis with multi-informant data and suggestions for future research.
Trifactor Mixture Model
Trifactor Model
The trifactor model is a measurement model in which the relations of items with the factors are specified (Jöreskog, 1969). Considering that multi-informant data possibly have more than one sources of variability and those sources are assumed to be independent of each other, Bauer et al. (2013) suggested to build a measurement model with three types of orthogonal factors: common factor that measures the construct of interest, informant perspective factors each of which represents the unique perspective of the corresponding informant, and item specific factors each of which represents the uniqueness of the item conditional on the other substantive factors. Under the assumption of unidimensionality of the common factor and multivariate normality of observed variables for simplicity, the trifactor model is expressed as

where
This model is illustrated in Figure 1. Each item loads on three orthogonal factors, that is, the common factor, one of informant perspective factors, and one of item specific factors. In other words, the rating of each target is a combination of unique contributions of three factors. This measurement model can be easily extended to a structural model by including a set of predictors of the latent variables which is expressed in matrix form as

where
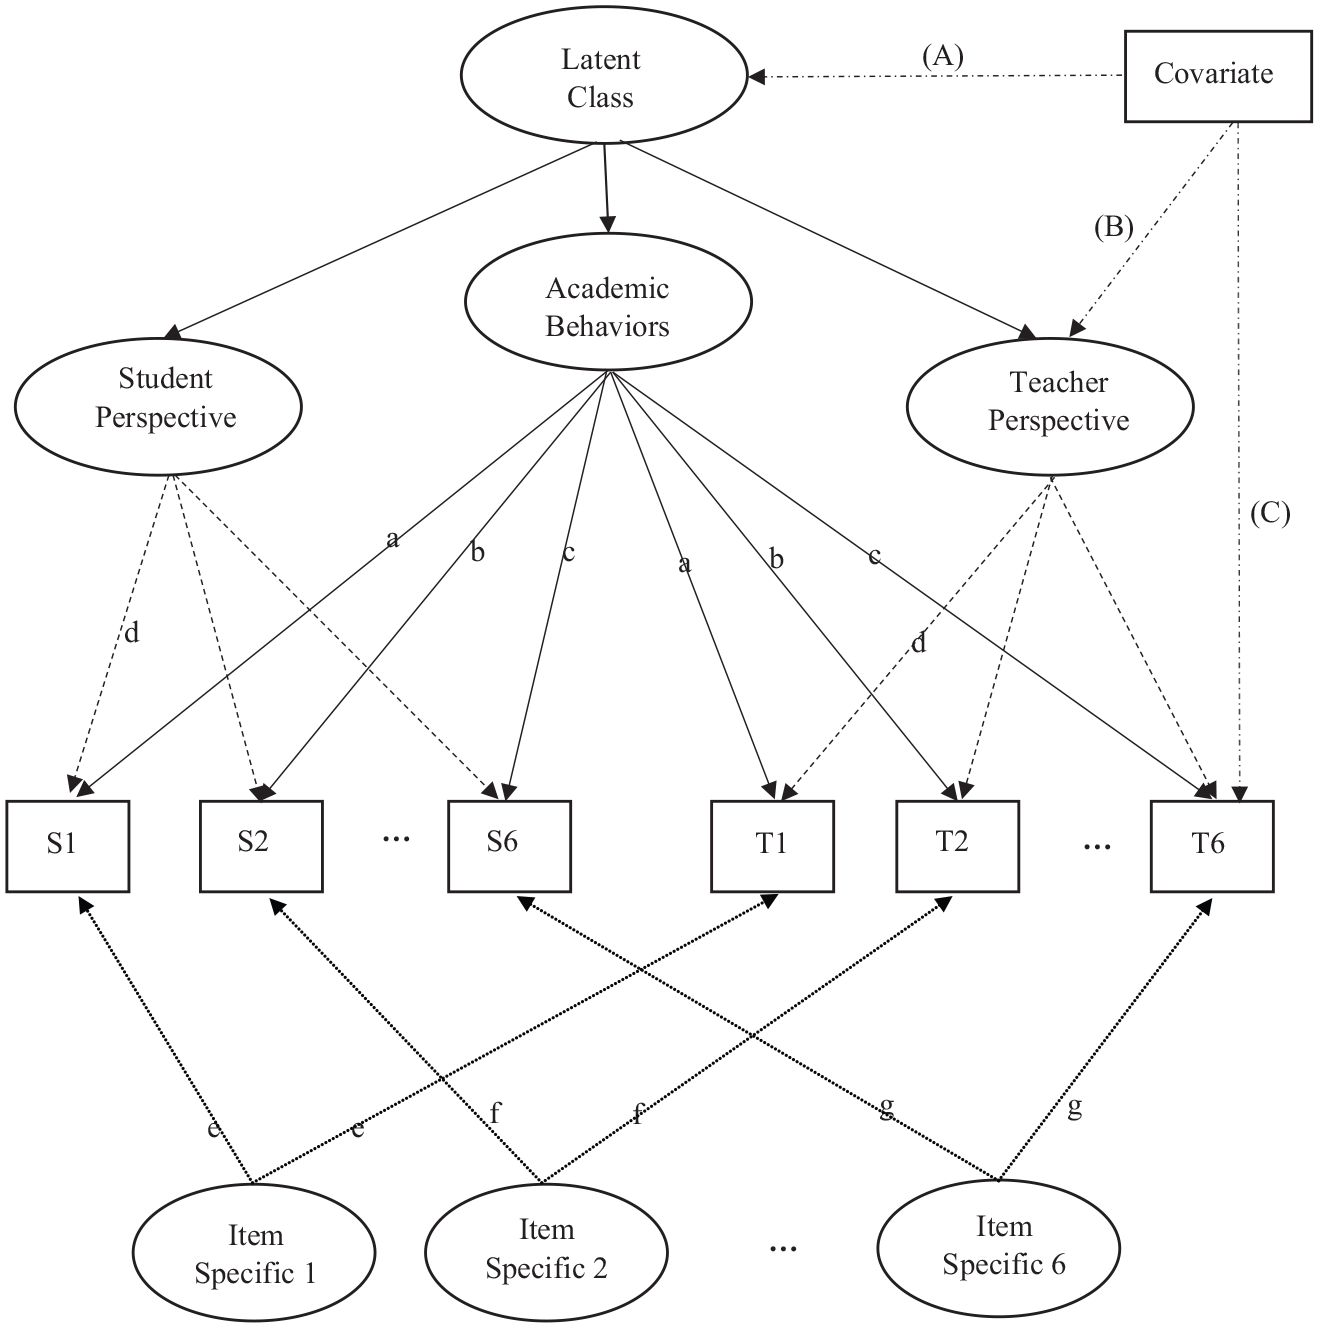
Conditional trifactor mixture model of academic behaviors with a covariate.
Trifactor Mixture Model
Factor mixture modeling (FMM) is the general approach that combines the confirmatory factor analysis with unobserved continuous variables (i.e., latent factors) and the latent class analysis with unobserved categorical variables (i.e., latent classes) (Lubke & Muthén, 2005). FMM has advantages over latent class analysis because it incorporates a measurement model that not only partials out measurement errors from the observed scores but also allows explicit tests of psychometric properties, including measurement invariance across latent classes (Kim et al., 2018).
The trifactor mixture model is a special case of the general factor mixture model. In mixture modeling, the density function of the outcome variables,

where

where all notations are explained above. Similar to the conditional trifactor model, the probability of each target to belong to a certain latent class can be further explained by regressing the class membership on a set of predictors in the multinomial logistic regression model. On the other hand, the estimated class membership can be used as a predictor of other outcome variables.
Advantages of Trifactor Mixture Model for Multi-informant Research
Bauer et al. (2013) presented three advantages of the trifactor model. In addition to those advantages, the trifactor mixture model will enhance the use of multi-informant data in several aspects. Because the trifactor model is a measurement model, it is useful for item development and validation for a multiple score system. Researchers can assess the relative contribution of each factor on each item. For example, an item with the high factor loading of common factor, relatively low factor loading of informant factor, and no or ignorable impact of item specific factor can be retained for a valid scale. Beyond these, the trifactor mixture model allows researchers to test whether one trifactor model holds for all targets or there are subgroups that have different trifactor structures. For example, the relations of items with a certain informant factor could be higher or lower in one group than the other indicating that the informant perspective is stronger or weaker for a certain group of targets. Relatedly, measurement invariance can be explicitly evaluated across unobserved subgroups for each factor, which will be particularly vital for the use of common factor scores 4 because measurement invariance is a prerequisite for a meaningful comparison of scores across groups (Kim et al., 2018).
In the conditional model, a researcher can inspect which covariates are associated with class membership as well as each factor. Thus, beyond identifying latent factors and latent classes, the trifactor mixture model allows researchers to describe those unobserved variables and further explain their relations with other variables. More specifically, researchers can investigate which predictors are associated with informant congruence and incongruence and concurrently who is more likely to belong to a certain subgroup. For example, by including covariates on the trifactor, Bauer et al. (2013) showed that parental perspective factors were related with parental impairment such as parental depression. Of note is that the trifactor model is basically confirmatory and thus latent factors are predetermined based on theory and substantive research interest, but mixture modeling is inherently exploratory. That is, the extracted latent classes should be theoretically justified and explained. Hence, the inclusion of covariates is a crucial part in trifactor mixture modeling to understand who belong to each subgroup (latent class) and what their characteristics are. The trifactor mixture model is also flexible in incorporating outcomes of latent factors and latent classes to explain how they affect the outcomes.
Finally, common factor scores are generated which are based on the common view of multiple informants on the target without item specific bias and measurement error (Bauer et al. 2013). Thus, the common factor scores are considered more reliable than observed scores and better aggregation by properly weighting different contributions of items and informants than simply averaging scores across informants (van Dulmen & Egeland, 2011). Also, researchers do not need to choose one of multiple informants.
By allowing heterogeneity, researchers are informed of different groups based on targets’ standings in the factors. This latent categorization of individuals overcomes the limitations of arbitrary grouping that uses a certain cutoff score such as a median split: observed score categorization depends on the researcher’s choice of cutoff and does not take into account measurement errors (MacCallum et al., 2002). For example, the clinical cutoff score method is used with multiple informant data (assigning 1 for an individual whose score rated by an informant is in a clinical range and aggregating clinical scores across informants), but van Dulmen and Egeland (2011) reported that its predictive validity was low. On the other hand, when heterogeneity is detected among targets, the trifactor mixture model yields their probability to belong to a certain class along with their most likely class membership that informs researchers of the placement of targets in different subgroups.
Illustration
In this study, we purported to examine the congruence and incongruence between students and teachers in their ratings of student academic behaviors by building a trifactor mixture model with the common factor and informant perspective factors and in tandem to identify heterogeneous groups of targets based on their scores on such factors. In addition, to explain the extracted latent factors and latent classes, we employed student grade as a predictor in the trifactor mixture model. The mean differences across latent classes in reading and math achievement scores were also examined. In this illustration, we explicate how to specify and identify a trifactor mixture model, to test measurement invariance across latent classes, and to select a model to determine the number of latent classes and the level of measurement invariance. When predictors or outcomes are considered in the trifactor mixture model, when and how to enter those variables are discussed.
Participants and Measures
The data in this study were extracted from FastBridge Learning (FBL; www.fastbridge.org). The sample included 24,094 students across kindergarten through twelfth grade in the 2016-2017 academic year in the United States (age M11.07 years, SD 2.61, 14.7% missing; 49.6% males, 47.0% females, 3.4% missing; 40.3% White, 29.2% non-White, 30.5% missing).
The Social, Academic, and Emotional Behavior Risk Screener (SAEBRS; Kilgus & von der Embse, 2014) assessment suite is a multi-informant universal screening system that includes teacher, parent (Taylor et al., 2019), and student versions (von der Embse et al., 2017) and was well validated in previous studies (e.g., Iaccarino and others 2019). In this study, we used the academic behavior subscale in the SAEBRS–Student Rating Scale (i.e., mySAEBRS) and SAEBRS–Teacher Rating Scale (i.e., SAEBRS-TRS). Academic behaviors are defined as behaviors that influence a student’s ability to benefit from and participate in academic instruction and include both facilitative (production of acceptable work) and inhibitive (distractedness) items (Kilgus et al., 2015). For both student and teacher rating scales, the academic behavior subscale has six items in 4-point Likert-type scale and these items are parallel between student and teacher scales (see Table 1). After reverse-coding of negatively worded items, higher scores indicate better academic behaviors. The Cronbach’s alpha was .63 for students and .92 for teachers.
Item Descriptive Statistics and Correlations of Academic Behaviors Rated by Students (S) and Teachers (T).

Note. Correlations are all statistically significant at α = .01. S1/T1 = Difficulty working independently; S2/T2 = Distractedness; S3/T3 = Good grades; S4/T4 = Like school; S5/T5 = Participation; S6/T6 = Preparedness for instruction.
Of note is that although all 24,094 students completed the self-report of academic behaviors without missing responses, only 14,560 students had the corresponding teacher ratings. In other words, almost 40% of students were missing in teacher ratings. However, missingness in teacher ratings was not associated with any items and student demographic variables. Thus, missing data were handled with full information maximum likelihood utilizing all available cases under the assumption of missing at random.
We treated the 4-point Likert-type scale variables as continuous. Although 4-point Likert-type scales can be considered as categorical, estimating the threshold structure of categorical data seems by and large challenging especially as the number of latent classes increases (Lubke & Neale, 2008; Wang et al., 2020), which will be discussed further later. The item statistics did not show any serious departure from normality with reasonable skewness and kurtosis values.
Model Specification and Identification
Three types of factors were constructed in the trifactor model: common factor, informant perspective factor, and item specific factor. All 12 items, six student self-ratings and six teacher ratings, loaded on the common factor that represents academic behaviors. In addition, the six items of student ratings loaded on the student perspective factor; the six items of teacher ratings loaded on the teacher perspective factor. Because each item was rated by both students and teachers, the item specific factor was also modeled to assess item bias. This item specific factor is analogous to the item correlation between two raters. It is assumed that these three types of factors are orthogonal to each other and their factor correlations were fixed at zero. From this orthogonality the variances in the student and teacher ratings are partitioned to multiple sources and the contribution from each of three sources can be evaluated by comparing the magnitude of factor loadings associated to each factor.
For the common factor of academic behaviors, measurement invariance between students and teachers was assumed. Thus, for each item the factor loading of students was constrained equal to that of teachers as illustrated in Figure 1. This invariance constraint is not necessary for informant factors because when informants are distinctive like students and teachers, it is reasonable to assume that student and teacher perspective factors represent different constructs unique to each informant. Based on the previous study of the trifactor model using the current data (von der Embse et al., 2019) the intercepts were constrained equal between the parallel items of students and teachers except one item. The two loadings of each item specific factor should be constrained equal and its variance should be fixed at one for model identification. This equality-constrained factor loading represents the correlation between the parallel items rated by multiple informants conditional on the common and informant factors. With the current data of academic behaviors, we observed that several item specific factor loadings were estimated at zero and thus constrained at zero.
For the identification of the trifactor mixture model with multiple latent classes, the variances of common and student perspective factors were fixed at one for the reference class (the last class in this example) while the teacher perspective factor variance was allowed to be freely estimated across all latent classes. The means of the common factor and the student and teacher perspective factors were fixed at zero for the reference class while those of the other latent classes were freely estimated so that the estimated means of the other classes represent the factor mean differences from the reference class. 5 All item-specific factor means and variances were fixed at zero and one, respectively, for identification.
Measurement Invariance Testing Across Latent Classes
Because the trifactor mixture model is a measurement model, we can evaluate the level of measurement invariance across latent classes: configural, metric, and scalar invariance. In the configural invariance model, all parameters were allowed to vary across latent classes except the aforementioned constraints made for identification and residual variances. Note that residual variances should be freely estimated across classes in the configural invariance model. However, the free estimation of residual variances often leads to nonconvergence in factor mixture modeling and thus we constrained them equal across classes. For the metric invariance model, the factor loadings were constrained equal across latent classes. For the scalar invariance model, the intercepts were constrained equal across latent classes in addition to the factor loadings. The level of measurement invariance was determined by comparing these models for the best fit as explained in detail in the following section. When scalar invariance was not satisfied in this illustration, we considered partial scalar invariance by relaxing two item intercepts to be different across latent classes.
Testing Procedures and Model Selection
In the trifactor mixture modeling, the number of latent classes is unknown and so is the level of measurement invariance (Kim et al., 2017; Lubke & Muthén, 2005). Thus, both should be determined simultaneously. A common practice in the exploratory approach is to build a series of models with one to a certain number of latent classes in different levels of measurement invariance. Thus, as Kim et al. (2017) demonstrated, we constructed three levels of measurement invariance for each latent class model: one-class, two-class scalar, two-class metric, two-class configural, . . ., four-class scalar, four-class metric, and four-class configural. These models were compared and the number of classes and the level of invariance were concurrently determined by identifying the best fitting model among them.
To select the best fit model in model comparisons, multiple criteria are usually employed. In this example, we used information criteria (IC) such as Akaike information criterion (AIC; Akaike, 1974), Bayesian information criterion (BIC; Schwarz, 1978), and sample-size adjusted BIC (saBIC; Sclove, 1987). The model with the lowest IC values is generally considered as the best fit. When two models are nested by relaxing additional parameters to estimate, for example, two- and three-class models, a likelihood ratio test (LRT) is also a common method of model comparison. However, the LRT statistic (−2*log likelihood) in the mixture modeling does not follow the chi-square distribution given the degrees of freedom difference between two competing models because regularity conditions do not hold (McLachlan & Peel, 2000). 6 Thus, alternative LRTs were proposed. In this example, we used Lo–Mendall–Rubin likelihood ratio test (LMR LRT) and adjusted LMR LRT. The statistical significance in the LRT indicates that the C class model is supported over the C– 1 class model. The distinctiveness of latent classes and the accuracy of class membership assignment can be evaluated with the entropy but it was reported that the entropy (or the assignment accuracy) tends to decrease as the number of latent classes increases (Collins & Lanza, 2010).
Trifactor Mixture Model With Covariates or Outcomes
The variable we considered for the demonstration of the trifactor model with covariates was student grade. We selected sixth grade as a reference and created 12 dummy-coded variables that represent each grade level from kindergarten to 12th grade in comparison with sixth grade. The 12 student grade variables were entered as predictors in the trifactor mixture model. In the factor mixture modeling with both latent factors and latent classes, the covariates can be modeled in many different ways. The covariates can be introduced to explain the extracted latent classes, which is illustrated as Path (A) in Figure 1. The covariates can explain the variability in latent factor scores (common factor and informant perspective factors), which is illustrated as Path (B) in Figure 1. Finally, by including a path from a covariate to one of the items, we can model and test the measurement noninvariance of the item in terms of the covariate (Path (C)).
In the mixture modeling literature, when to include covariates has been discussed even though no consensus has been reached (Wang et al., 2020). One option is to include covariates when determining the number of latent classes simultaneously. Lubke and Muthén (2007) and Asparouhov and Muthén (2014) found that this simultaneous approach enhanced the correct class enumeration and class assignment by improving the class separation when the covariates were the true predictors of class membership. On the other hand, the inclusion of covariates changes the relationship of the variables and thus, models with and without covariates produce different solutions with respect to the number of classes and the class assignment of individuals. To avoid the shift of latent classes due to the inclusion of covariates, researchers recommended the three-step approach (e.g., Vermunt, 2010). That is, latent classes are identified and estimated first. Then, the estimated class probabilities and measurement errors are saved. In the third step, the effects of predictors on the predetermined class membership are estimated and tested with the uncertainty of class membership taken into account.
In this illustration, we first established the trifactor model and determined the number of latent classes without covariates (namely, unconditional trifactor mixture model). Then, while fixing the number of latent classes to that determined with the unconditional trifactor mixture model, the grade variables were included in three different ways: as predictors of latent classes, as predictors of latent classes and latent factors, as predictors of latent classes, latent factors, and potential DIF (differential item functioning) item intercepts. Note that this approach is different from the three-step approach because the estimated class probabilities from the unconditional model were not saved and used when the covariates were added. Thus, we closely investigated whether or not the class membership estimated in the unconditional model changed notably when the grade variables were introduced as predictors. When the grade variables explained latent classes only, we also employed the three-step approach using the R3step option in Mplus.
Finally, we investigated how the identified latent classes of academic behaviors are different with respect to reading and math achievement scores. The reading and math scores were standardized within grade. 7 Then, we used the three-step approach to explain reading and math scores with the predetermined class membership as a predictor adopting the BCH option in Mplus.
Throughout this study, we set alpha at .001 given a large sample size. We used Mplus 7.4 and 8.4 (Muthén & Muthén, 2015, 2019) for all data analyses (version 8.4 for the BCH and R3STEP options). See Supplemental Appendix (available online) for the Mplus syntax. For the estimation method, we adopted the Mplus default, robust maximum likelihood. To avoid local maximum which is common in the mixture model estimation, we initially set 200 and 10 for the initial stage random starts and final stage optimization, respectively, but when the best log likelihood was not replicated, we increased the values up to 500 and 50, respectively. Note that all the models up to three classes had the best log likelihood replicated. For four or more classes, we consistently observed one class with a very low or zero proportion and it appeared that the increase of random starts (up to STARTS = 500 50) did not change the solutions. We were cognizant of unstable and untrustworthy solutions especially with local maxima and thus scrutinized the parameter estimates based on our knowledge of the estimates from previous studies and also compared the solutions across different models to check whether adding a class resulted in notable changes in the estimates.
Results
Descriptive Statistics
The descriptive statistics of six items of academic behaviors rated by students and teachers are presented in Table 1. The means of the 4-point scale items ranged from 1.76 to 2.17 for students and from 1.97 to 2.24 for teachers. The absolute values of skewness and kurtosis were all less than 1.5. The item correlations of teacher ratings were moderate to high whereas those of student ratings were lower especially for items 1 and 2. The correlations between student and teacher ratings ranged from .09 to .33.
Unconditional Trifactor Mixture Model: Class Enumeration and Measurement Invariance
The results of trifactor mixture models and simultaneous measurement invariance testing are summarized in Table 2. Note that the models with five latent classes did not yield reasonable solutions: for example, the estimated proportion was zero for one class. Thus, we compared the trifactor models of up to four latent classes.
Class Enumeration and Measurement Invariance of Trifactor Mixture Model for Academic Behaviors.
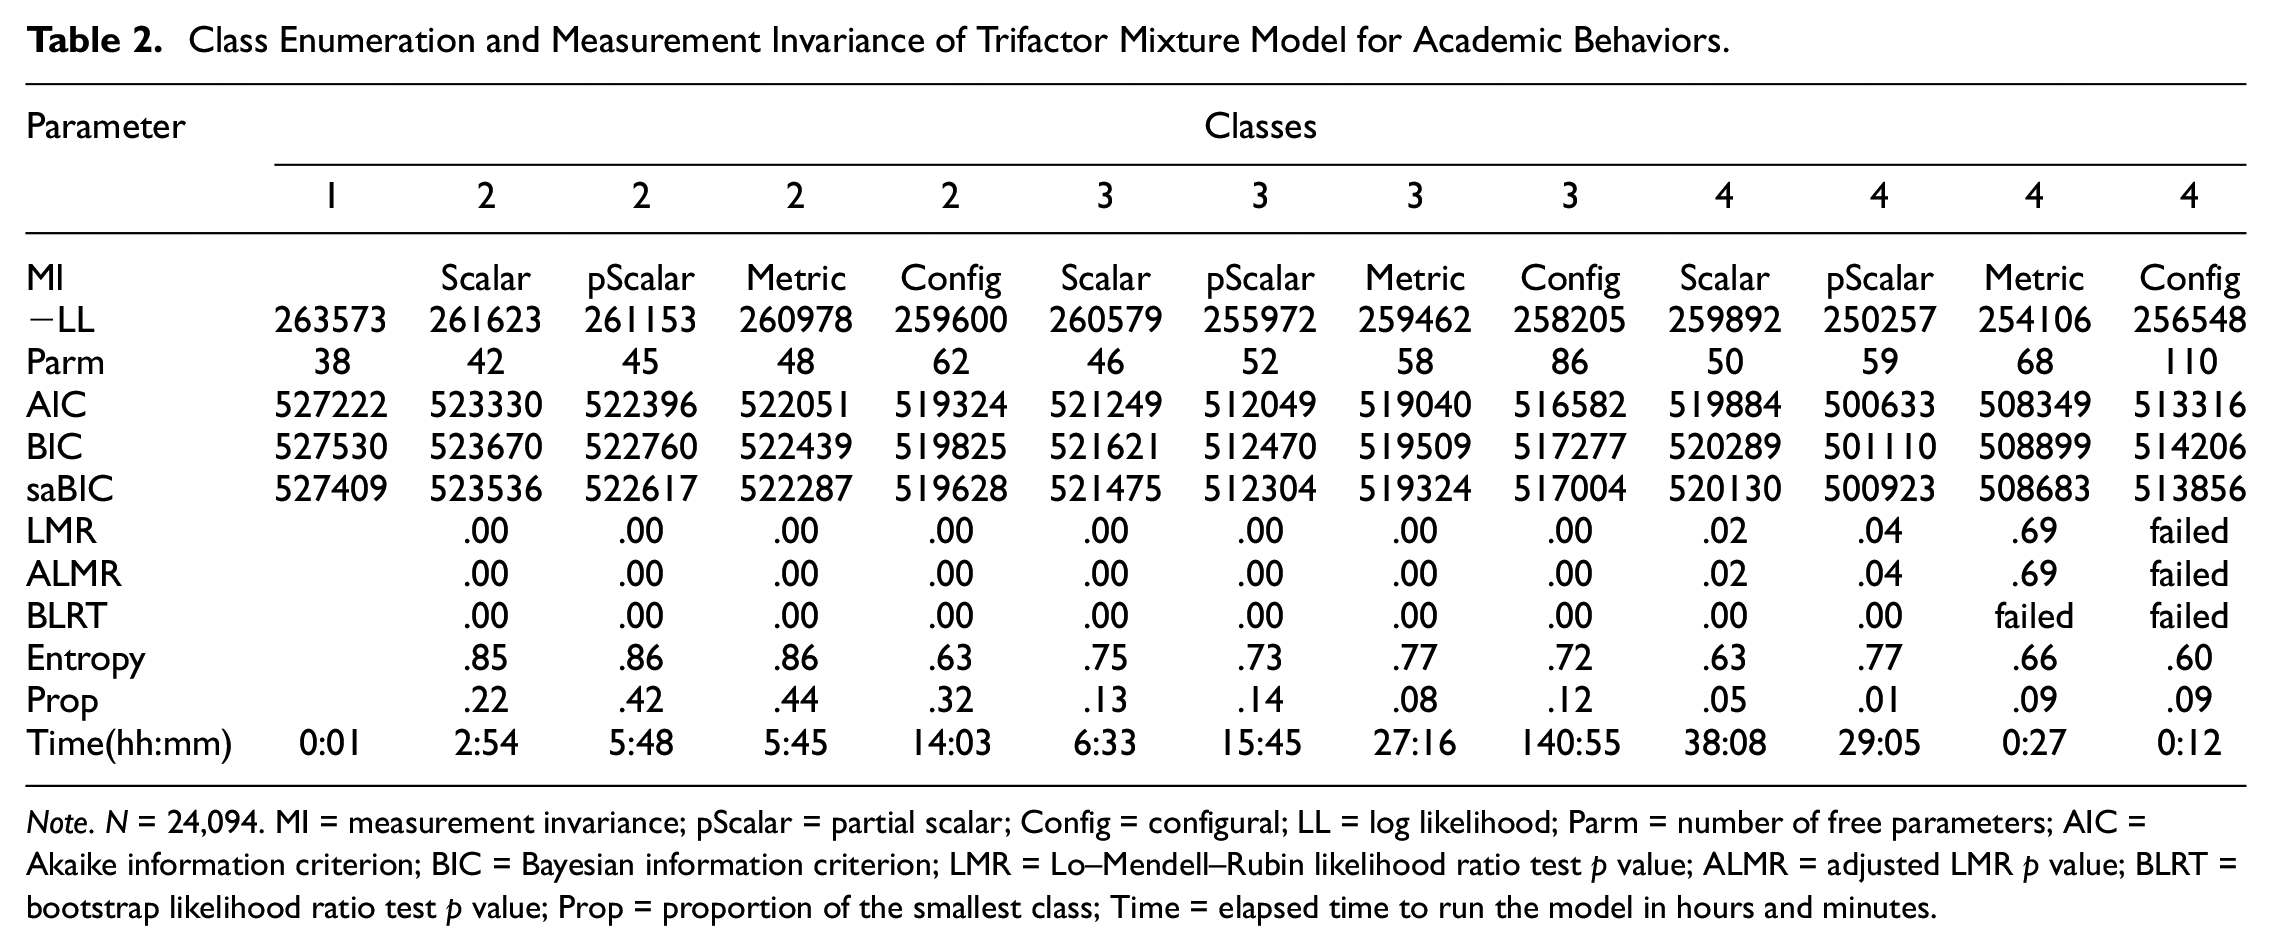
Note. N = 24,094. MI = measurement invariance; pScalar = partial scalar; Config = configural; LL = log likelihood; Parm = number of free parameters; AIC = Akaike information criterion; BIC = Bayesian information criterion; LMR = Lo–Mendell–Rubin likelihood ratio test p value; ALMR = adjusted LMR p value; BLRT = bootstrap likelihood ratio test p value; Prop = proportion of the smallest class; Time = elapsed time to run the model in hours and minutes.
First, because the scalar invariance models generally fit worse than the metric invariance models, partial scalar invariance was considered. Two of the item intercepts (Items 3 and 4) were allowed to be freely estimated across classes, which improved model fit considerably. In terms of the number of classes, the LRT and adjusted LRT preferred three latent classes when the alpha .001 was applied. On the other hand, all ICs supported the four-class partial scalar invariance model with the lowest values. However, after visually inspecting all fitted models and scrutinizing all parameter estimates, we selected the three-class partial scalar invariance model for several reasons. In the four-class partial scalar invariance model, the proportion of one class was only 1%. Importantly, the results were almost identical between three- and four-class partial scalar invariance models except this 1% class which was a fraction of one class in the three-class solution. Also note that we found several models with lower ICs but did not consider them because they produced unreasonable parameter estimates (e.g., one of factor loadings was unacceptably large and the parameter estimates were wildly different from those in the other models).
The parameter estimates of three-class partial scalar invariance model are shown in Table 3. The patterns and relations of trifactors in the trifactor mixture model were generally consistent with those of the trifactor model that did not analyze the population heterogeneity in the previous study (von der Embse et al., 2019). Item specific factor loadings were either zero or near zero indicating minimum item bias. Common factor loadings were substantial with magnitude between .28 and .52, but lower than teacher perspective factor loadings, which ranged between .43 and .91. Student perspective factor loadings were between −.07 and .59. Interestingly, Items 1 and 2 of student ratings were mostly related with the common factor with minimal contribution from the student unique perspective factor. Note that these two items showed very low correlations with the other student items but higher correlations with teacher items. As observed in item correlations and Cronbach’s alphas, teacher ratings showed much higher R2 (.44-.99) than student ratings (.24-.52).
Standardized Item Parameters of Trifactor Mixture Models for Academic Behaviors.
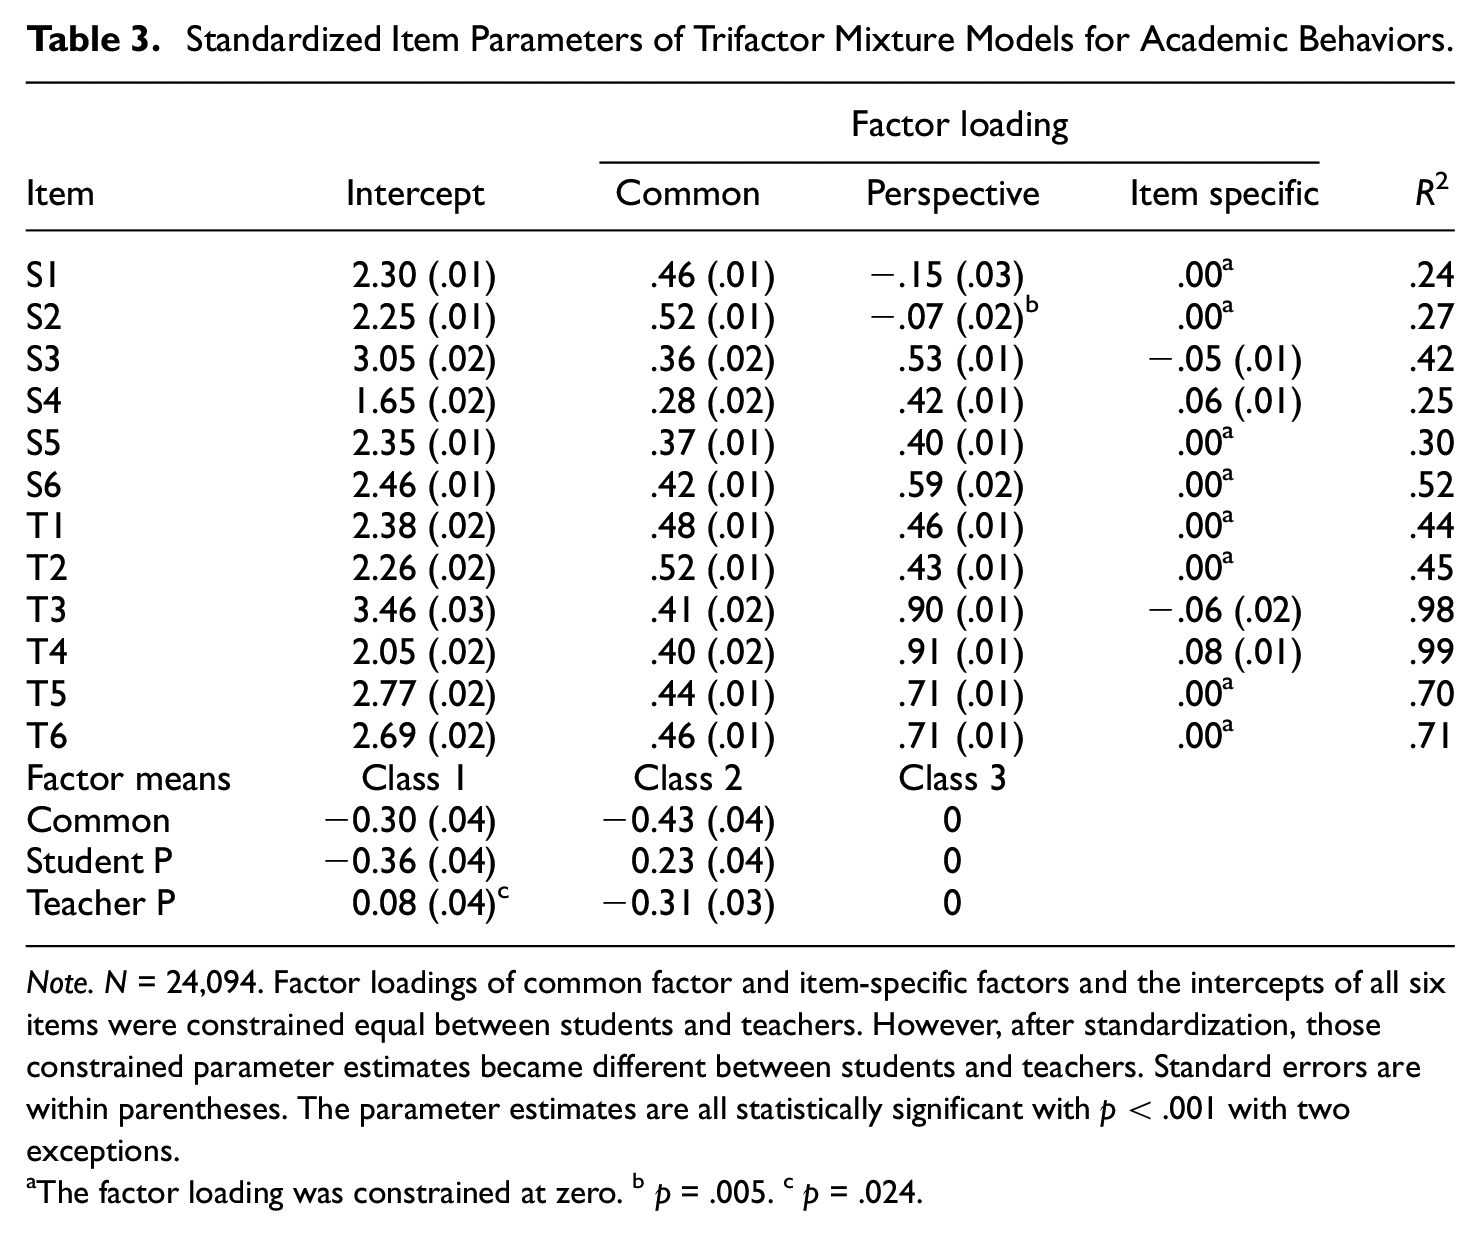
Note. N = 24,094. Factor loadings of common factor and item-specific factors and the intercepts of all six items were constrained equal between students and teachers. However, after standardization, those constrained parameter estimates became different between students and teachers. Standard errors are within parentheses. The parameter estimates are all statistically significant with p < .001 with two exceptions.
The factor loading was constrained at zero. bp = .005. cp = .024.
Under partial scalar invariance, we observed three heterogeneous classes based on the means of three factors (common factor, teacher perspective factor, and student perspective factor), which are reported at the bottom of Table 3 and illustrated in Figure 2. Of note is that one of the classes was a reference for which the means of three factors were all set to zero. The majority of participants (70.3%) turned out to be in the reference class. In other words, the large proportion of participants belonged to the group in which their scores of common factor, student perspective factor, and teacher perspective factor are consistent on average (Class 3, namely, congruent). On the other hand, the other two classes showed obvious disagreement between students and teachers. Interestingly, disagreement happened in the lower tiers of common factor. The class we named as high student perspective (Class 2, 14.4%) showed that student-specific factor scores were high whereas common factor and teacher perspective factor scores were generally low. The class we named as high teacher perspective (Class 1, 15.2%) showed the opposite pattern: Teacher-specific factor scores were high whereas common and student-specific factor scores were low.
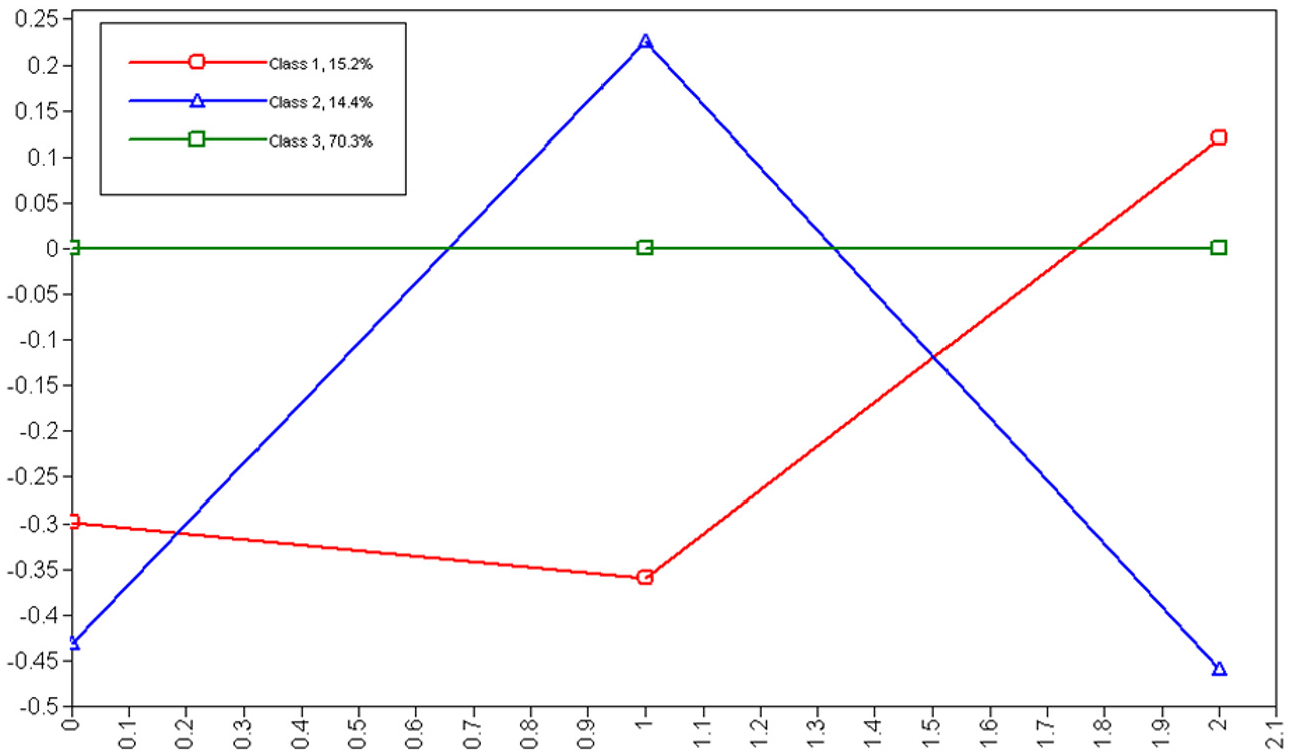
Plot of the estimated trifactor means by latent classes.
Trifactor Mixture Models With Predictors and Outcomes
We constructed the relations of predictors (12 dummy-coded grade variables) with class membership in three different ways as illustrated earlier in Figure 1: Grade explained class membership only; class membership and common and informant factors; and class membership, latent factors, and item intercepts that were deemed noninvariant across grade levels. These three models were compared using model selection criteria as demonstrated in class enumeration. Including grade variables as predictors of class membership did not result in any notable changes from the unconditional trifactor mixture model. However, when we included the effects of predictors on the latent factors in addition to class membership, we observed considerable changes not only in the class assignment but also in the parameter estimates and some of the estimates were not very reasonable. Thus, although the third model in which the grade variables explain latent classes, latent factors, and items showed the lowest ICs, we report the model with predictor effects on only class membership for illustration purposes because this model preserved the three classes we identified in the unconditional model.
The unstandardized coefficients of grade variables on class membership and the corresponding odds ratios (the odds of a certain grade students in comparison to sixth graders to belong to Class 1 or Class 2 instead of the reference Class 3) are shown in Table 4. We observed a general tendency that middle school students in Grades 7 through 9 were more likely to belong to high teacher perspective class than the congruent class. On the other hand, lower grade-level students such as third to fifth graders were likely to belong to high student perspective class, but the effects were not statistically significant at α = .001 with odds ratio less than 1.50. Of note is that we did not control for any other covariates and the effects could be different by modeling other effects such as grade effects on the latent factors. For example, when the effects of grade on latent factors were also modeled, the grade variables showed apparent effects on student perspective factors (but almost no effect on the other two factors), and the grade effects on class membership were not shown. Thus, this conditional model with grade effects on class membership only should be considered as demonstration and the results here should be taken with caution.
Conditional Trifactor Mixture Model With Covariates (Grade).
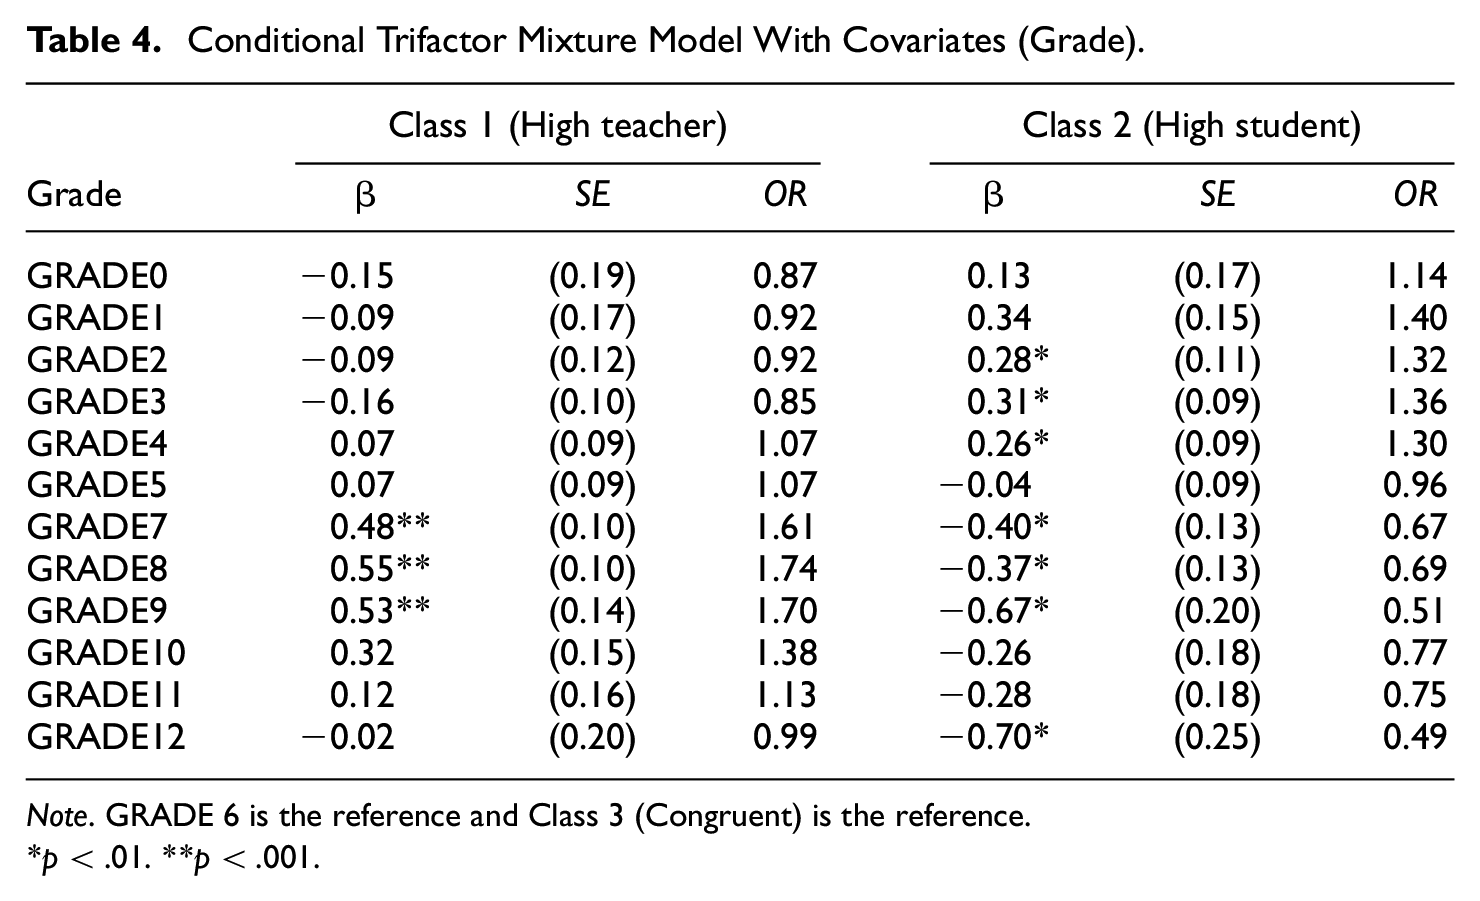
Note. GRADE 6 is the reference and Class 3 (Congruent) is the reference.
p < .01. **p < .001.
Finally, we investigated whether the identified three latent classes differ in their academic achievement, reading and math using the BCH option in Mplus. Chi-square tests showed that all pairwise comparisons as well as the overall mean comparison were statistically significant. The congruent class showed the highest performance in reading and math followed by the high teacher perspective class. Because the reading and math scores were standardized, the mean differences shown in Table 5 can be considered as standardized mean differences or effect sizes. The high student perspective class showed substantially lower reading and math scores on average than the congruent and high teacher perspective classes.
Chi-square Tests of the Differences Between Latent Classes in Reading and Math.
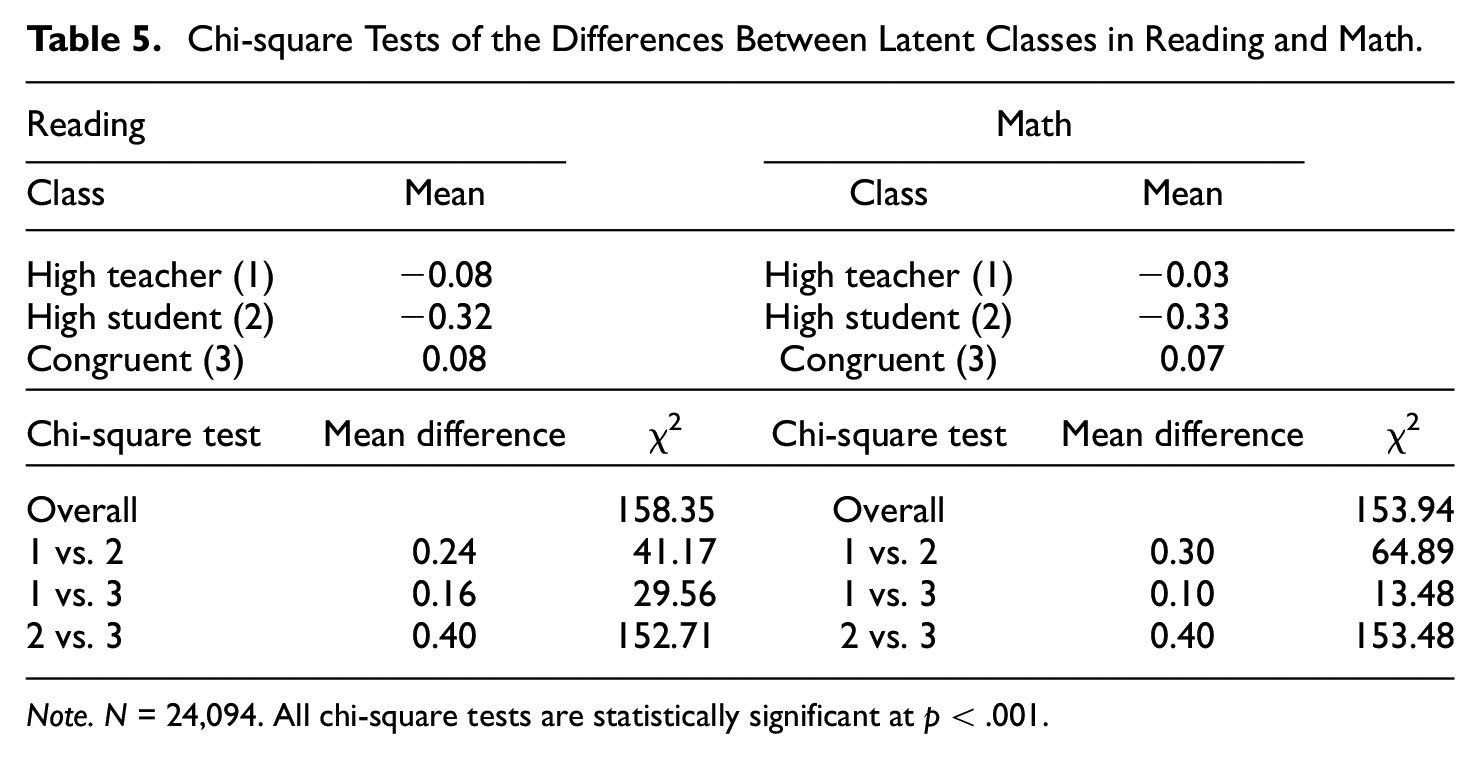
Note. N = 24,094. All chi-square tests are statistically significant at p < .001.
Discussion
The trifactor model is useful for separating the common factor from the informant perspective factors taking account of item bias and measurement errors and simultaneously classifying targets into subgroups in terms of their scores in those factors. We also demonstrated that the extracted latent factors and latent classes can be further explained by a set of predictors or can explain other variables of interest. However, generally the factor mixture model including the trifactor mixture model as a special case is very complex because two unobserved components (latent factors and latent classes) should be estimated in tandem. Thus, there are several issues to consider when conducting a factor mixture analysis.
First, nonconvergence and unstable solutions are common issues in factor mixture modeling. Nonconvergence could occur when an additional class is forced to be estimated when there is no further heterogeneity. In this case, the proportion of one class could turn out to be zero even when the model converges. However, the high complexity of the fitted model could also lead to nonconvergence, for example, fully unconstrained model such as configural invariance model. Thus, researchers may have to impose unintended constraints to have the model converged or to obtain an admissible solution. Sometimes the software program, for example, Mplus automatically constrains some parameters to avoid singularity or other nonconvergence problems and presents warning messages.
Future research is called for about the robustness of factor mixture modeling under the unnecessary constraints that are imposed to improve convergence. In growth mixture modeling. McNeish and Harring (2020) proposed a constrained model (i.e., a covariance pattern mixture model in which factor variances are fixed at zero) to increase convergence without sacrificing the ability to address substantive research questions in applied research. Others may argue that any unnecessary constraints could result in model misspecification, which in turn results in biased estimates and other statistical consequences. For example, Morin et al. (2011) noted that the constrained model could result in substantially different solutions from the unconstrained growth mixture model although both models extracted the same number of latent classes. Potentially even more problematic, constraints on different parameters could lead to different solutions (Nylund-Gibson & Masyn, 2016; Vermunt, 2010).
In the illustration, we constrained residual variances equal across latent classes. In confirmatory factor analysis with observed groups, Joo and Kim (2019) found that the misspecification of residual variances and covariances (specifying equal residual variances and covariance between groups when they were heterogeneous) could affect the test of measurement invariance (particularly, metric invariance) especially with misspecified covariances between groups, but such constraints were less consequential in estimating and testing factor means. On the other hand, Enders and Tofighi (2008) reported that misspecifying residual variances equal across latent classes in the growth mixture modeling led to biased and less precise estimates of growth trajectories and variance components. Without established best practice under model nonconvergence, researchers in practice may not know whether the constraints are correct or incorrect specifications (thus help or hurt) necessitating an inspection of the potential impact of the constraints on the solutions to make an informed decision. For example, we observed that some models yielded very different solutions from the original trifactor model (without mixture) and some estimates were not reasonable (e.g., unstandardized factor loading >20; intercept >10). Hence, even when these models showed lower ICs, they were not considered in the model comparisons. Similarly, when the software program shows warning or error messages involving nonconvergence or inadmissible solutions, researchers should inspect what parameter causes such error and how it could be avoided. For example, we often had error messages about the item specific factor loadings and found the estimates were literally zero. The error message disappeared after we constrained the related parameters at zero. Methodologically, future research on which parameter constraint (e.g., equal residual variances or factor variances across latent classes) makes a more or less impact on the performance of FMM is also much needed.
Evaluating and developing proper model selection methods in mixture modeling is another area on which more methodological work is needed. One critical issue is that the model selection criteria that are commonly employed in the mixture modeling such as information criteria and LRTs are known to be sensitive to model complexity and sample size not to mention class separation. Thus, different studies in model selection methodology provide different suggestions without consensus (Clark et al., 2013; Kim et al., 2016; Nylund et al., 2007; Tein et al., 2013). For example, BIC, one of the most widely used criteria, is known to be less sensitive to class separation when sample size is small given model complexity (e.g., Kim et al., 2016; Lukočienė & Vermunt, 2010; Yang, 2006). However, when sample size is extremely large, all ICs and LRTs tend to over-extract latent classes (Kim & Wang, 2019). In other words, simply increasing sample size may not be a solution although FMM requires a large sample for reasonable solutions. In reality, it is difficult to know whether latent classes are underextracted given a relatively small sample size, overextracted due to over sensitivity of ICs to minor heterogeneity, or correctly enumerated. Hence, one consensus among methodologists is that it is a crucial practice to evaluate the extracted classes theoretically. As a side note, bootstrap LRT is sometimes recommended for model selection, but it should be noted that the execution time is tremendously longer, for example, maximum 145 hours for three-class configural invariance model in our example.
The mixture model is inherently exploratory because latent classes are unobserved and unknown in advance. The extracted latent classes do not have specific labels 8 and should be described on the basis of their characteristics. Thus, thorough investigation of the identified classes is essential in mixture modeling. Often this is done by including a set of predictors that can explain the class membership. In the trifactor model introducing covariates allows the investigation of the effects of predictors (e.g., target and informant characteristics variables) on the latent factors and latent classes and thus enhances the interpretations of the extracted factors and classes (e.g., who is more likely belong to each latent class). However, there is no consensus about when and where to include covariates in the mixture model. For example, it is reported that the inclusion of proper predictors of class membership in the mixture model improves correct class enumeration and classification accuracy (Asparouhov & Muthén, 2014; Lubke & Muthén, 2007). However, it is challenging to identify a good and quality predictor before seeing the extracted latent classes in reality and researchers in practice may naturally take the route of three-step approach (Vermunt, 2010). In addition, it is difficult to know whether the predictors can predict which component of the model such as class membership, latent factors, observed indicators, or any combination of them. Recently, Wang et al. (2020) investigated the role of covariates in factor mixture modeling and found that a model comparison approach using ICs can help search for a correct specification of covariates. That is, researchers can take an exploratory approach to determine which predictor should be included for which component. However, as noted earlier, different ways of incorporating covariates will lead to different solutions of the factor mixture model and the resulting factors and classes could be profoundly different across models. Thus, the decision could depend on research interest, and theoretical considerations will be of importance.
Implications for Multi-Informant Studies
The challenges with multi-informant data include how to model and assess the congruence and incongruence between informants and how to use the scores when they disagree. The trifactor mixture model allows researchers to explicitly separate the agreement from the disagreement using latent factors: common factor and informant perspective factors. Such separation is more meaningful with the trifactor model because item specific factors and measurement errors are also taken into account by employing a measurement model. Furthermore, the explicit modeling of common and informant perspective factors brings on many benefits as discussed earlier. For example, researchers can assess relative contribution of common and informant factors on each item, which is essential to the development and validation of multi-informant scales. In the illustration, we found that two items in the student self-report had very low correlations with the other items. However, the trifactor mixture model showed that these items were fairly related to the common factor with little or no contribution from the student perspective factor. In other words, these items are legitimately valid items of academic behaviors without much impact of student unique perspectives on academic behaviors. This finding cannot be discovered without unraveling the contributions of common and perspective factors on each item.
The trifactor mixture model has another important implication to the multi-informant research. One explanation of the incongruence between informants in the literature is that multiple informants fundamentally interpret and respond to the items of a construct differently (Flake & Petway, 2019). This theoretical explanation can be tested with the trifactor mixture model, that is, measurement invariance testing between informants. Importantly, measurement invariance can be tested for common and informant perspective factors, separately. Measurement invariance between informants in terms of common factor is imperative for the meaningful interpretation and use of common factor scores whereas, as Bauer et al. (2013) noted, measurement invariance is not assumed for informant perspective factors when informants are distinctive (e.g., students and teachers). In addition to the explicit test of measurement invariance between informants on each factor, the trifactor mixture model enables testing measurement invariance across subgroups of targets as demonstrated in this study. Through such investigation researchers are informed of potential groups of targets who are affected more or less by informant perspective factor or informant bias.
Furthermore, employing predictors in the trifactor mixture model enhances the investigation on the factors related to concordance and discordance to address questions such as why informants disagree and what characteristics of informants are related to divergent perspectives. Because common factor and each of informant factors are all separately modeled, researchers have flexibility in including predictors relevant to each factor, for example, student characteristics variables to explain the student perspective factor and both teacher and student characteristics variables for the teacher perspective factor. Also, predictors and outcomes are employed to describe and explain the subgroups of targets that are identified in the mixture modeling. For example, we found that students who scored high in their own perspective factor but low in both common factor and teacher perspective factor of academic behaviors showed lower performance in reading and math achievement compared to the other students.
One interesting finding in this study is that in the two latent classes (i.e., high student and high teacher) students actually scored low for the common academic behavior factor although they scored high for one of informant perspective factors. This could indicate that disagreement between students and teachers occurred more likely when students had poor academic behaviors. This could further imply that selecting one of informants could lead to incorrect decisions about student academic behaviors and demonstrate the importance of using multi-informant data. For example, when student self-report is used for academic behaviors, some students at risk may be excluded from receiving proper intervention at school because their self-ratings are high.
The combined approach to multi-informant data with latent continuous and latent categorical variables can be useful to develop an intervention for a specific group of targets considering the environment where they need such intervention. Suppose multiple informants observe the targets in different settings (e.g., teachers at school and parents at home rate child problem behaviors) and a group of students are identified as high at school in terms of teacher perspective factor but low at home based on parent perspective factor. Then, an intervention could be developed for this specific group considering the environment (e.g., school settings) where problem behaviors more likely occur (Roskam, 2018).
The trifactor mixture model generates factor scores that would be useful for multi-informant research. Researchers can model the predictors and outcomes of the factors directly in the trifactor model or use saved factor scores in subsequent data analysis. However, a note of caution is warranted for the use of factor scores especially for clinical decisions. The quality of factor scores depends on the correct specification of the model from which the scores are derived. It is not known how robust the factor scores are under model misspecification including under- or over-specification in the trifactor mixture model. Similarly, classification accuracy of the trifactor mixture model needs further investigation.
Limitations of the Study
In the demonstration, we treated the 4-point Likert-type scale variables as continuous. Many simulation studies investigated and compared various estimation methods for ordered-categorical data which are commonly used in social sciences. One common recommendation is that treating Likert-type scale data as continuous along with the maximum likelihood estimation is acceptable with five or more categories, but when the number of categories is three or less, categorical data analysis with robust weighted least squares is recommended (e.g., Beauducel & Herzberg, 2006; DiStefano & Morgan, 2014; Lei, 2009; Rhemtulla et al., 2012). However, previous simulation studies on mixture modeling reported estimation challenges with ordered-categorical data and consequently unsatisfactory correct enumeration even with a fairly large sample size (Lubke & Neale, 2008; Wang et al., 2020). The deteriorated performance of categorical factor mixture modeling may not be surprising because estimating one more class adds many more thresholds to estimate instead of one intercept per item, which increases the model complexity tremendously with the complication of threshold invariance across latent classes. However, treating 4-point Likert-type scale data as continuous and applying linear FMM should not be considered as an acceptable practice because the robustness of linear FMM with ordered-categorical data has not been investigated yet. Generally, the performance of FMM with ordered-categorical data warrants further investigation.
Another major limitation of the study is that we could not take into account the data dependency with students nested within teachers when estimating the trifactor mixture model because the teacher identification variable is not available. In addition, methods to handle data dependency specifically for the trifactor model or trifactor mixture model have not been discussed although multilevel factor mixture modeling in general has been demonstrated and investigated. Kim et al. (2018) demonstrated the multilevel confirmatory factor analysis model to test measurement invariance between multiple informants when one group of informants are nested within the other group of informants, for example, students nested within teachers. However, in their demonstration the construct of interest was classroom social environment, specifically, promoting social interaction which was at the teacher level. On the other hand, the trifactor mixture model demonstrated in the current study is for student academic behaviors which is at the student level. Accordingly, a different model specification is necessary, which calls for future research.
Conclusion
In this paper, we demonstrated how the trifactor mixture model that allows the latent continuous and latent categorical variables in tandem could enhance the research with multi-informant data. The trifactor mixture model is useful for multi-informant research to improve understanding of the common and unique perspectives of informants on the targets and enhance the use of scores from multiple informants. However, there are still many methodological challenges with factor mixture modeling in general and the users should be cognizant of such challenges. Also, more methodological work is needed to increase the usability of this model given its profound benefits.
Supplemental Material
sj-pdf-1-epm-10.1177_0013164420973722 – Supplemental material for Combined Approach to Multi-Informant Data Using Latent Factors and Latent Classes: Trifactor Mixture Model
Supplemental material, sj-pdf-1-epm-10.1177_0013164420973722 for Combined Approach to Multi-Informant Data Using Latent Factors and Latent Classes: Trifactor Mixture Model by Eunsook Kim and Nathaniel von der Embse in Educational and Psychological Measurement
Footnotes
Declaration of Conflicting Interests
The authors declared no potential conflicts of interest with respect to the research, authorship, and/or publication of this article.
Funding
The authors received no financial support for the research, authorship, and/or publication of this article.

Supplemental Material
Supplemental material for this article is available online.
Notes
References
Supplementary Material
Please find the following supplemental material available below.
For Open Access articles published under a Creative Commons License, all supplemental material carries the same license as the article it is associated with.
For non-Open Access articles published, all supplemental material carries a non-exclusive license, and permission requests for re-use of supplemental material or any part of supplemental material shall be sent directly to the copyright owner as specified in the copyright notice associated with the article.
