
Abstract
Developmental surveillance tools are used to closely monitor the early development of infants and young children. This study provides a novel implementation of a multidimensional item response model, using Bayesian hierarchical priors, to construct developmental profiles for a small sample of children (N = 115) with sparse data collected through an online developmental surveillance tool. The surveillance tool records 348 developmental milestones measured from birth to three years of age, within six functional domains: auditory, hands, movement, speech, tactile, and vision. The profiles were constructed in three steps: (1) the multidimensional item response model, embedded in the Bayesian hierarchical framework, was implemented in order to measure both the latent abilities of the children and attributes of the milestones, while retaining the correlation structure among the latent developmental domains; (2) subsequent hierarchical clustering of the multidimensional ability estimates enabled identification of subgroups of children; and (3) information from the posterior distributions of the item response model parameters and the results of the clustering were used to construct a personalized profile of development for each child. These individual profiles support early identification of, and personalized early interventions for, children with developmental delay.
Keywords
The overarching goal of early intervention in childhood development is to improve and strengthen development for a heterogeneous group of children who have a range of delays, including communication, motor, sensory, and perceptual concerns (Guralnick & Bruder, 2019). The developmental domains targeted for early intervention are unique to each child. Therefore, identifying the specific domains that require more focused attention is important for early interventions to be successful. This article proposes and demonstrates novel methodology for constructing comprehensive personalized developmental profiles that can be used to support routine developmental surveillance and personalized interventions.
The personalized profiles are constructed in three steps: (1) a multidimensional item response model is implemented using a Bayesian hierarchical framework, and applied to data collected through an online developmental surveillance tool; (2) the individual inferences obtained from the item response model are used to identify subgroups of children with similar developmental profiles, through the use of hierarchical clustering; (3) the results from the item response model and the clustering are combined to construct the profiles. The data extracted from the online developmental surveillance tool consist of a small sample of children with sparse measurements. Sparse data and small samples are common in routine data collection (Powell et al., 2003), and this article demonstrates that accurate personalized profiles can be constructed, even for children with very sparse measurements, by embedding the item response model within a Bayesian hierarchical framework. In addition, the uncertainty of the estimates can also be estimated and communicated using this framework.
In this article, a multidimensional item response model is used to jointly estimate children’s latent abilities in multiple developmental domains and attributes of the developmental milestones that are used to measure the latent constructs. In item response modeling, the probability of a correct response to an item is modeled as a function of both person characteristics (the latent ability of the person) and item characteristics (the difficulty and discrimination of the items; Fox, 2010). This study focuses on multidimensional item response models (also multidimensional item response theory or MIRT), which are used to model more than one latent trait or ability (Sheng & Wikle, 2007). These latent traits are often not independent; however, MIRT models account for the dependency between traits by directly estimating the correlations between latent traits through the incorporation of all subtests within one model, rather than analyzing each subtest separately (Cheng et al., 2009). MIRT can either be specified so that each item measures more than one latent trait, also known as between-item multidimensionality (Adams et al., 1997; Zhang, 2012) or as a multi-unidimensional IRT model, or within-item MIRT model, where each item only contributes to one latent ability (Adams et al., 1997; Sheng & Wikle, 2007). This study implements the second type of MIRT.
Implementing IRT models often requires large heterogeneous samples that reflect the range of population characteristics under investigation. When the purpose of the IRT model is for item calibration, then sample sizes of 500 or more are recommended (Reeve & Fayers, 2005). Moreover, most IRT models assume complete responses or only small amounts of nonresponse, as many missing responses can lead to biased estimates of both item and person parameters (Rose et al., 2015). Furthermore, IRT models are often estimated using maximum likelihood methods, which rely on asymptotic approximations that require large sample sizes to obtain accurate parameter estimates. Response data for item response models are typically nonnormally distributed and only have a small amount of sample data to estimate each parameter, particularly at the within-individual level (Fox, 2010). These features of item response models mean that using a maximum likelihood estimation–based approach could lead to inaccurate parameter estimates when used on small samples and sparse data.
Item response models that have been used in developmental research have focused on standardization and assessment of items from preexisting developmental screening tools, such as the Denver Developmental Screening Test (de Lourdes Drachler et al., 2007), the Ages and Stages Questionnaire (Chen et al., 2018), and the Paediatric Evaluation of Disability Inventory (Haley et al., 2010), or in the construction of new developmental screening tools (Lancaster et al., 2018). All of these previous studies used large samples of typically developing children to have sufficient numbers of children across the age range required for standardization.
The sample of children assessed in this research predominantly have a developmental disability, so modeling strategies to account for this small, heterogeneous sample need to be implemented in order to obtain accurate personalized assessments. In addition, the data collected through the online tool is sparse, due to a high level of missing data. This sparsity arises because the children are at different stages through the online program, so some children are not old enough to have responded to the later milestones. In addition, the level of engagement differs between users, resulting in intermittent nonresponse. Sparse data are common in online environments such as recommender systems, where each individual only rates a small number of items from a possibly very large item pool (Demiriz, 2004). Bayesian hierarchical priors are used to overcome the sparse data and small sample problems.
Bayesian hierarchical priors improve parameter estimation for small samples and sparse measurements by pooling information from parameters of the same type (König et al., 2020). In the Bayesian hierarchical prior, the parameters at the bottom level of the hierarchy (e.g., the ability parameters for the children or the item parameters of the milestones) are related to each other and are viewed as a sample from a common population distribution (Gelman et al., 2013). The parameters of this population distribution are also given a prior distribution. By using a hierarchical prior, each individual-level parameter “borrows strength” from the corresponding parameters of other individuals with similar characteristics, and this is accomplished through shrinkage toward the population mean (Fox, 2010; Ntzoufras, 2011). It is this shrinkage property which makes the Bayesian hierarchical prior so useful for small samples and sparse data.
The use of Bayesian MIRT models has been demonstrated on both simulated and real data examples (de la Torre & Patz, 2005; Sheng & Wikle, 2008), but they used large and complete samples. Sheng (2012) and König et al. (2020) implemented Bayesian hierarchical univariate item response models for small samples, but both were simulation studies and they did not have sparse measurements. Only one example of a Bayesian hierarchical multidimensional item response model applied to small samples could be found in the literature (de la Torre & Hong, 2010); however, the smallest sample size used in the article was 500, which was part of a simulation study. This article presents a novel implementation of a Bayesian hierarchical MIRT model for a real world, small, very sparse sample. The MIRT model is the first step of the methodology developed in this article to construct the personalized developmental profiles. The MIRT models six latent traits, representing different functional domains of development. The functional domains are highly correlated, and the correlation structure is modeled explicitly within the MIRT model.
The second step of our proposed methodology is to use the information from the posterior distributions of the ability parameters to identify subgroups of children that have similar development across the functional domains. Hierarchical clustering is used to obtain these subgroups, as it is relatively easy to implement and provides graphical summaries that are interpretable for a wide audience.
The third step of the methodology combines information derived from the individual posterior distributions with the information collated from clustering the posterior estimates to construct a comprehensive developmental profile for each individual child. As the intention of the developmental profiles is to assist with developmental surveillance, information from the posterior distributions of the children’s abilities, combined with the clustering information, can be used to assist clinicians by (1) identifying at-risk children with lower ability and (2) identifying specific developmental domains to be targeted for personalized early interventions.
Method
Data and Sample Description
The data used in this study came from a parent-reported online surveillance tool, created by The Developing Foundation, a charity that offers support services for families of children or adults who have a brain injury or developmental disability (The Developing Foundation, 2017). The Foundation created the Developing Childhood surveillance tool (The Developing Foundation, 2017) to assist parents and carers to monitor and assess their own child’s achievement of early developmental milestones. The online program assesses 348 developmental milestones from birth to 3 years of age. These developmental milestones are categorized into six functional domains—namely, auditory, speech, tactile, movement, vision, and hand function. There are 58 milestones assessed in total in each domain. These milestone measurements are not spread uniformly across the 3-year period. Rather, within each functional domain, there are three milestones assessed each month for the first 12 months, two milestones assessed per month between 13 and 18 months, one milestone assessed per month from 19 to 25 months and the remaining three milestones measured at 28, 31, and 34 months, respectively. Example milestones are found in Table 1, which is reproduced from Gilholm et al. (2020).
Example 1-, 12-, 18-, and 34-Month Milestones in Each Functional Domain.

The data used in this study were extracted from the Developing Childhood program between February 2015 and February 2017. In total, 115 children used the program during this period. However, not all parents reported on all relevant milestones for their child. The information obtained for each child differs dramatically between children, depending on the age of the child and the level of engagement with the program. Overall, there is approximately 42% missing data across the entire sample, with later milestones having far more missing data compared with earlier ones. This phenomenon is discussed in detail later. Plots presenting the missing data patterns can be found in the Supplemental Material (available online).
Information regarding the disability status (i.e., whether the child has a disability and the type of disability) was not recorded for all participants. The children in the sample that did record this information have a diverse range of disabilities, including autism spectrum disorder, cerebral palsy, Down syndrome, and speech and hearing impairments. Although not all disability statuses were known, it is assumed that this sample had more children with a developmental delay or disability than the general population as they were using the services provided by the Developing Foundation. The results reported in this article and the supplemental material, as well as the information provided on Github, are provided at an aggregate level and preserve the privacy of the individual subjects in the study. For this reason, and since the data are nonidentifiable, the Queensland University of Technology’s Human Research Ethics committee waived the need for consent from the parents or guardians for the data used in this research.
Model
In this study, a two-parameter logistic MIRT model was used. The difficulty parameter refers to a milestone’s location on the continuous latent functional domain and the discrimination parameter refers to the slope of the milestone’s item characteristic curve (i.e., milestones with a steeper slope are better at discriminating between children who have high ability and those who have low ability). In addition to the two item parameters, the model also measures the ability of the children, which refers to the child’s location on the continuous latent functional domain (de Ayala, 2013).
The two-parameter MIRT model measures the probability of milestone achievement as follows (de la Torre & Patz, 2005):

where
The MIRT model was embedded in a Bayesian hierarchical framework (Fox, 2010), where prior distributions for the model parameters are imposed at two levels of the model hierarchy. At the first level, the individual parameters of the same type are aggregated and a prior distribution for the population of parameters is specified. At the second level, the parameters for this prior distribution, the hyperparameters, are also given prior distributions, or hyperpriors.
The priors adopted for this study are as follows. The vector of ability parameters for each child,
The hyperprior distribution for the multivariate normal hyperparameters
where
For the item discrimination parameters,

A directed acyclic graph of the hierarchical structure of the model.
The posterior distributions for all parameters were approximated through Markov chain Monte Carlo (MCMC) simulation. Specifically, the Hamiltonian Monte Carlo No-U-turn sampler (HMC NUTS) was implemented (Carpenter et al., 2017). For a thorough introduction to this method, please refer to Monnahan et al. (2017). The HMC NUTS sampler uses gradients to explore the target distribution more efficiently (Betancourt & Girolami, 2015). Because of this efficient exploration of the target space, the HMC NUTS sampler is able to overcome some of the computational problems associated with hierarchical models, such as sampling from funnel distributions resulting from high correlations between local and global parameters (Betancourt & Girolami, 2015).
In addition to using the HMC NUTS sampler, a noncentered paramaterization was used for modeling the multidimensional ability distributions, which removes the dependency between the ability parameters
The noncentered parameterization for
where the elements of
The full model with the noncentered reparameterization was written in the Stan programming language (Carpenter et al., 2017). The sampler ran four chains for 50,000 iterations each. Convergence of the chains for all model parameters was checked by assessing the trace plots, and by inspecting the
Hierarchical Clustering
Hierarchical clustering of the posterior distributions of the ability parameters for each child was performed to identify children with similar developmental profiles. First, a standardized posterior mean,
Second, the

where
To implement the hierarchical clustering, the Euclidean distance (James et al., 2013) and Ward’s linkage (Murtagh & Legendre, 2014) were used; both of these are common methods that are readily available in popular statistical programs. To identify the optimal number of clusters obtained from the hierarchical clustering, the NbClust package was used (Malika et al., 2014), which uses 30 different indices to assess the number of clusters, and the majority rule across the 30 indices was taken as the optimal number.
For this study, the clustering was performed in two stages. In the first stage, multivariate clustering was performed through hierarchical clustering of all six functional domain standardized posterior means. In the second stage, univariate clustering was performed by clustering each functional domain independently; this allowed subgroups to be identified both within and between functional domains.
All models were implemented in R (R Core Team, 2019), and the Bayesian hierarchical MIRT was implemented in Stan using the Rstan package (Stan Development Team, 2020). The code used to implement the models is available on the first author’s Github (Gilholm, 2020).
Results
Bayesian Hierarchical Multidimensional Item Response Model
Posterior estimates of the population parameters of the MIRT model and the associated convergence statistics, effective sample size and
Posterior Distribution and Convergence Statistics for the Population Parameters.

Note. ESS = effective sample size.
This model produced posterior distributions for the children’s abilities for each functional domain and the difficulty parameters for every milestone. The ability estimates are adjusted for the difficulty of the milestone, where the difficulty is estimated from the data. The posterior means of the children’s abilities and the milestone difficulties for each dimension are displayed in the Wright maps in Figure 2.

Wright maps of the posterior means for the milestone difficulty and child ability parameters for the six functional domains. The number for each milestone references the month and the sequence within the month that the milestone is expected to be achieved—for example, 1.1 is the first expected milestone to be achieved when a child is 1 month old, 1.2 is the second milestone expected to be achieved when a child is 1 month old, and so on.
Overall, the distribution of the posterior means for the children’s abilities is higher on the latent dimensions compared with the item difficulty distributions, showing that, on average, the children were able to achieve most of the milestones. There is also variation in the distributions of both the child abilities and the milestone difficulties between the functional domains. For example, there is more variation in the abilities and difficulties within the movement and speech domains compared with the tactile and vision domains.
The posterior distributions for the item difficulty and discrimination parameters for each milestone are summarized in Figure 3. Here it can be seen that earlier milestones are less difficult to achieve than later ones across all functional domains, as the difficulty steadily increases over time. However, Figure 3 also shows that there is much more variation in the posterior distributions for the difficulty parameters for the later milestones. This may be because only a small proportion of children have responded to these later milestones, which results in more uncertainty in the posterior distributions. The posterior distributions for the item parameters were also ranked to identify the most and least difficult or discriminatory milestones, respectively. The plots displaying the results of the ranking for each domain can be found in the supplemental material.
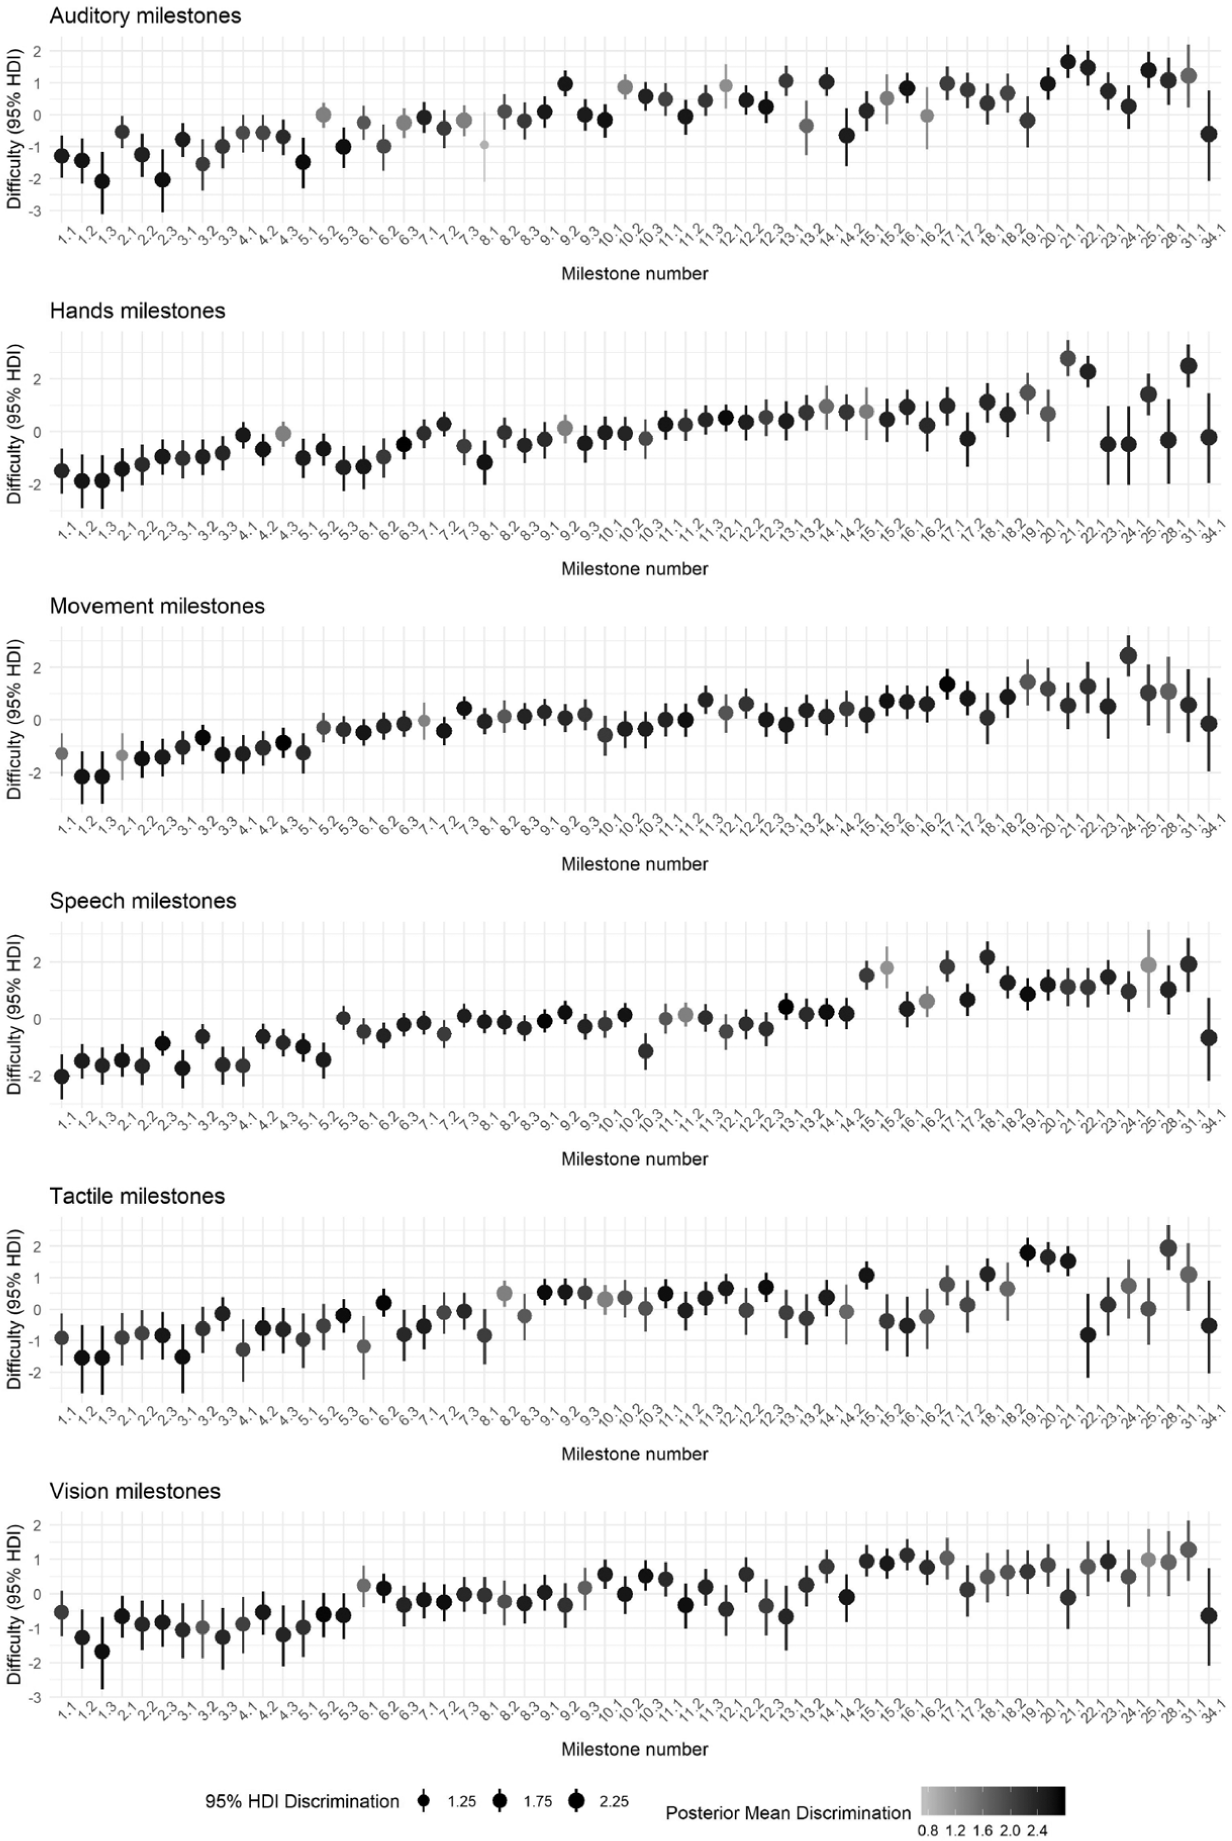
Bubble plots of the difficulty and discrimination parameters for each milestone within each functional domain. The location of the bubble and the bars refer to the posterior mean and the 95% HDI (highest density interval) of the difficulty parameter for that milestone. The color and size of the bubble references the posterior mean and 95% HDI of the discrimination parameter, respectively.
Hierarchical Clustering
The standardized posterior means of the ability parameters were clustered using hierarchical agglomerative clustering to identify subgroups of children showing similar developmental patterns. The clustering was executed using the standardized posterior means to adjust for the number of milestones completed for each child. Plots demonstrating the effect of the adjustment for each functional domain can be found in the supplemental material.
The clustering was performed in two stages, multivariate clustering and univariate clustering. The clusters identified from the multivariate clustering are displayed in Figure 4. Three clusters were identified, as determined by the cluster validation indices, and can be summarized as a high-ability cluster (left), a low-ability cluster (middle), and a moderate-ability cluster (right). Although these clusters are useful for identifying the average ability of each child across the six functional domains, they are not very informative in terms of specific ability within each functional domain. To identify subgroups within each of the functional domains, univariate hierarchical clustering was performed by clustering the standardized posterior means for each functional domain separately. The cluster validation indices revealed three clusters of high, moderate, and low ability for the auditory, hands, movement and speech functional domains, and two clusters of high and low ability for the tactile and vision functional domains. Descriptive statistics for the univariate clusters are displayed in the Supplemental Material.

Dendrogram and profile plots of the three clusters obtained from the multivariate hierarchical clustering.
Personalized Profiles
To create a personalized profile of development for every child, the information from the individual posterior ability distributions from the MIRT and the results of the multivariate and univariate clustering were combined. Figure 5 displays six of these profiles. The top, middle, and bottom rows of Figure 5 each contain two children who were classified into the high-, moderate-, and low-ability multivariate clusters, respectively. When comparing the two children within each multivariate cluster, it can be seen that the children in the left column have similar ability across the six functional domains (indicated by the univariate cluster color and shape); however, the children in the right column have variable ability across the six functional domains. This information is useful for identifying which specific functional areas need to be targeted for early intervention.

Standardized posterior mean and 95% HDI (highest density interval) for each functional domain. The bubble color references the univariate cluster membership and the size of the bubbles references the multivariate cluster membership.
In addition, by virtue of the MCMC, probability statements are able to be made from the posterior distributions of the parameter estimates. These probability statements can be made for each child and this personalized information can be included in the profile. Figure 6 contains an example of such information. The table in Figure 6 contains the number of milestones the child has completed for each functional domain, the probability that the child is above the population average for each domain, the mean rank and the percentile of the mean rank, as well as the corresponding 95% highest density intervals (HDI). By reporting the 95% HDI, the uncertainty in the estimates can be conveyed. For example, in Figure 6, although this child has a similar rank score for the movement and speech domains, the 95% HDI is much wider for the movement domain given that this child has only completed one milestone for the movement domain.

Example of a child’s profile with additional information from the posterior distribution.
Discussion
This research has demonstrated how personalized developmental profiles can be created through the use of multidimensional item response modeling, embedded in a Bayesian hierarchical framework, applied to a small sample of children with sparse information. Although the sample size was small and the measurements were sparse, by using a Bayesian hierarchical modeling framework, posterior estimates of ability were able to be constructed by borrowing strength from similar children. In addition, by combining the information obtained from clustering the posterior means of the ability estimates, this model provided estimates at the individual, subgroup, and population levels, providing a comprehensive picture of development for this population of children.
In this research, the individual-level posterior distributions of the ability parameters for each child not only show how each child is developing within each functional domain but also provide an estimate of uncertainty in this prediction. Measuring and communicating uncertainty in the estimates is especially important when using small sparse samples, so that parents and clinicians do not place undue confidence in the results for those with sparse data (Fischhoff & Davis, 2014). Communicating statistical uncertainty to nonscientific audiences is difficult and is often omitted from visualizations (Roberts & Gough, 2016). In this research, effort was made to both account for and communicate the uncertainty of the estimates. However, a 95% HDI may not be intuitive to understand for parents. Therefore, future research directions include appropriate approaches for visualizing and communicating uncertainty, for example, through the use of color coding or an uncertainty score.
This model also provided information on each milestone, through the posterior distributions for the difficulty and discrimination parameters. Probabilistically ranking the item parameters identified the developmental milestones that were both difficult and easy to achieve. In addition, milestones that were and were not discriminating between those with high and low ability were also identified. In particular, locating nondiscriminatory items can be used to improve the surveillance tool by removing or revising these redundant items.
The individual results of the Bayesian hierarchical MIRT model were able to be further explored by clustering the standardized posterior means of the individual ability parameters. By clustering the latent trait estimates, subgroups were able to be identified using the whole sample, as posterior ability estimates were obtained for all children, regardless of the number of milestones they had responded to. In addition, using the latent trait estimates greatly reduced the complexity of the clustering problem by reducing the dimensionality from 348 binary milestone measurements to six latent trait estimates. Both multivariate and univariate clustering were explored to identify clusters of average ability across all domains and ability within each domain, respectively. Through this process, children with low ability can be identified through the multivariate clustering, and then personalized interventions could be tailored to specific functional domains flagged as low ability identified through the univariate clustering.
This methodology has a number of limitations. First, no covariates were available for this sample of children. Incorporating covariates into a multilevel IRT model can help explain the differences in ability between individuals (Fox, 2004). A number of covariates have been identified that are associated with developmental delay, such as poverty, caregiver cognitive impairment, and low parental education (Scarborough et al., 2009). Incorporating covariates such as these into the model may help explain the differences in ability between children. Notwithstanding this, there is interest in fitting a model with no such covariates to evaluate the intrinsic magnitude and variation between ability scores of the children and difficulty of the milestones. Second, this study performed the clustering as a secondary modeling step. Mixture IRT models do exist, but they have limitations in terms of computation time and convergence problems and are not effective for small sample sizes (Finch & French, 2012). As the model was already complex, with more than 1,400 individual, item, and population parameters being estimated using a small, very sparse sample, adding in the mixture components would have exponentially increased the number of parameters to be estimated and convergence of such a model would have been very unlikely.
The current methodology is cross-sectional in nature, which means the model would need to be refit to obtain updated estimates of the parameters when new information is collected. However, one advantage of the Bayesian hierarchical MCMC sampling scheme is the richness of information provided in the parameter posterior distributions obtained from the MCMC samples. This article demonstrated how additional personalized assessments can be derived from the MCMC samples. In addition, this model can also be used to predict milestones that were not observed, by probabilistically imputing the estimates for these unobserved values based on the current population and individual parameter estimates.
Previous literature has advised that consideration should be taken in the choice of prior distribution when using Bayesian estimation for small sample sizes, as this can result in biased estimates when the prior is incorrectly specified (McNeish, 2016; Smid, McNeish, Miočević, & van de Schoot, 2020). This issue was adressed by using Bayesian hierarchical priors for the multivariate ability estimates and the discrimination parameter of the milestones. When using a Bayesian hierarchical prior, the hyperparameters of the first-level parameters (e.g., the children’s abilities and the discrimination of the milestones) are not specified directly but are given prior distributions (König et al., 2020). This means that only the prior distributions for the hyperparameters are required to be specified, which alleviates the problem of having to specify informative priors when using a nonhierarchical model (König et al., 2020). Sheng (2012, p. 28) states that “hierarchical priors offer flexibility to specify weakly informative priors on the hyperparameters” and that using hierarchical priors allows for a more objective approach. Natesan et al. (2016) also recommends the use of a hierarchical prior over informative priors for small sample sizes. Small samples and sparse data are often unavoidable in clinical settings, such as the application in this article, and this research has demonstrated additional support for the use of Bayesian hierarchical priors in situations where the sample is small and the data are sparse.
In summary, this research demonstrates a new approach to create personalized developmental profiles for children through the use of Bayesian hierarchical MIRT modeling. The use of the Bayesian hierarchical modeling framework overcame estimation problems that often occur when using small, sparse samples. In addition, this framework allowed for probabilistic statements to be made regarding both the milestone parameters and the children’s abilities so that personalized and detailed information regarding each child’s development could be provided. Through incorporating this information from the IRT modeling with the results of the clustering, detailed developmental profiles were able to be constructed. The developmental profiles produced from this research can be used to assist with identification and personalized early intervention for children who are showing signs of developmental delay. These developmental profiles complement developmental surveillance tools by offering personalized feedback on the developmental progress of a child, so that parental concerns can be addressed as soon as a delay is recognized.
Supplemental Material
sj-pdf-1-epm-10.1177_0013164420987582 – Supplemental material for Bayesian Hierarchical Multidimensional Item Response Modeling of Small Sample, Sparse Data for Personalized Developmental Surveillance
Supplemental material, sj-pdf-1-epm-10.1177_0013164420987582 for Bayesian Hierarchical Multidimensional Item Response Modeling of Small Sample, Sparse Data for Personalized Developmental Surveillance by Patricia Gilholm, Kerrie Mengersen and Helen Thompson in Educational and Psychological Measurement
Supplemental Material
sj-pdf-2-epm-10.1177_0013164420987582 – Supplemental material for Bayesian Hierarchical Multidimensional Item Response Modeling of Small Sample, Sparse Data for Personalized Developmental Surveillance
Supplemental material, sj-pdf-2-epm-10.1177_0013164420987582 for Bayesian Hierarchical Multidimensional Item Response Modeling of Small Sample, Sparse Data for Personalized Developmental Surveillance by Patricia Gilholm, Kerrie Mengersen and Helen Thompson in Educational and Psychological Measurement
Supplemental Material
sj-pdf-3-epm-10.1177_0013164420987582 – Supplemental material for Bayesian Hierarchical Multidimensional Item Response Modeling of Small Sample, Sparse Data for Personalized Developmental Surveillance
Supplemental material, sj-pdf-3-epm-10.1177_0013164420987582 for Bayesian Hierarchical Multidimensional Item Response Modeling of Small Sample, Sparse Data for Personalized Developmental Surveillance by Patricia Gilholm, Kerrie Mengersen and Helen Thompson in Educational and Psychological Measurement
Supplemental Material
sj-pdf-4-epm-10.1177_0013164420987582 – Supplemental material for Bayesian Hierarchical Multidimensional Item Response Modeling of Small Sample, Sparse Data for Personalized Developmental Surveillance
Supplemental material, sj-pdf-4-epm-10.1177_0013164420987582 for Bayesian Hierarchical Multidimensional Item Response Modeling of Small Sample, Sparse Data for Personalized Developmental Surveillance by Patricia Gilholm, Kerrie Mengersen and Helen Thompson in Educational and Psychological Measurement
Supplemental Material
sj-pdf-5-epm-10.1177_0013164420987582 – Supplemental material for Bayesian Hierarchical Multidimensional Item Response Modeling of Small Sample, Sparse Data for Personalized Developmental Surveillance
Supplemental material, sj-pdf-5-epm-10.1177_0013164420987582 for Bayesian Hierarchical Multidimensional Item Response Modeling of Small Sample, Sparse Data for Personalized Developmental Surveillance by Patricia Gilholm, Kerrie Mengersen and Helen Thompson in Educational and Psychological Measurement
Footnotes
Acknowledgements
The data used in this article were generously provided by The Developing Foundation.
Declaration of Conflicting Interests
The authors declared no potential conflicts of interest with respect to the research, authorship, and/or publication of this article.
Funding
The author(s) disclosed receipt of the following financial support for the research, authorship, and/or publication of this article: This research is jointly supported by a Queensland University of Technology (QUT) Postgraduate Research Award and an Australian Technology Network Industry Doctoral Training Centre Scholarship co-funded by QUT and The Developing Foundation.
Supplemental Material
Supplemental material for this article is available online.
References
Supplementary Material
Please find the following supplemental material available below.
For Open Access articles published under a Creative Commons License, all supplemental material carries the same license as the article it is associated with.
For non-Open Access articles published, all supplemental material carries a non-exclusive license, and permission requests for re-use of supplemental material or any part of supplemental material shall be sent directly to the copyright owner as specified in the copyright notice associated with the article.