
Abstract
Composite reliability, or coefficient omega, can be estimated using structural equation modeling. Composite reliability is usually estimated under the basic independent clusters model of confirmatory factor analysis (ICM-CFA). However, due to the existence of cross-loadings, the model fit of the exploratory structural equation model (ESEM) is often found to be substantially better than that of ICM-CFA. The present study first illustrated the method used to estimate composite reliability under ESEM and then compared the difference between ESEM and ICM-CFA in terms of composite reliability estimation under various indicators per factor, target factor loadings, cross-loadings, and sample sizes. The results showed no apparent difference in using ESEM or ICM-CFA for estimating composite reliability, and the rotation type did not affect the composite reliability estimates generated by ESEM. An empirical example was given as further proof of the results of the simulation studies. Based on the present study, we suggest that if the model fit of ESEM (regardless of the utilized rotation criteria) is acceptable but that of ICM-CFA is not, the composite reliability estimates based on the above two models should be similar. If the target factor loadings are relatively small, researchers should increase the number of indicators per factor or increase the sample size.
Under classical testing theory, the reliability coefficient was defined as the ratio of the true variance to the observed variance, and it is independent of the underlying dimensionality of the composite score (Lord & Novick, 1968; McDonald, 1985; Raykov & Shrout, 2002). Because the true variance is typically unknown, reliability is most frequently estimated by computing Cronbach’s coefficient alpha (Hogan et al., 2000). Coefficient alpha is equal to the reliability coefficient when (a) the measurement errors are uncorrelated and (b) the test is essentially tau equivalent. Essential tau equivalence assumes that each item measures the same latent variable on the same scale but with different precision rates (see Graham, 2006; Raykov, 1997). However, the above two assumptions are often violated in applied research, especially the second assumption. If assumption (b) is violated, coefficient alpha tends to underestimate reliability (Green & Yang, 2009; Novick & Lewis, 1967; Sijtsma, 2009; Zinbarg et al., 2005). On the other hand, the coefficient usually overestimates reliability if assumption (a) is violated (Zimmerman et al., 1993) but might also underestimate reliability (Zimmerman et al., 1993). We cannot stress enough that coefficient alpha is still valuable for applied research since it is easy to calculate and is a lower bound of reliability when the obtained measurement errors are not correlated (Raykov & Marcoulides, 2019). Nonetheless, it is safe to say that coefficient alpha is not an accurate estimator of reliability, especially under the condition of correlated errors. The comparison of the coefficient alpha and the population reliability under the conditions of the present experiment can be retrieved in the Supplemental Material (available online).
Alternatively, researchers have proposed a model-based approach to estimate the reliability of the composite score (e.g., Bentler, 2009; Raykov, 1998, 2002). This approach does not require the assumptions of essential tau equivalency and uncorrelated errors (Yang & Green, 2010); instead, it is based on an appropriately constrained covariance structure model that accounts for the possibility of multiple sources of latent variability (Raykov & Shrout, 2002). The model uses a specific parameterization to estimate the true and observed composite variances, the two fundamental elements of the scale reliability coefficient. The ratio of the true and observed variance furnishes an estimate of the composite score reliability. Thus, the estimation of the reliability coefficient under classical testing theory is realized. This ratio is the coefficient omega. As stated by McDonald (1985), the coefficient omega “captures the notion of the reliability of a test score” (p. 90). In this article, we use composite reliability to represent the coefficient omega.
The independent clusters model of confirmatory factor analysis (ICM-CFA) is commonly used to estimate composite reliability. It typically assumes the latent variables have concise factor structures without cross-factor loadings. A serious defect of this modeling approach is that ICM-CFA tends to be overly restrictive and often fails to provide a satisfactory model fit (e.g., Marsh, 2007; Morin et al., 2013); therefore, it causes biased reliability estimations (Yang & Green, 2010). An alternative is the exploratory structural equation modeling (ESEM) proposed by Asparouhov and Muthén (2009). ESEM is much more flexible than ICM-CFA in accommodating cross-loading specifications and is likely to produce a better model fit. ESEM is frequently selected as the best-suited measurement model (e.g., Marsh et al., 2009; Marsh et al., 2010; Tóth-Király et al., 2018), yet few studies have estimated reliability based on ESEM. Moreover, few studies have compared the performances of ICM-CFA and ESEM in terms of composite reliability estimation. The present study is among the first to provide a comprehensive comparison between ICM-CFA and ESEM approaches concerning reliability estimation based on simulated data.
Similar to the exploratory factor analysis (EFA) model, ESEM can perform factor rotation, which might be considered a severe disadvantage since the patterns of factor loadings and the sizes of estimated factor correlations vary with specific rotations (Marsh et al., 2014). Additionally, EFA gives researchers little control if they have a priori models in mind. Marsh et al. (2013) argued that this problem is circumvented, at least to some extent, by target rotation in ESEM. Target rotation allows researchers to set the factor model in advance, for example, the factor number and item’s target factor, as in ICM-CFA. The difference between ICM-CFA and target rotation in ESEM is that target rotation does not need nontarget factor loadings (or cross-factor loadings) to be fixed to zero. The cross-factor loadings are made to be as close to zero as possible, but they are not constrained to zero (Asparouhov & Muthén, 2009; Marsh et al., 2013). Target rotation gives researchers greater control in specifying the model and facilitates the interpretation of the obtained results (Marsh et al., 2014).
Nevertheless, there are various rotation methods in ESEM in addition to target rotation. In particular, what if there is no a priori model to specify? Geomin rotation might be the answer. Geomin rotation in ESEM is similar to EFA in that it gives only the number of factors but no a priori information regarding the factor structure of the model. However, how can we choose between geomin rotation and target rotation? Since factor rotations are independent of goodness of fit, different kinds of factor rotations result in the same model fit index. Therefore, the goodness-of-fit indices provide no evidence for choosing the best rotation (Marsh et al., 2014; Sass & Schmitt, 2010; Schmitt & Sass, 2011). A simulation study showed that geomin rotation is the most promising rotation criterion when little is known about the true loading structure or when the factor structure is rather simple (Asparouhov & Muthén, 2009; Marsh et al., 2014). However, suppose the factor structure is rather complicated (i.e., the loading matrix structures involve three or more factors and each variable has three or more nonzero loadings). In that case, the target rotation criterion leads to better results (Asparouhov & Muthén, 2009). Therefore, the present study also discusses the performance of target rotation when geomin rotation is not accurate for reliability estimation.
Reliability Estimation Based on Exploratory Structural Equation Model
A hidden assumption when using ESEM as a measurement model is multidimensionality. As long as there is only one factor, the measurement model of ESEM is the same as that of ICM-CFA due to the absence of cross-loadings. Assume there are p items
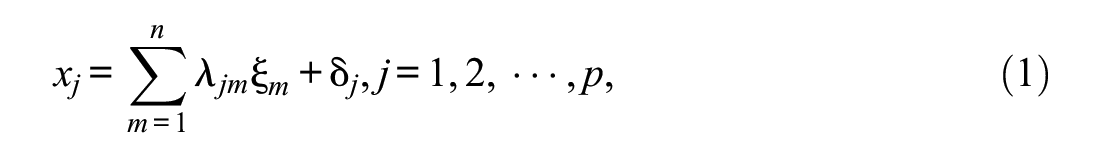
where

If cross-factor loadings exist, then the measurement equations are the same as in Equation 1, but there is no constraint on
Here, we illustrate the estimation of composite reliability based on ESEM using a simulated data set. To this end, multinormal data were generated for N = 1,000 cases of p = 6 items,

where the two latent constructs

Thus, the values of

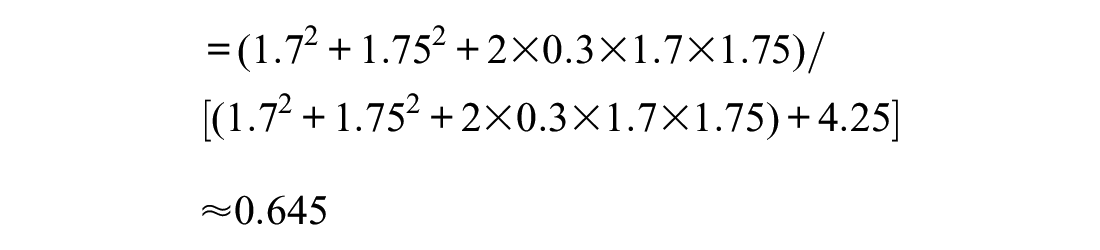
If ESEM adopts geomin rotation, we are able to estimate the composite reliability in Mplus (see the appendix). We estimated the composite reliability on the simulated data set, and the outcome was close to the population value. For target rotation, the composite reliability can be computed manually based on the Mplus output parameters.
Design of Simulation 1
A Monte Carlo simulation was used to compare composite reliability estimations based on ICM-CFA and ESEM with geomin rotation (ESEM_Geo). The population model contained two factors (
The simulation experiment had a 2 × 3 × 3 × 3 factorial design with four design conditions. The four design conditions were fully crossed, creating 54 (= 2 × 3 × 3 × 3) unique cell conditions. Within each of the 54 unique cell conditions, two models were fitted to each simulated sample data set: ICM-CFA model and ESEM model based on geomin rotation. The details of these design conditions and their levels are described as follows:
Number of items per factor (NI). The number of items with the same target factor was either three or six. Therefore, the number of cross-loadings per factor was either two or four.
The value of the item loadings on the target factor (Lt). The target factor loadings were set to be above the threshold value of 0.3. The standardized values of the target factor loadings were 0.4, 0.6, and 0.8, representing low, medium, and high target factor loadings, respectively.
The value of the cross-factor loadings (Lc). One of the advantages of ESEM is that small cross-loadings do not need to be eliminated from the model (Muthén & Asparouhov, 2012). In the present study, the standardized values of the cross-loadings were 0.01, 0.1, and 0.25.
The simulated sample size (N) conditions were 100, 300, and 500. We used 100 as the minimum sample size following the suggestion by Boomsma (1982) for latent variable models.
Within each unique design condition, 500 sample data sets were generated based on a set of specified population parameters. Each simulated sample data set was fitted into two models: ICM-CFA and ESEM_Geo. We used geomin rotation but not target rotation in the comparison because the Mplus software could estimate the composite reliability directly based on geomin rotation. If the performance of ESEM_Geo was not good, we compared the composite reliability estimations of ICM-CFA and ESEM based on target rotation. When using target rotation, researchers should manually compute the composite reliability based on the Mplus output.
For each unique combination of the four design conditions (1-4 as previously outlined), Mplus 8.3 was used to generate 500 sample data sets under the population model. For each sample data set generated under the population model, both ICM-CFA and ESEM_Geo were fitted to the sample data. The R program (R 3.5.1) was used to extract the results provided by the Mplus output files.
Results of Simulation 1
The estimation of composite reliability was based on the chosen model parameters. Therefore, we needed the model to converge with proper solutions (e.g., no estimated variance term could be negative) and to fit the data properly. In the present study, three criteria were employed for comparison purposes: the rate of model convergence with proper solutions, the goodness of fit, and the relative bias of the composite reliability estimates.
Fully Proper Solutions
First, we evaluated the proportion of fully proper solutions for each cell of the design (the estimation procedure converged to a proper solution such that no estimated variance term and no SE of a parameter were negative). The fully proper solution rate (% proper) was calculated as the number of convergent replications having proper solutions divided by the total number of replications. Only the fully proper solutions were considered in evaluating the goodness of fit and reliability estimates.
The results showed that the fully proper solutions of ICM-CFA were generally higher than those of ESEM_Geo as depicted in Table 1. If the target factor loading was low (Lt = 0.4) and the cross-loading was high (Lc = 0.25), the fully proper solutions of both models were somewhat low. For example, when NI = 3, Lt = 0.4, Lc = 0.25, and N = 500, the fully proper solution rate of ICM-CFA was 0.894 and that of ESEM_Geo was only 0.648.
Simulation 1: Convergence-With-Proper-Solution and Acceptable Fit Rate and Goodness of Fit.

Note. NI = number of items per factor; N = sample size; Lt = target factor loadings; Lc = cross-factor loadings; ESEM_Geo = exploratory structural equation model with geomin rotation; ICM-CFA = independent clusters model of confirmatory factor analysis; CFI = comparative fit index; TLI = Tucker–Lewis index; RMSEA = root mean square error of approximation.
Furthermore, the fully proper solutions of both models increased as the sample size increased. If the sample size was small (N = 100), the fully proper solutions of both models were rather low, with a small number of items (NI = 3) and a low target factor loading (Lt = 0.4). For example, when NI = 3, Lt = 0.4, Lc = 0.01, and N = 100, the fully proper solution rate of ICM-CFA was 0.544 and that of ESEM_Geo was 0.448.
Goodness of Fit
The indices for goodness of fit used in the present study included widely used model fit indices, such as the comparative fit index (CFI), Tucker–Lewis index (TLI), and root mean square error of approximation (RMSEA). Following the decision rules of Hu and Bentler (1999) and Marsh et al. (2004), model fitness was considered acceptable when CFI > 0.9, TLI > 0.9, and RMSEA < 0.08 and good when CFI > 0.95, TLI > 0.95, and RMSEA < 0.06. Furthermore, we used the above indices to compare the performances of two models under the same design conditions, since ICM-CFA was nested within ESEM_Geo.
As depicted in Table 1, ESEM_Geo performed better than ICM-CFA in terms of model fit. More specifically, ESEM_Geo fitted the data well in all conditions, with the CFI and TLI being greater than 0.95 and the RMSEA being lower than 0.04. In contrast, the model fit of ICM-CFA was mostly acceptable. If the target factor loading and cross-loading were high (e.g., Lt = 0.8 and Lc = 0.25), the RMSEA of ICM-CFA was usually larger than 0.08.
It is worth noting that the model fits of ICM-CFA and ESEM were noticeably different, even though the mean values of the model fitness indices appeared to be very similar. “Acceptable fit” in Table 1 was calculated by the number of the model fitness values that reached the standards of CFI > 0.9, TLI > 0.9, and RMSEA < 0.08 divided by 500. We calculated the composite reliability as long as the model converged to a proper solution, regardless of model fitness. The numbers of models that reached the level of acceptable fit were substantially different between the two model types. For example, when NI = 3, N = 100, Lt = 0.8, and Lc = 0.25, the proportion of models that reached acceptable fit for ICM-CFA was 0.130 while that of ESEM was 0.822.
Relative Bias of the Composite Reliability Estimates
The relative bias of each estimation was calculated by subtracting the true value from the average of estimates and then dividing the result by the true value:

where
Table 2 reports the relative biases of the composite reliability estimates based on the two models and their mean differences when cross-loadings existed. In general, the relative biases of the composite reliability estimates were less than 5% under most conditions, especially when the target factor loading was rather high (e.g., Lt = 0.6 or 0.8). However, when the target factor loading and cross-loading were low (Lt = 0.4 and Lc = 0.01) and the sample size was small (N = 100), the relative biases of the composite reliability estimates based on both models were positive, indicating overestimation.
Simulation 1: Relative Bias of Composite Reliability and Mean Differences Between Two Models.
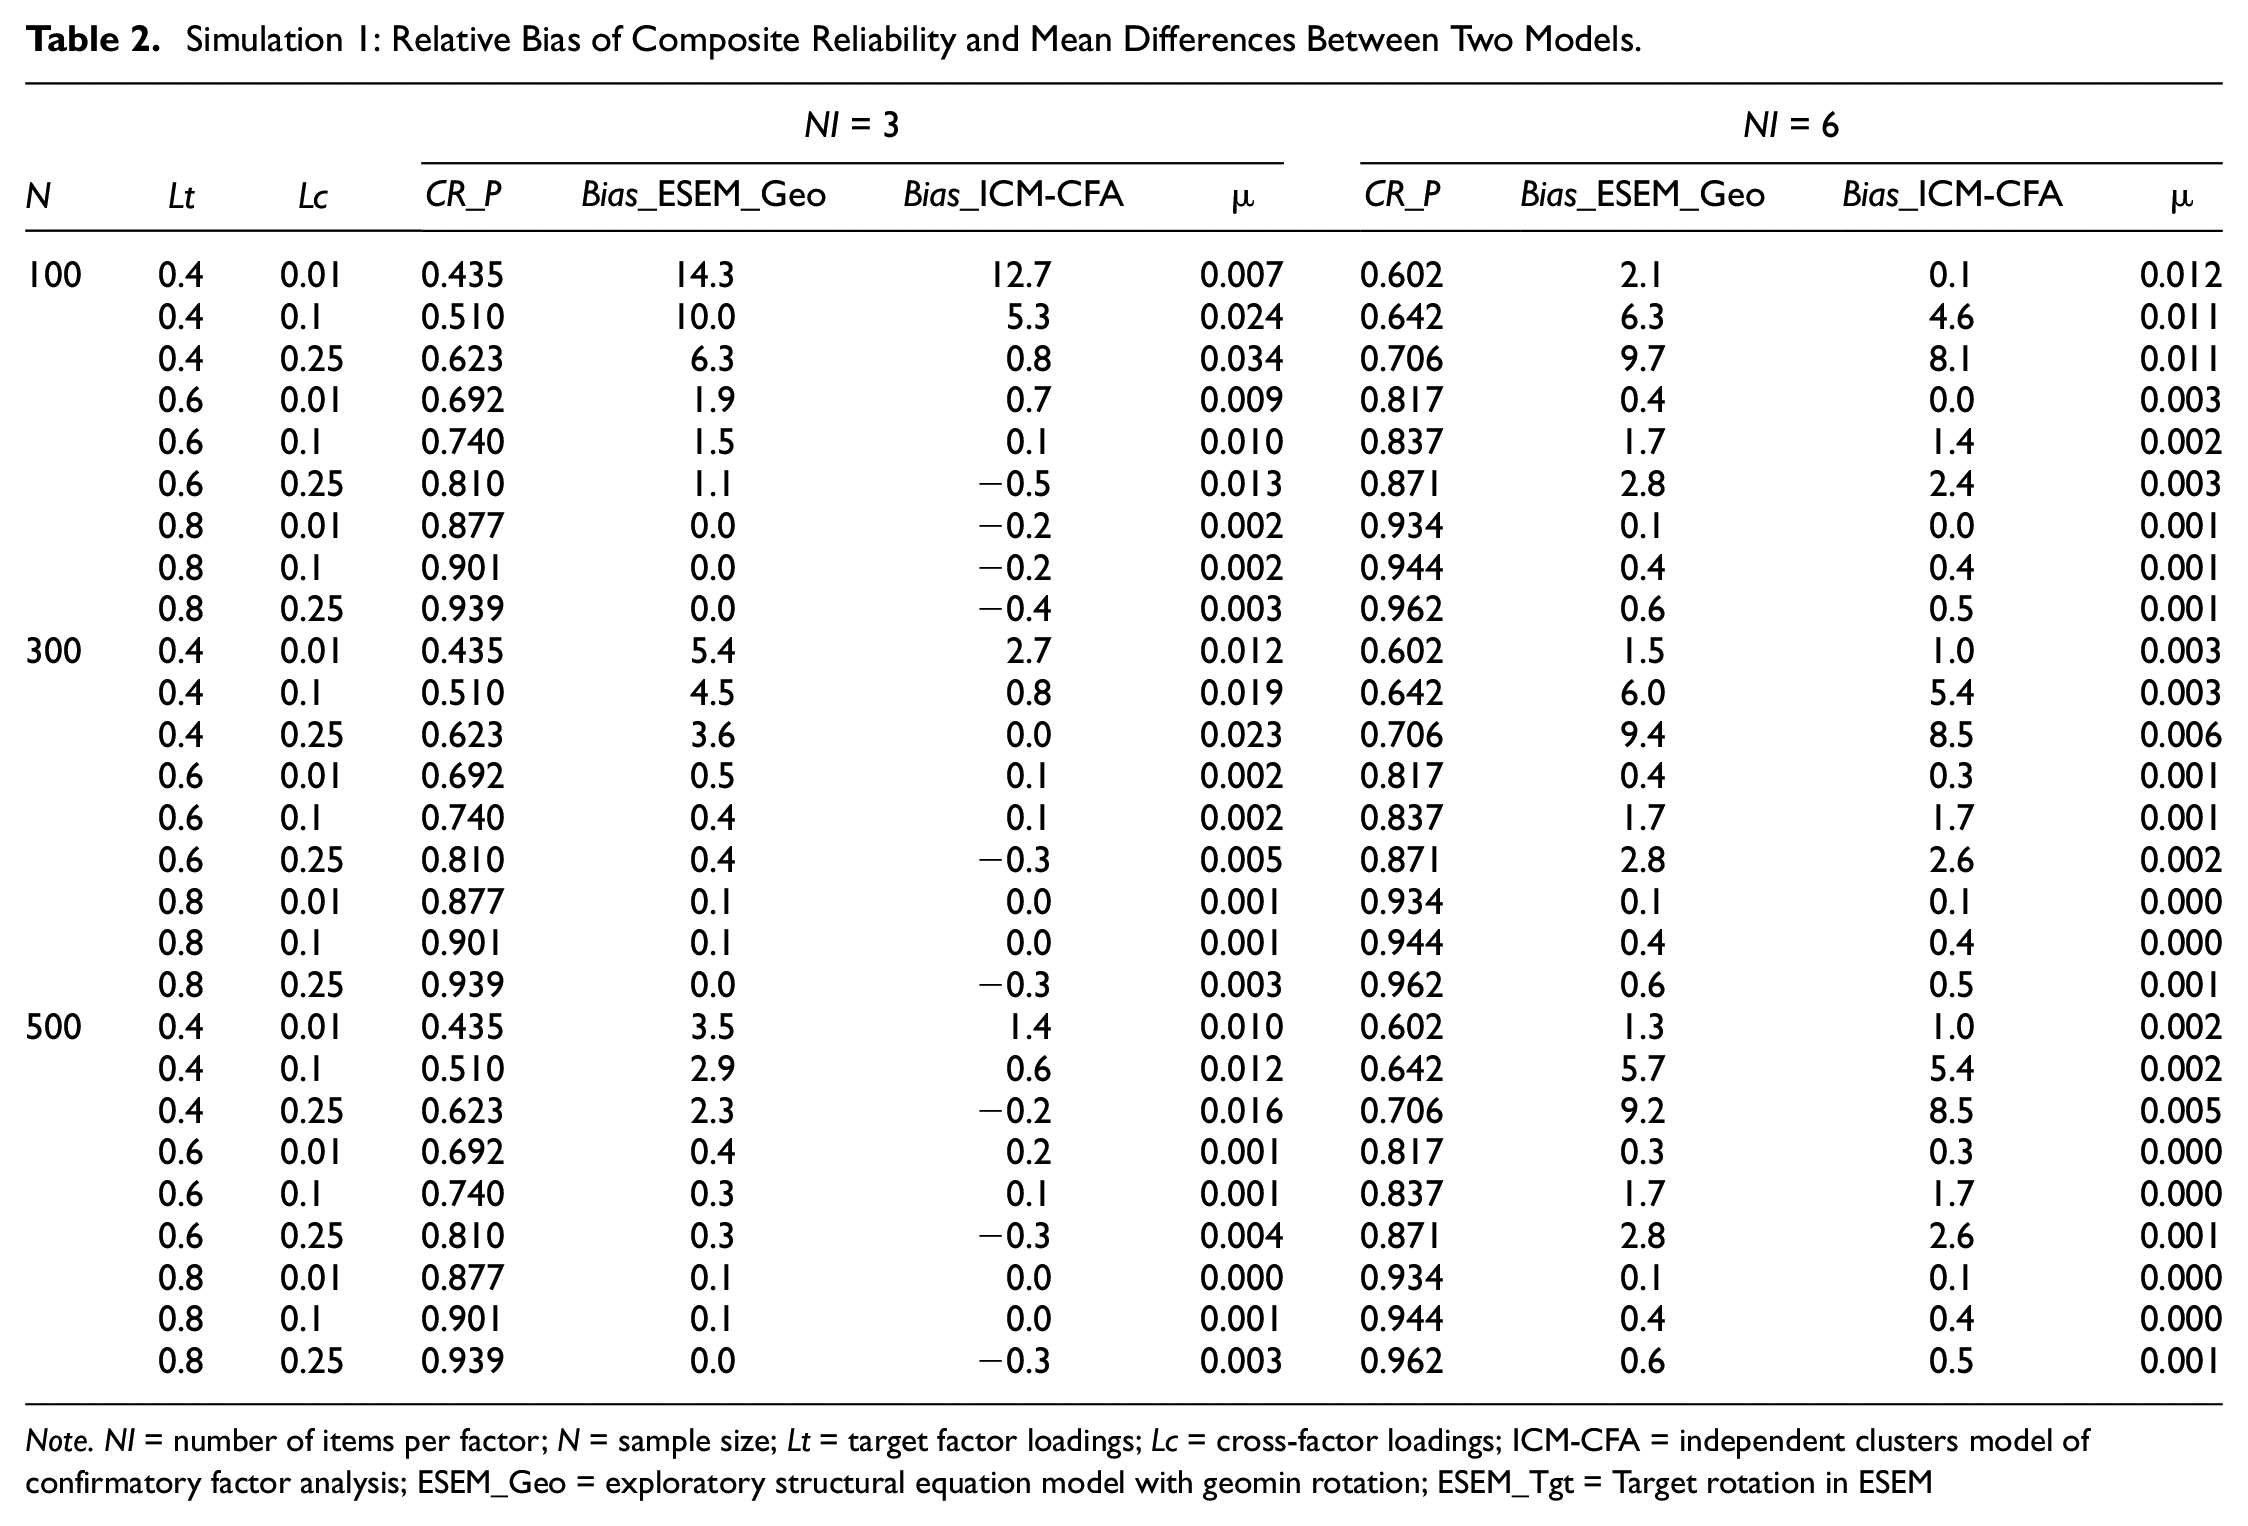
Note. NI = number of items per factor; N = sample size; Lt = target factor loadings; Lc = cross-factor loadings; ICM-CFA = independent clusters model of confirmatory factor analysis; ESEM_Geo = exploratory structural equation model with geomin rotation; ESEM_Tgt = Target rotation in ESEM
Under the same conditions, the mean differences in composite reliability (see
Standard Error and Mean Square Error
The SE was calculated by
The Standard Errors (×10,000) and Mean Square Errors (×10,000) of Stimulation Study 1.
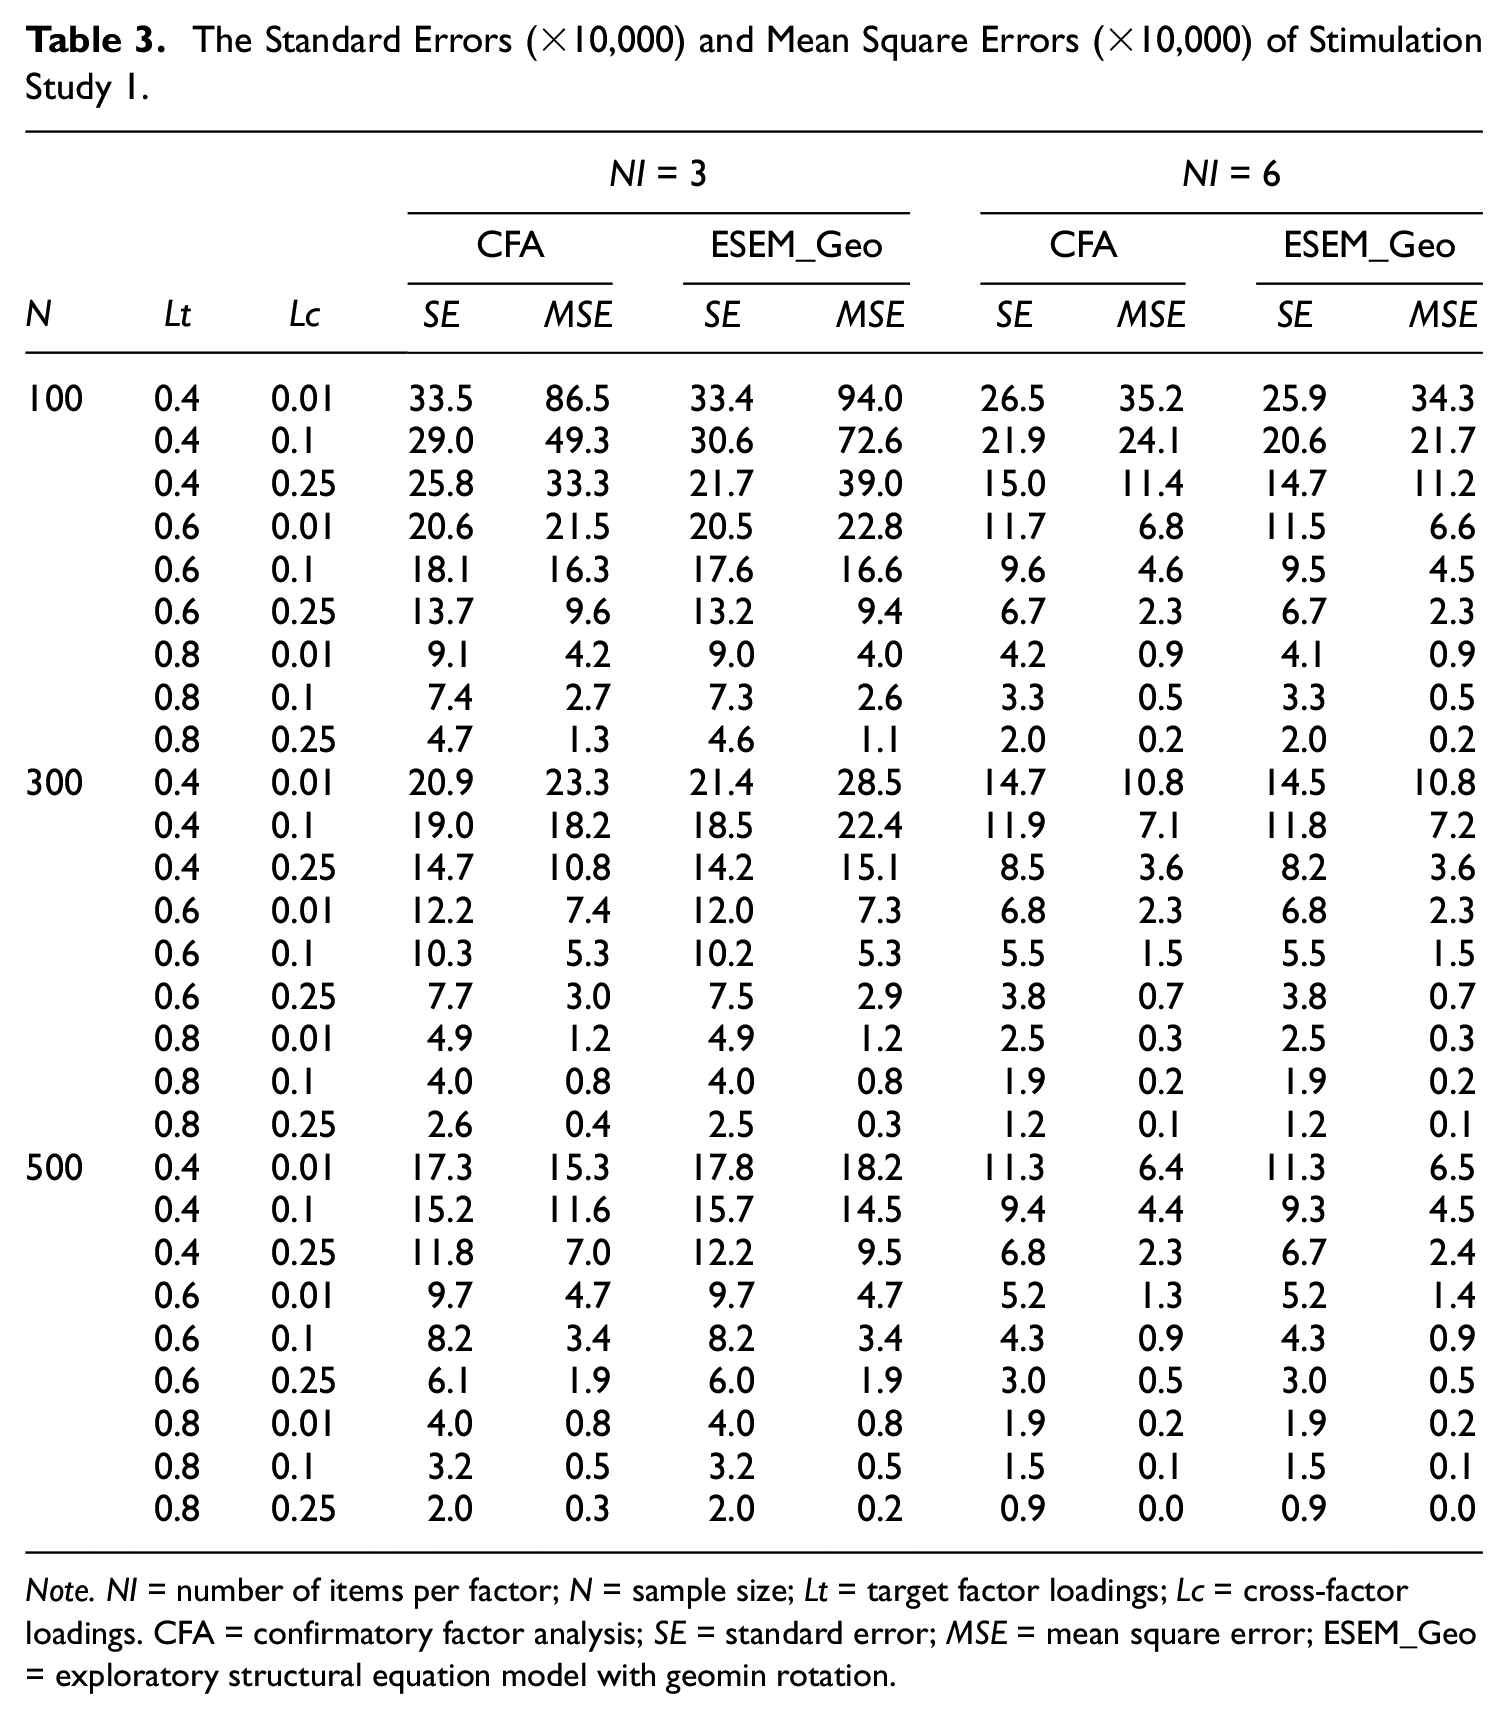
Note. NI = number of items per factor; N = sample size; Lt = target factor loadings; Lc = cross-factor loadings. CFA = confirmatory factor analysis; SE = standard error; MSE = mean square error; ESEM_Geo = exploratory structural equation model with geomin rotation.
Design of Simulation 2
The results of Simulation 1 showed that the performance of composite reliability estimation based on ESEM_Geo was unsatisfactory when the target factor loading was low (e.g., Lt = 0.4) and the sample size was small (e.g., N = 100, 300). To be precise, both ICM-CFA and ESEM_Geo tend to overestimate reliability under the above conditions. Target rotation in ESEM (ESEM_Tgt) provides a more robust a priori model, gives the researcher greater control in specifying the model, and facilitates the interpretation of the results (Marsh et al., 2014). Moreover, different rotation methods lead to different factor loading matrices and factor correlation matrices (e.g., Asparouhov & Muthén, 2009; Schmitt & Sass, 2011), which are critical elements for estimating composite reliability. Simulation 2 investigated whether the estimation of composite reliability based on ESEM_Tgt would be more precise than that based on ESEM_Geo with a low target factor loading (e.g., Lt = 0.4) and a small sample size (e.g., N = 100, 300).
Simulation 2 was a follow-up study of Simulation 1, so their designs and conditions were similar. Suppose the population model contained two factors (
The simulation experiment had a 2 × 3 × 2 factorial design with three design conditions. The three design conditions were fully crossed, creating 12 (2 × 3 × 2 = 12) unique cell conditions. Within each of the 12 unique cell conditions, two models were fitted to each simulated sample data set: ESEM_Geo and ESEM_Tgt. The details of these design conditions and their levels are described below.
Number of items per factor (NI). The number of items with the same target factor was either 3 or 6.
The value of the cross-factor loadings (Lc). The standardized values of the cross-loadings were 0.01, 0.1, and 0.25.
The simulated sample size (N) conditions were 100 and 300.
Within each unique design condition, 500 sample data sets were generated based on a set of specified population parameters. Each simulated sample data set was fitted by different rotations in ESEM: ESEM_Geo and ESEM_Tgt. As in Simulation 1, Mplus 8.3 and the R program (R 3.5.1) were used for data generation and analysis.
Results of Simulation 2
Fully Proper Solutions and Goodness of Fit
For the convenience of comparison, we show ESEM_Geo portion of the results from Simulation 1 in Tables 4 and 5. As depicted in Table 4, the fully proper solutions of ESEM_Tgt were slightly lower than those of ESEM_Geo. As expected, the goodness-of-fit indices were almost the same for the geomin and target rotations. In other words, the different rotations fit the data equally well.
Simulation 2: Convergence-With-Proper-Solution Rate and Goodness of Fit.
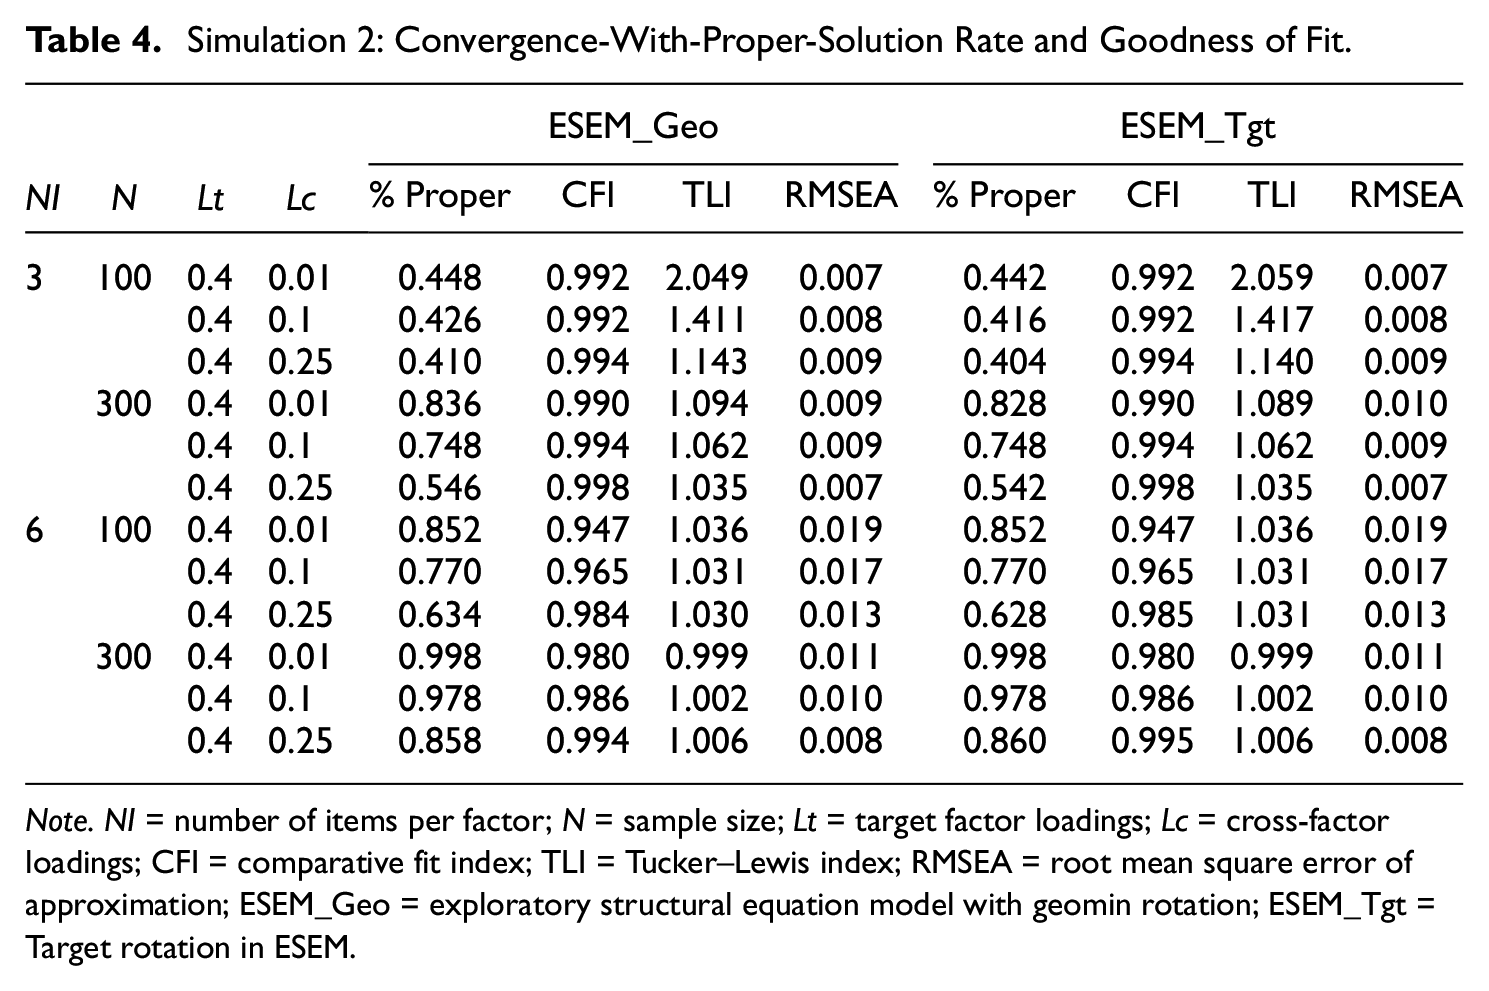
Note. NI = number of items per factor; N = sample size; Lt = target factor loadings; Lc = cross-factor loadings; CFI = comparative fit index; TLI = Tucker–Lewis index; RMSEA = root mean square error of approximation; ESEM_Geo = exploratory structural equation model with geomin rotation; ESEM_Tgt = Target rotation in ESEM.
Simulation 2: Relative Bias of Composite Reliability, Standard Error (×10,000) and Mean Square Error (×10,000) Based on ESEM_Geo and ESEM_Tgt.
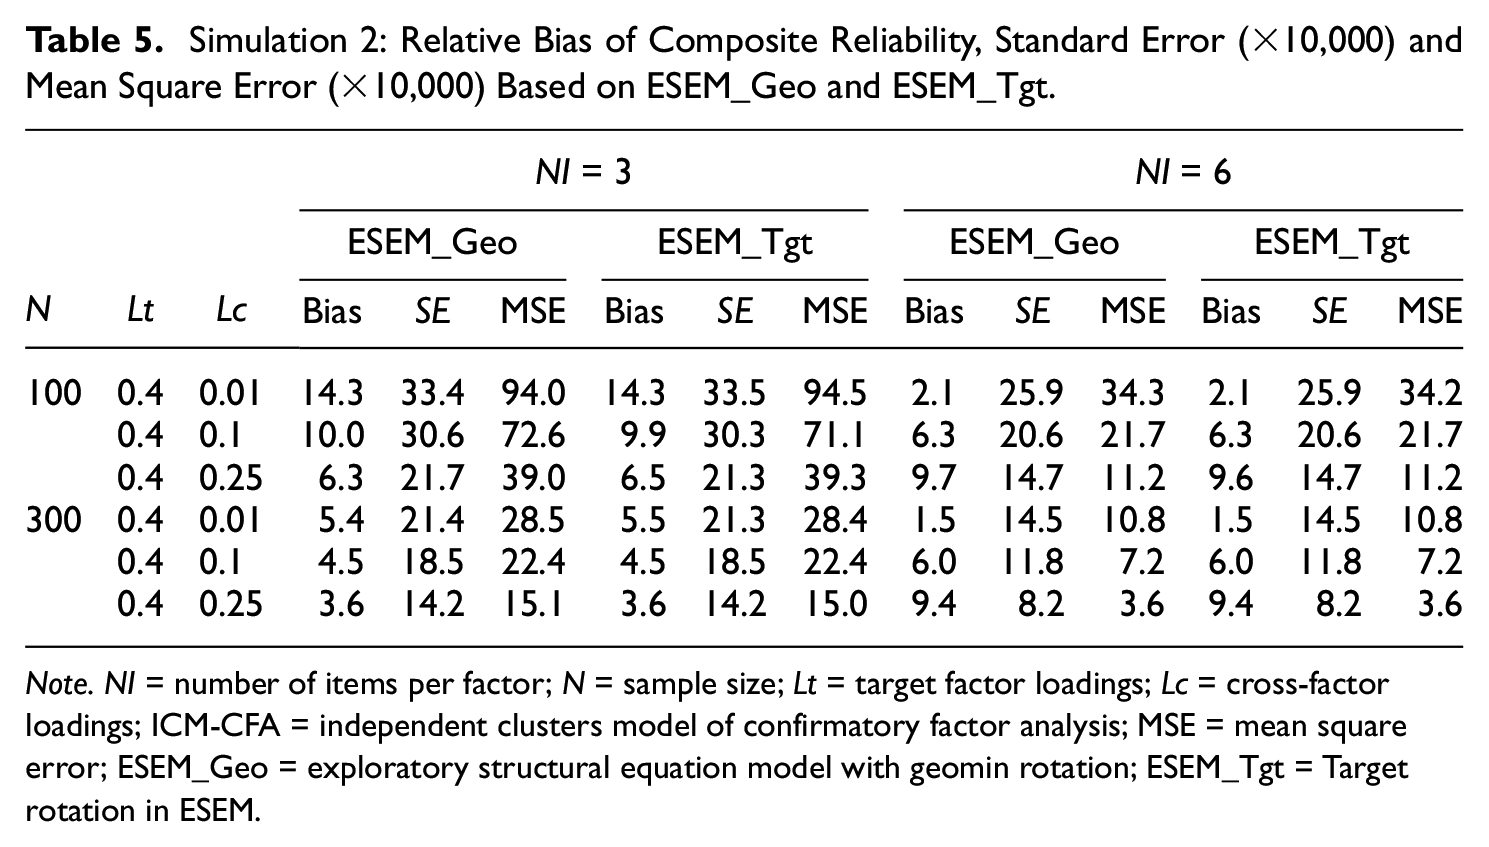
Note. NI = number of items per factor; N = sample size; Lt = target factor loadings; Lc = cross-factor loadings; ICM-CFA = independent clusters model of confirmatory factor analysis; MSE = mean square error; ESEM_Geo = exploratory structural equation model with geomin rotation; ESEM_Tgt = Target rotation in ESEM.
Relative Bias of the Composite Reliability Estimates, Standard Error, and Mean Square Error
The patterns of the relative biases of the composite reliability estimates, the SE and the MSE were similar between different rotation methods under all research conditions, as shown in Table 5. When the target factor loadings were low and sample sizes were small, compared with geomin rotation, target rotation neither improved nor deteriorated the precision of the composite reliability estimates.
An Empirical Example
An example is analyzed to illustrate the difference between ICM-CFA and ESEM regarding model fit and composite reliability estimation. The example concerns a child-rated measurement regarding their parents’ psychological control (Wang et al., 2007). The Parents’ Psychological Control Scale has three dimensions: (1) guilt induction (10 items, e.g., “My parents tell me that I should feel guilty when I do not meet their expectations”); (2) love withdrawal (five items, e.g., “My parents act cold and unfriendly if I do something they do not like”); and (3) authority assertion (three items, e.g., “My parents tell me that what they want me to do is the best for me and I should not question it.’”). The above 18 items were rated between 1 (not at all true) and 5 (very true). A total of 2,084 children (including 1,015 boys, 1,018 girls, and 51 unidentified by gender) were asked to complete the questionnaire in a junior high school in China. We first fitted the data with both ICM-CFA and ESEM models and then calculated the composite reliability using the Mplus software (except for the composite reliability of ESEM_Tgt). The results are shown in Table 6.
The Model Fitness and Their Composite Reliability of The Example.
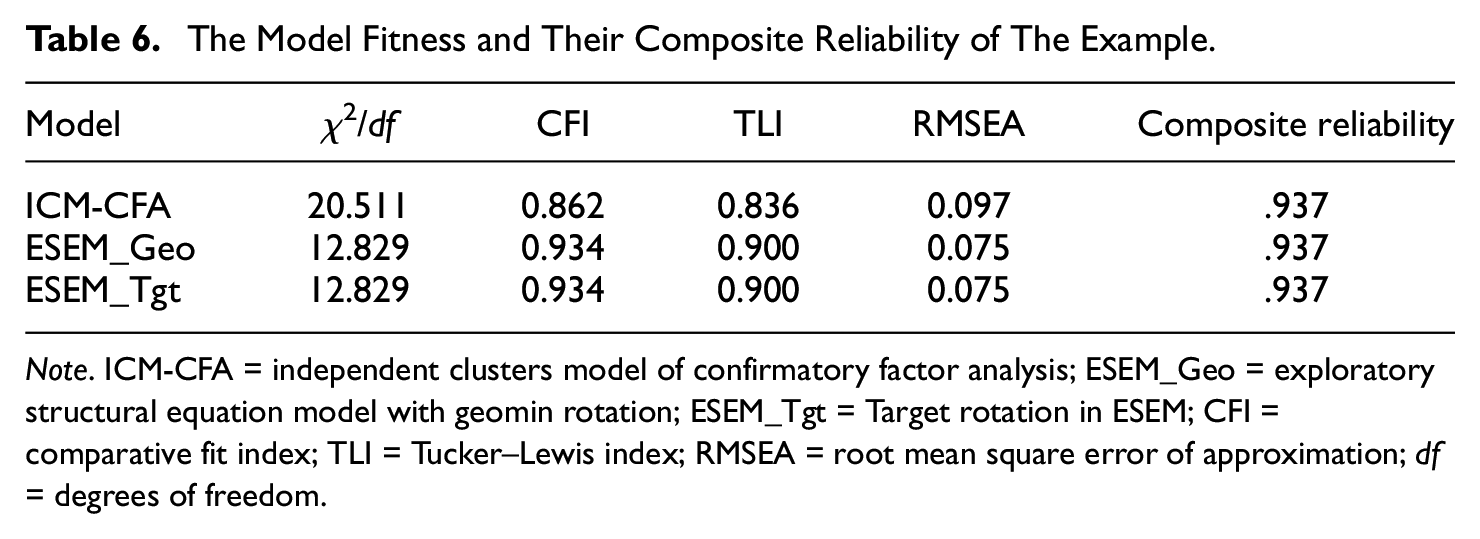
Note. ICM-CFA = independent clusters model of confirmatory factor analysis; ESEM_Geo = exploratory structural equation model with geomin rotation; ESEM_Tgt = Target rotation in ESEM; CFI = comparative fit index; TLI = Tucker–Lewis index; RMSEA = root mean square error of approximation; df = degrees of freedom.
ICM-CFA model did not fit the data well, as the CFI and TLI were below 0.9 but above 0.8, and the RMSEA was above 0.08. On the other hand, the model fit of ESEM reached an acceptable level, as the CFI and TLI were above 0.9, and the RMSEA was below 0.08. As expected, the rotation method did not affect the model fit for ESEM. Although the model fit of ICM-CFA and ESEM were different, the composite reliability estimates based on these two models were the same.
Discussion
ESEM has been widely used in applied research in recent years (e.g., Chen et al., 2018; Tóth-Király et al., 2017). The main goals of the present study are (a) to provide a clear estimation process for composite reliability based on ESEM and (b) to demonstrate the differences in the composite reliability estimations yielded by ESEM and ICM-CFA when cross-loadings exist. We achieved the first goal by providing applied researchers with the Mplus codes to estimate reliability under ESEM_Geo and the computation process for ESEM_Tgt at the beginning of this article.
Then, we compared ESEM_Geo and ICM-CFA with respect to composite reliability estimation in the first simulation study. The results showed that the differences were negligible, and this was beyond our expectations since cross-loadings were taken into account in ESEM but were not in ICM-CFA. One of the possible reasons for this is that SEM tended to explain the data variances maximally. For example, one simulation study showed that ICM-CFA often overestimates target factor loadings and factor correlations when cross-loadings exist in a population model (Xiao et al., 2019). These inflated target factor loadings and factor correlations might account for the variance of the cross-loadings; thus, the difference between the composite reliability estimations based on ESEM and ICM-CFA was very small.
Moreover, we found that under the conditions of low target factor loadings and cross-loadings (e.g., Lt≤ 0.4 and Lc≤ 0.01), a small number of indicators per factor (e.g., NI = 3), and small sample sizes (e.g., N = 100), ESEM_Geo and ICM-CFA tended to overestimate composite reliability. Increasing the sample size might be a solution to this problem. For instance, under the same conditions as mentioned above except for the use of a larger sample size (e.g., N≥ 300), the relative bias of the composite reliability estimate was acceptable. Low target factor loadings usually imply high measurement errors. Therefore, large sample size is needed to correct for measurement error.
Although the mean values of the models’ goodness-of-fit indices in this study all (except 4) reached acceptable levels, the model fits of ICM-CFA and ESEM were different. More of ICM-CFA-based models failed to reach acceptable level than ESEM-based models. To our surprise, model fitness did not affect the accuracy of the composite reliability estimation. The empirical example suggested the same conclusion. Hence, if the model fit of ESEM is acceptable but that of ICM-CFA is not, the difference in the composite reliability estimates obtained based on the two models is ignorable as long as the primary model structures are the same.
Target rotation is always considered an advantage of ESEM since it provides a priori model and gives the researcher control in specifying the model, therefore facilitating the interpretation of the results. However, Mplus does not provide composite reliability based on target rotation. The results of Simulation 2 showed no difference in the estimation of composite reliability between geomin rotation and target rotation in ESEM. In other words, both rotation methods lead to the same reliability estimation results, thereby demonstrating that the reliability estimation of ESEM is, to some extent, consistent.
In conclusion, we recommend that researchers first try to fit their data into an ICM-CFA model regarding composite reliability estimation. If the model fitness is not acceptable, ESEM_Geo should be used. These two methods allow researchers to estimate composite reliability directly with the Mplus software. When ESEM_Tgt is adopted, the composite reliability can be computed based on the output model parameters.
Supplemental Material
sj-pdf-1-epm-10.1177_00131644211008953 – Supplemental material for A Comparison of Reliability Estimation Based on Confirmatory Factor Analysis and Exploratory Structural Equation Models
Supplemental material, sj-pdf-1-epm-10.1177_00131644211008953 for A Comparison of Reliability Estimation Based on Confirmatory Factor Analysis and Exploratory Structural Equation Models by Yuanshu Fu, Zhonglin Wen and Yang Wang in Educational and Psychological Measurement
Footnotes
Appendix
Title: Calculate composite reliability under ESEM geomin rotation;
Data: File is S1_exp.dat;
Variable: Names are x1-x6;
Analysis: Rotation = geomin;
Model:
f1-f2 by x1-x6(*1);
f1 by x1-x6 *(la1-la6);
f2 by x1-x6 * (lb1-lb6);
x1-x6(v1-v6);
f1 WITH f2(cor);
Model constraint: NEW(C1 C2 CR);
c1 = la1 + la2 + la3 + la4 + la5 + la6;
c2 = lb1 + lb2 + lb3 + lb4 + lb5 + lb6;
CR = (c1**2 + c2**2 + 2*c1*c2*cor)/
(c1**2 + c2**2 + 2*c1*c2*cor + v1 + v2 + v3 + v4 + v5 + v6);
Note. This Mplus code was modified from Raykov and Marcoulides (2011, p. 173) where the authors provided the Mplus code for composite reliability estimation based on an independent clusters model of confirmatory factor analysis model. For EQS and LISREL input of reliability estimation based on a general structure (with cross-factor loadings), please refer to Raykov and Shrout (2002).
Declaration of Conflicting Interests
The author(s) declared no potential conflicts of interest with respect to the research, authorship, and/or publication of this article.
Funding
The author(s) disclosed receipt of the following financial support for the research, authorship, and/or publication of this article: This work was supported by grants from the National Natural Science Foundation of China [31771245].
Supplemental Material
Supplemental material for this article is available online.
References
Supplementary Material
Please find the following supplemental material available below.
For Open Access articles published under a Creative Commons License, all supplemental material carries the same license as the article it is associated with.
For non-Open Access articles published, all supplemental material carries a non-exclusive license, and permission requests for re-use of supplemental material or any part of supplemental material shall be sent directly to the copyright owner as specified in the copyright notice associated with the article.