
Abstract
In data collected from virtual learning environments (VLEs), item response theory (IRT) models can be used to guide the ongoing measurement of student ability. However, such applications of IRT rely on unbiased item parameter estimates associated with test items in the VLE. Without formal piloting of the items, one can expect a large amount of nonignorable missing data in the VLE log file data, and this is expected to negatively affect IRT item parameter estimation accuracy, which then negatively affects any future ability estimates utilized in the VLE. In the psychometric literature, methods for handling missing data have been studied mostly around conditions in which the data and the amount of missing data are not as large as those that come from VLEs. In this article, we introduce a semisupervised learning method to deal with a large proportion of missingness contained in VLE data from which one needs to obtain unbiased item parameter estimates. First, we explored the factors relating to the missing data. Then we implemented a semisupervised learning method under the two-parameter logistic IRT model to estimate the latent abilities of students. Last, we applied two adjustment methods designed to reduce bias in item parameter estimates. The proposed framework showed its potential for obtaining unbiased item parameter estimates that can then be fixed in the VLE in order to obtain ongoing ability estimates for operational purposes.
Introduction
Compared with physical learning environments such as classrooms, virtual learning environments (VLEs) refer to systems that deliver learning materials to students in the digital space (Weller, 2007). VLEs allow students to engage in self-paced learning and provide the opportunity to learn new skills without having to travel. Furthermore, teachers can orchestrate learning experiences (Prieto et al., 2011) with video lessons, practice questions, and discussion forums, using VLEs. In addition, educational researchers can utilize VLE data to address pressing questions in education, such as identifying factors that affect learning (Mining, 2012). VLEs have been used extensively around the world, and have had special importance to replace in-person instruction during school closures prompted by the 2020 COVID-19 pandemic (Dhawan, 2020).
A core aspect of conducting educational research with VLE data is the challenge of measuring abilities of students who are engaging with the platform (Means & Anderson, 2013) using psychometric methods (Andrich & Luo, 1993) such as item response theory (IRT; Lord & Novick, 1968). IRT models are commonly used to estimate the psychometric properties of tests administered to students through VLEs (Park et al., 2019).
Item response data in VLEs are obtained from system logs stored in a server (Romero et al., 2014; Sheard, 2011). These data may have large percentages of missing values for many reasons, such as recording errors and students choosing to skip items. Generally, there are four types of missing data: structurally missing (i.e., data are missing for a planned purpose), missing completely at random (MCAR; i.e., the probability of missingness is the same for all cases; Rubin, 1976), missing at random (MAR; i.e., the probability of missingness is the same only within groups defined by the observed data; Rubin, 1976), and missing not at random or nonignorable missing values (MNAR; Rubin, 1987).
Several studies have applied different kinds of imputation-based approaches to deal with data classified as MCAR or MAR (e.g., Bernaards & Sijtsma, 2000; Finch, 2008; Sijtsma & Van der Ark, 2003). However, MNAR data in item responses presents a more difficult analysis challenge because the missing data may be related to the trait of measurement, which is expected to result in biased parameter estimation if ignored (Finch, 2008). The current study demonstrates that missing item response data in Math Nation, a VLE used by over 500,000 students per year (Lastinger Center for Learning, 2020), are MNAR because student decisions to skip items were partially related to their underlying ability. It also presents and evaluates a method to obtain unbiased item parameter estimates when data are MNAR, using artificial neural networks (ANNs).
Researchers have proposed various model-based approaches to reduce the impacts of MNAR item response data. In the IRT model-based approaches, the tendency to skip items is often included in the models and accounted for in the estimation of item and person parameters (Pohl et al., 2014). One type of model-based approach, the latent approach, includes modeling the tendency to have missing data via a latent missing propensity trait in a multidimensional IRT model (Holman & Glas, 2005). Another type of model-based approach, the manifest approach, involves calculating observed variables that represent missing propensity and then including those variables in measurement models (Rose et al., 2010). Studies on model-based approaches evaluated their performance in assessment data analysis when the proportion of missing data were not very high, often well under 50% of the total data in the item response matrix (e.g., 30%; Rose et al., 2010). However, the data collected in VLEs frequently contain proportions of missingness exceeding 50% because students are often self-selecting whether and when to engage with items in the VLE. This self-selection not only results in sparse data, but it also increases the chance that the missing data in the VLE are related to a wide variety of unobserved cognitive factors (e.g., academic achievement, engagement, self-regulation). Such large amounts of MNAR data do not align with the conditions under which model-based approaches to handle missingness were developed or evaluated. Therefore, there is a need for improved methods to handle large proportions of item MNAR data from system logs of VLEs.
In the past decade, due to the development of computing technology, applications of machine learning to data analysis have increased rapidly (Embretson & Reise, 2013), and there is large potential for use with missing data problems (Fazakis et al., 2020). Machine learning, which is a type of artificial intelligence, allows computer systems to learn and complete tasks without being programmed explicitly for such tasks (Bishop, 2006). Machine learning algorithms have the capacity to analyze complex and high-dimensional data, and hence applying machine learning techniques to handling missing item data in VLEs is a possible mechanism for improving psychometric research in technology-enhanced educational environments (Means & Anderson, 2013; Mining, 2012).
As one subfield of machine learning, ANNs (Goodfellow et al., 2016) have been proposed as an attractive approach to convert a pattern of item responses into latent variables (Cui et al., 2016; Cui et al., 2017; Paulsen, 2019; Xue & Bradshaw, 2021). In the current project, semisupervised learning ANNs are introduced into the IRT research area. The proposed semisupervised learning ANNs architecture may provide an accurate estimation of item parameters when item data from VLEs is MNAR. In the following sections, we first provide a brief introduction to ANN. Then, we motivate the application of ANN to MNAR data by presenting an exploratory study of the item response data collected and its patterns of missingness within a statewide database from a VLE. Next, we describe the proposed semisupervised learning framework to estimate an unbiased latent trait using deep learning techniques. After that, we present the two adjustment methods for improving the accuracy of item parameter estimates. Then, we show the performance of the proposed framework through a simulation study. Last, we conclude with a discussion of findings, limitations, and potential future research.
Artificial Neural Networks and Semisupervised Learning
An ANN is a computational system inspired by biological neural systems for information processing in animal brains. An ANN is built on inputs being translated to outputs through a series of neuron layers. It consists of three types of layers: an input layer, a hidden layer(s), and an output layer. Each layer consists of a number of neurons (or nodes), and each node is connected to the nodes in the next layer. Each layer (except for the input layer) uses the output of its previous layer as the input. There are two advantages of using ANNs for psychometrics: first, the feature hierarchy (LeCun, 2012) supports ANNs to extract the latent variables (e.g., student ability, student attribute profiles) measured by the designed items in an assessment; second, the Universal Approximation Theorem (Csáji et al., 2001; Hornik et al., 1994; Lu et al., 2017) supports ANNs to approximate the item response equation, which represents the relationship between latent variables (e.g., student ability, student attribute profiles) and observed outcomes. These two advantages also bring ANNs promising computation techniques for tolerating some loss of quality or optimality in computed results.
Most previous research studies focused on supervised learning ANNs to classify students into different latent groups for cognitive diagnostic classification (CDM; Cui et al., 2016; Cui et al., 2017; Paulsen, 2019). In these studies, to train the supervised learning ANNs, the ideal response patterns were set as the input layer and the associated attribute profiles as the output layer. Cui et al. (2016) assumed the deterministic inputs, noisy, and gate (DINA; Junker & Sijtsma, 2001) model with both slipping and guessing parameters fixed to zero to simulate ideal responses for training a multilayer perceptron. However, item parameters are more difficult to fix when simulating from IRT model equations as they require more specific parameter values, and the results of supervised learning ANNs were not as accurate as the DINA model in the simulation study (Cui et al., 2016) for CDM. Some other research studies applied unsupervised learning ANNs (e.g., self-organizing map; Cui et al., 2016) to do latent class grouping for CDM. However, the unsupervised learning ANNs are not suitable for IRT model applications because the latent traits in IRT models are continuous rather than categorical variables.
Semisupervised learning (Zhu & Goldberg, 2009) concerns the study of how computers and natural systems learn in the presence of both labeled and unlabeled data. It is somewhere between supervised learning and unsupervised learning. The research goal of semisupervised learning is to understand how combining labeled and unlabeled data can change the machine learning behavior and allow for the design of algorithms that take advantage of such a combination. Xue and Bradshaw (2021) first provided a semisupervised learning ANN method for CDM. The semisupervised learning architecture could refine the classification accuracy based on the initial classification obtained from two more constrained DCMs (i.e., DINA and DINO models). The experimental results showed the proposed method obtained more accurate and robust classification results than theoretical DCMs when the item response equations and Q-matrices were misspecified, and the assessment did not have a high diagnostic quality (i.e., the difference of correct response rates between the mastery group and nonmastery group is greater than 0.30). These findings inspire the notion, explored in the current study, that semisupervised learning could improve estimation accuracy in measurement applications when the data contains noise (e.g., noise resulting from nonignorable missingness). In the next section, we will motivate this application by exploring MNAR data mechanisms in a VLE.
Exploratory Study
Sample
The data consist of student responses to the “Algebra I” items within Math Nation, which is a VLE used statewide in Florida, as well as a few other states (Lastinger Center for Learning, 2020). This VLE has a series of instructional videos and practice items organized into 10 domains. We focused on analyzing responses to items from the entire item bank of each Algebra I domain, which are used in the VLE to randomly draw questions for 10-item quizzes. Student use of these quizzes to practice has been positively related to student achievement on Florida’s high-stakes Algebra 1 End-of-Course assessment (Leite et al., 2019; Leite et al., 2021). For each domain, the number of items in the item bank ranged from 41 to 89, and we assumed that each domain consisted of a unique trait. The total number of students in the sample was 63,625, which was obtained in the 2017/2018 academic year from 71 districts in Florida (this number includes brick-and-mortar districts as well as virtual schools).
In Math Nation, students can self-select to take test items, and the VLE provides randomly selected items from the domain item bank to the student. Since students were allowed to self-select to respond to items, and to skip items presented by the VLE, the full item response matrix that crosses all 63,625 students with all items in a domain contains a large number of missing values. Figure 1 shows a visualization of the missing data, with each domain of Algebra I in Math Nation being represented by a subfigure. The x-axis of each subfigure indicates the item ID. The red, green, and blue filling refer to incorrect response, correct response, and no response (missing values), respectively. Note that for some newer items in the VLE, the missing proportions are close to 1.00, so these items were removed in the following analyses. Even removing the students who skipped one domain, the proportions of students missing responses for most items in the domain are between 0.55 and 0.75.
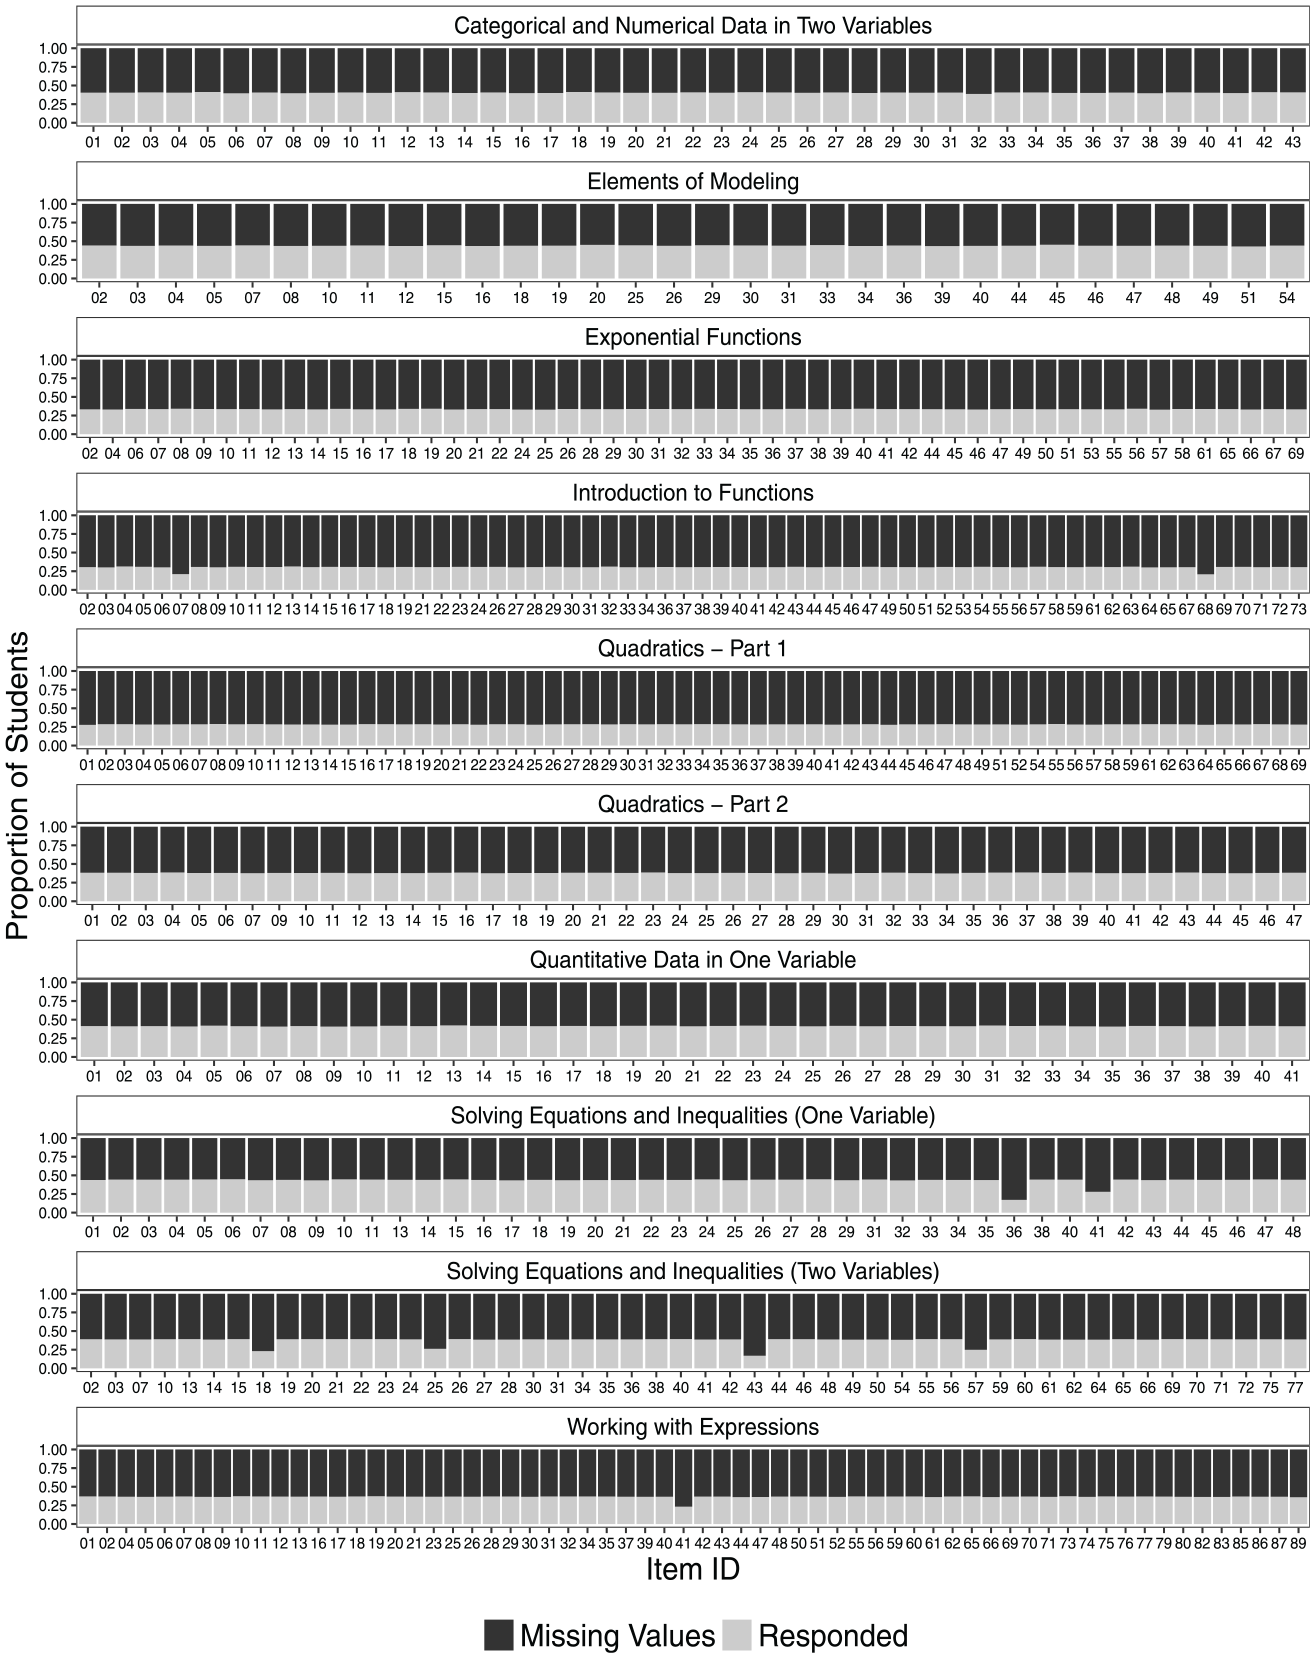
Visualization of missing item data in Algebra Nation Data of Florida, by domain (excluding students who did not move into the domain).
Generally, the response patterns of students can be classified into three categories: (1) skipped the domain (i.e., no responses to any test items within the domain), (2) completed the domain (i.e., responded to all test items within the domain), or (3) mixed response (i.e., responded to some items within the domain). We were not able to distinguish skipped from not-reached items in our data, and hence these two forms of missing responses are grouped together under the mixed response category. Table 1 shows that although the raw frequency of students who completed the domain was relatively large, they constituted a small proportion of the total sample (less than 5%).
Overview of the Data for Operational Data Exploration.

Note. The total number of students is 63,625. Available items were the ones with enough responses. Completing Domain is the group of students who completed all the available items in one domain; Skipping Domain was the group of students who skipped all available items in one domain; Mixed Response was the group of students who complete a part of available items in one domain.
Research Questions
In the exploratory study, we asked three questions: (1) Is there a relationship between skipping a domain and student ability? (2) Is there a relationship between not completing a domain and student ability? (3) Is there a relationship between skipping an item and student ability or item difficulty?
Analysis and Results
We used tree-structured logistic regressions (see Figure 2) to answer the questions. We did not have a latent algebra ability estimate to use in this exploratory analysis, so we used the state’s standardized mathematics test scores (i.e., Florida Standards Assessment; Florida Department of Education, 2021) from the prior school year as a proxy for ability. This is the one piece of data from outside the VLE that we used in our full study to obtain our results. We also did not yet have estimates of item difficulty from an IRT model, so we used the incorrect response rates (i.e., the proportion of students who answered the item incorrectly out of all students who engaged with the item) as a proxy, mirroring a classical test theory approach. For example, if the incorrect response rate was 89%, the item difficulty was set as 0.89. The tree-structured logistic regression was applied to each domain respectively.
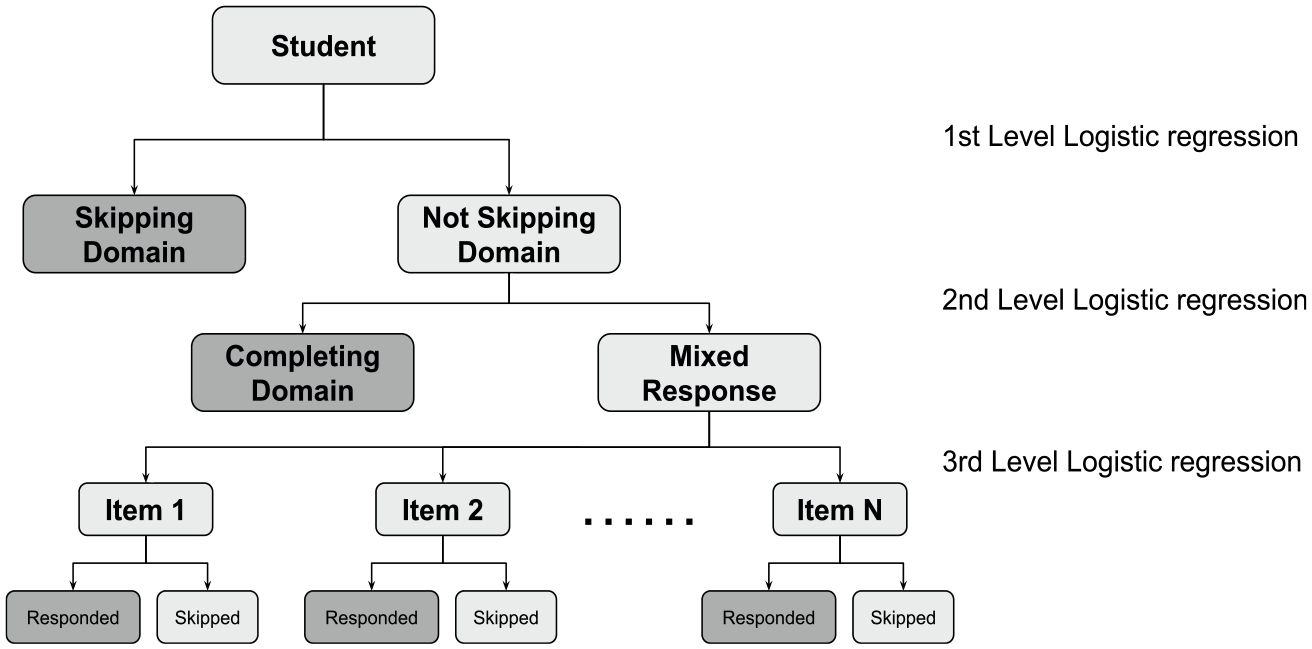
Flow chart of the tree-structured logistic regression.
To address the first research question, all students were classified into two groups within each domain: students who skipped the domain and students who did not skip the domain. Within the group of students who did not skip the domain, students were grouped as either those who completed the domain or those who responded to some but not all items in the domain. Then we fit a logistic regression model to the data of each district individually as

where
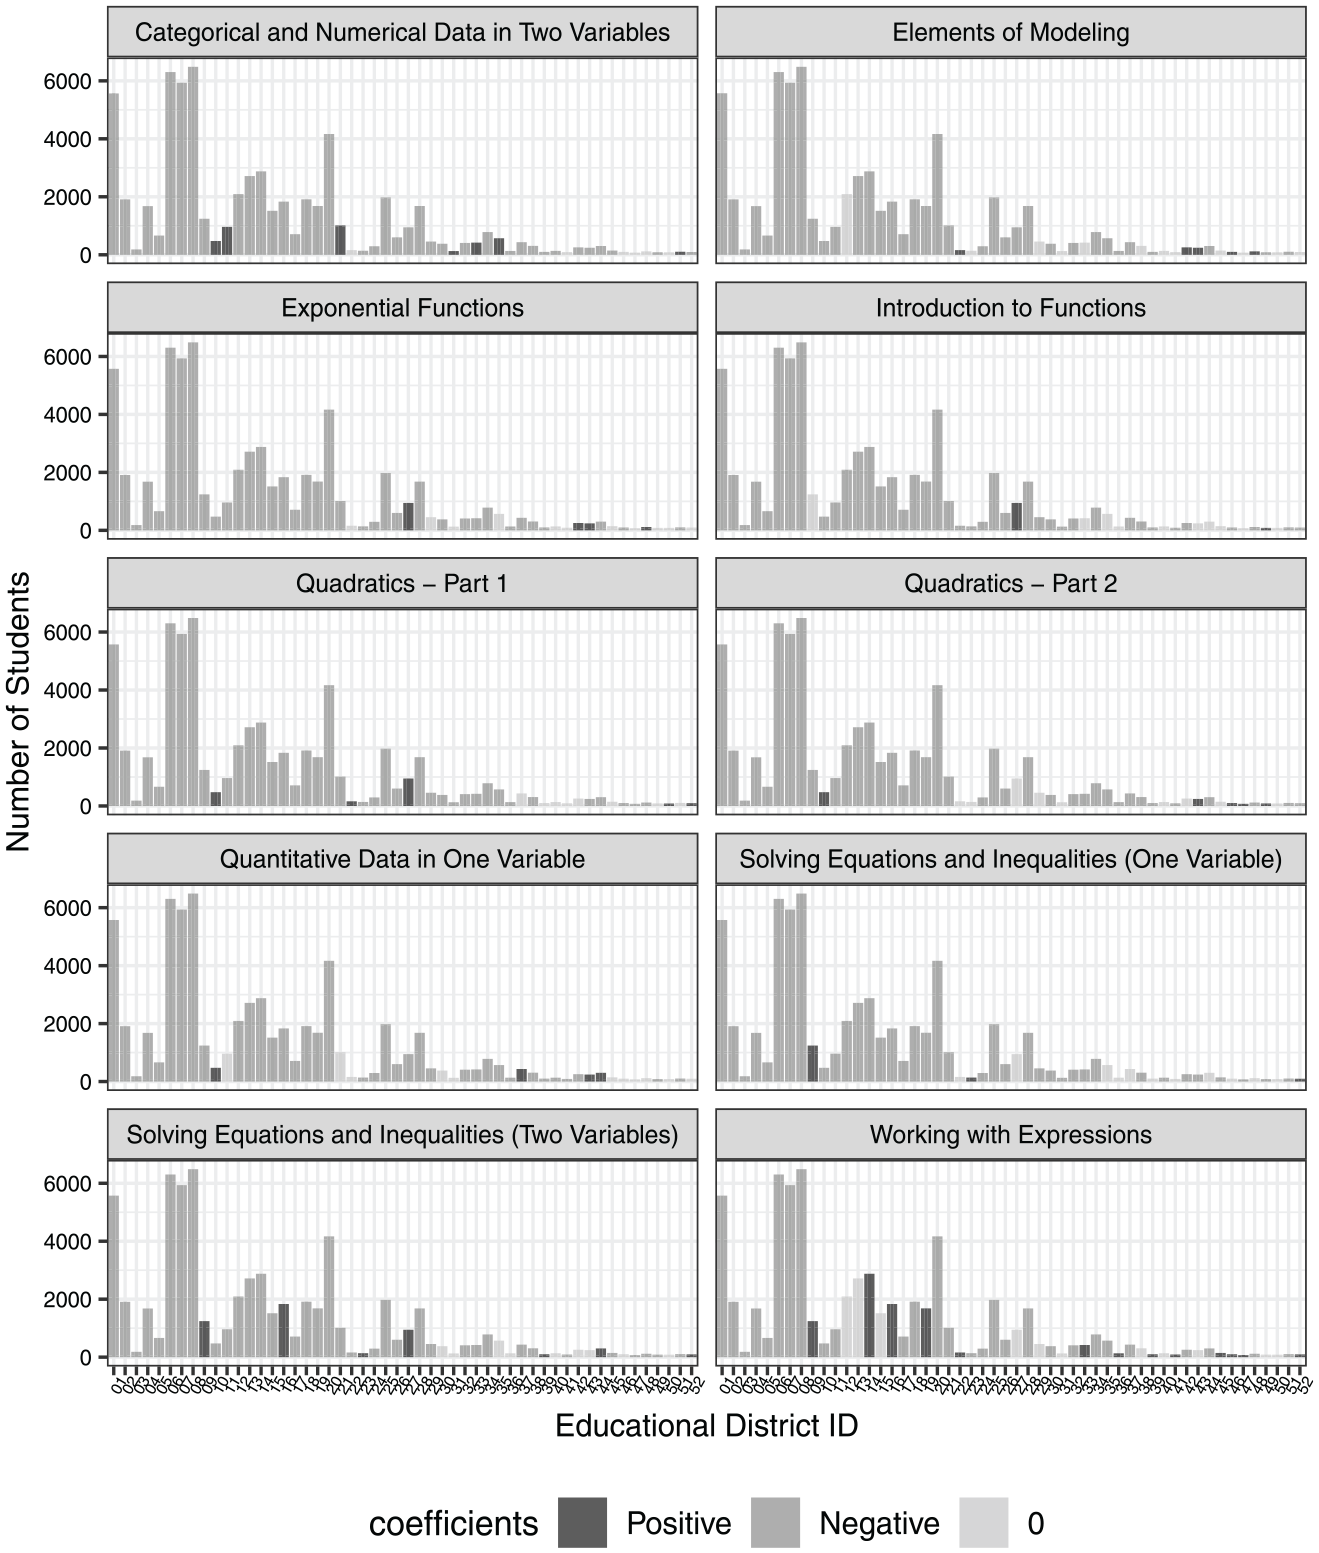
Results from the logistic regression analysis relating ability to skipping domains (only shows the district with over 100 students engaged).
To answer the second question, we divided the data set into two groups for each domain: students who completed the domain and students who did not. A logistic regression model was conducted for each district individually as

Compared with the results of the first question, we found that estimates
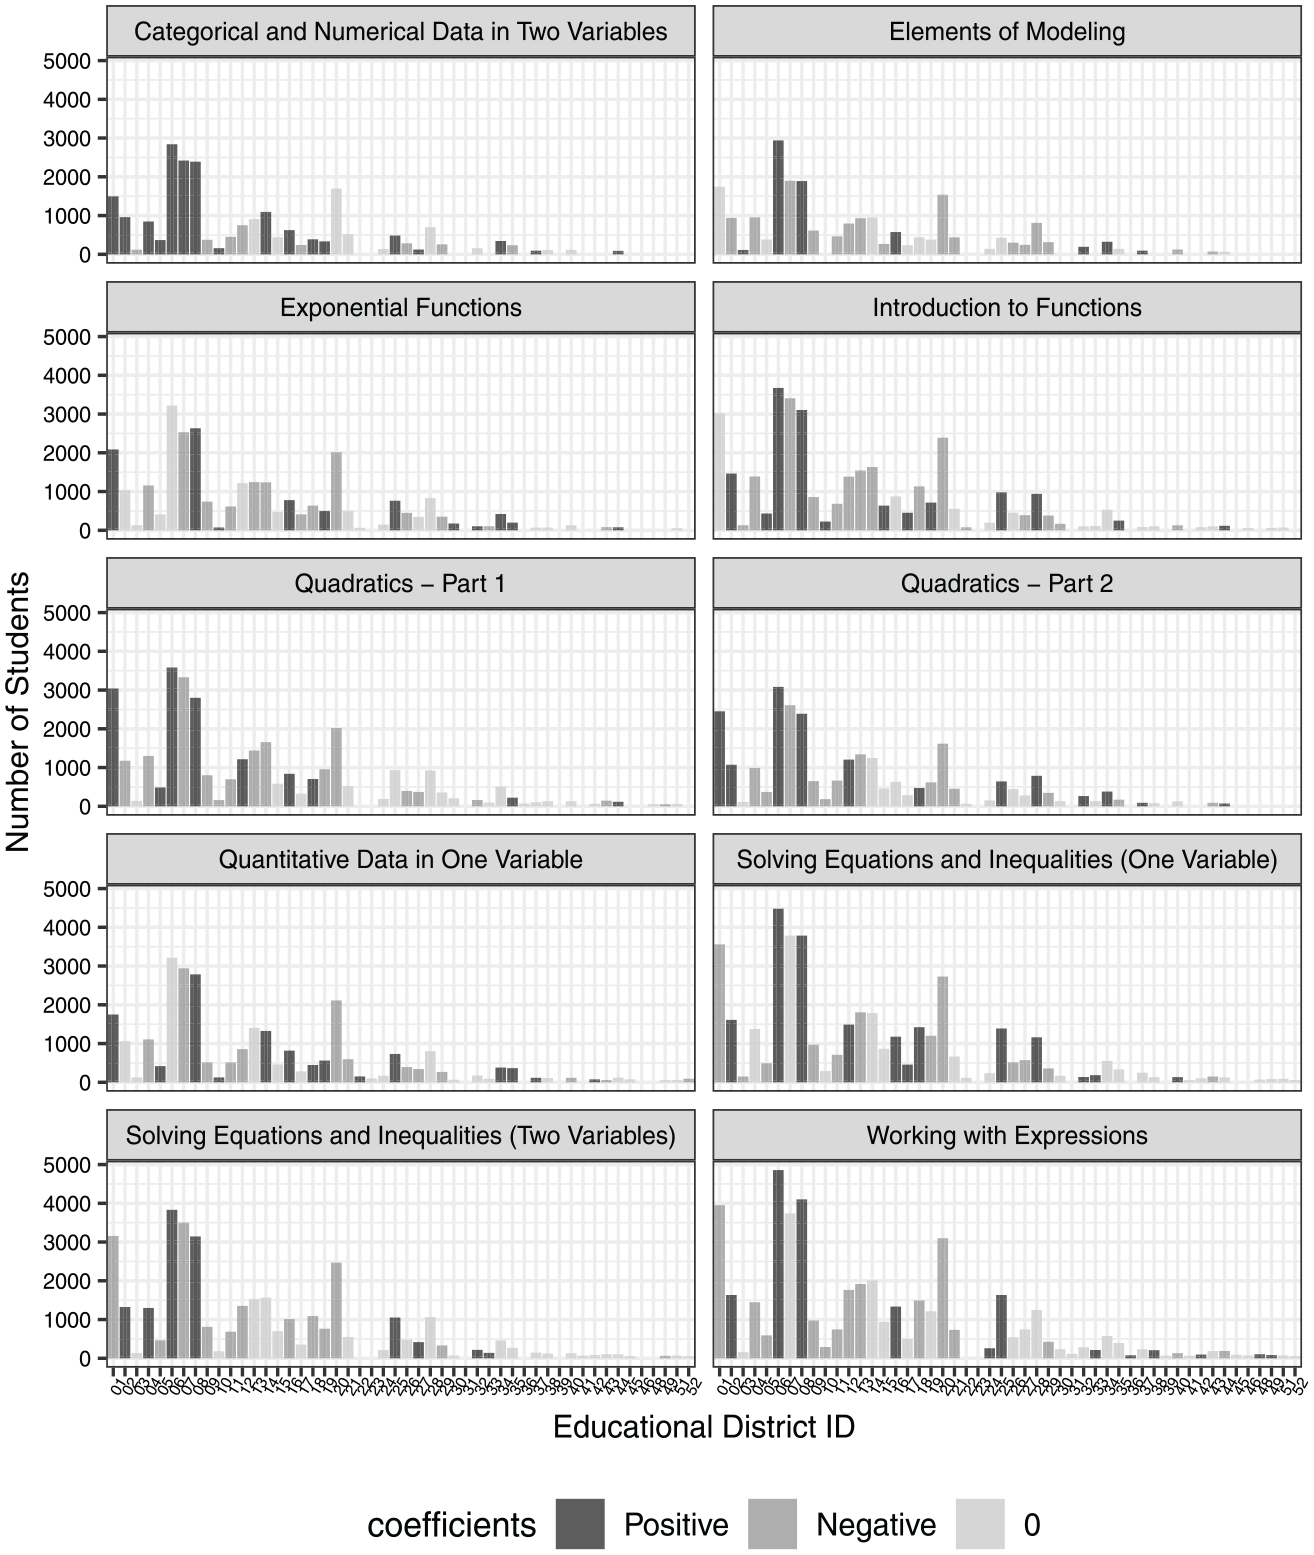
Results from the logistic regression analysis relating ability to not completing domain.
To answer the third question, in contrast to the previous two questions, the logistic regression was not applied to each district respectively for two reasons: (1) at the item level, for the students who completed a part of the domain, the district should have no impact on which particular items were shown to the student because they were randomly selected; (2) due to the high missing proportion of each item, the number of students of each district was too small to achieve a reliable estimation result in the logistic regression. With regard to the response type to the kth item in the ith domain, we put students into two groups (i.e., those who skipped the kth item and those who did not) to fit the logistic regression model defined as
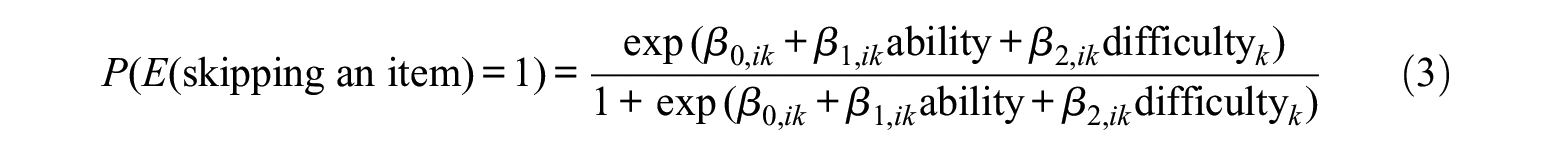
where
The Results of the Mixed Response Testing.

Note.
p value < .0001 in logistic regression test.
Conclusion
In summary, the data exploration provided the following findings: (1) students with higher ability had a lower probability of skipping a domain; (2) students with higher ability had a lower probability of skipping items that were presented to them; (3) students were more likely to respond to easy items; and (4) choosing to not complete a domain was not consistently related to ability across the districts. We believe the final finding is related to the fact that teachers guide students through the Algebra curriculum throughout the year, and hence deciding when and which domains to use may be more teacher driven than student driven. Ultimately, we conclude that our data set not only had a large proportion of missing data for each item but also that much of that missing data was MNAR. Therefore, this result motivated the development of a semisupervised learning-based method for obtaining unbiased item parameter estimates applicable to VLE data with a large proportion of MNAR data. In the next section, we present the proposed method in detail.
A Semisupervised Learning-Based Bias Adjustment Method
The proposed semisupervised learning-based bias adjustment procedure contained two parts: (1) unbiased ability estimation using semisupervised deep learning architecture; (2) item parameter adjustment methods to obtain unbiased item parameter estimates. These two parts are discussed separately below.
Unbiased Ability Estimation Using Semisupervised Deep Learning Architecture
To apply semisupervised learning to the VLE item data from Math Nation, we first fit the two-parameter logistic (2PL) IRT model to complete data sets in each Algebra 1 domain by using only the data from students who completed all items in the domain, referred to as anchor students. However, we assume the parameter estimates are biased when obtained from only the anchor students due to the deletion of MNAR data. Thus, to achieve unbiased parameter estimation through the semisupervised learning algorithm, we needed to achieve these two goals:
Extract unbiased latent trait
Specify the relationship between the biased trait estimates
Although a Bayesian method could be an optional method to achieve these goals, determining
Results from the logistic regression analysis relating ability to completing domains (only shows the district with over 100 students engaged).
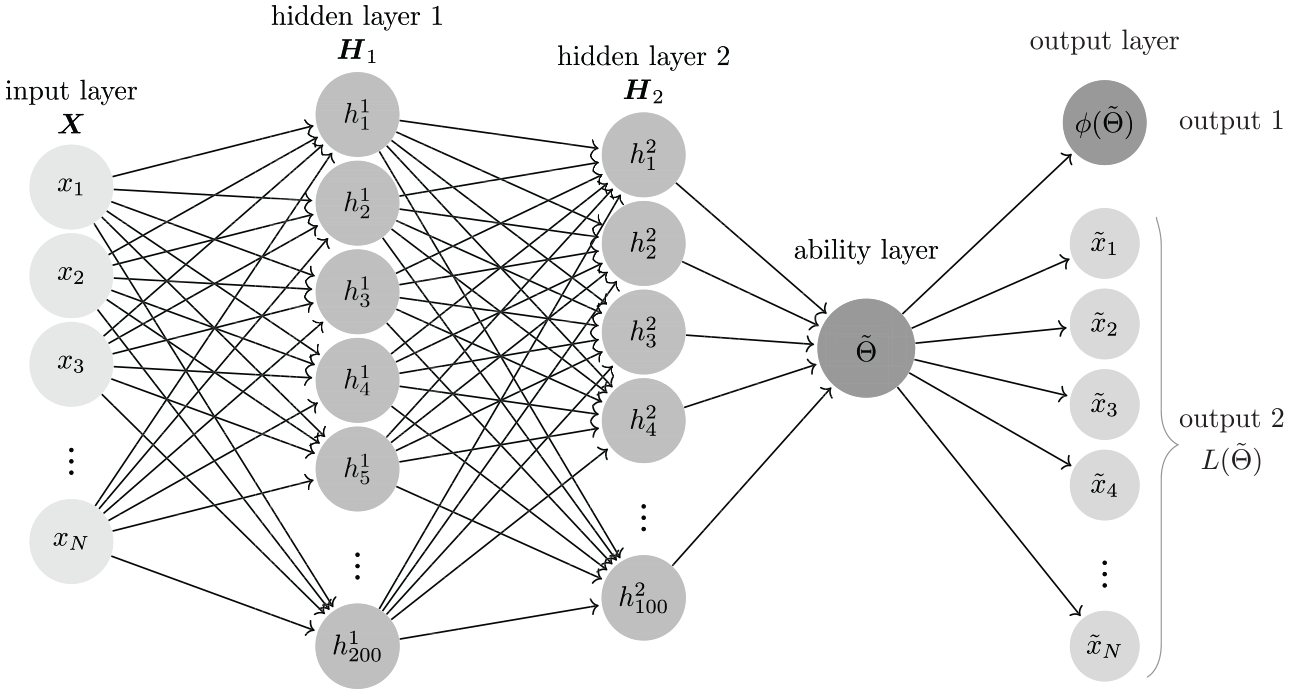
From Figure 5, there are two hidden layers between the input layer and the latent trait layer. The number of hidden layers was based on previous research using deep learning methods for CDM (Cui et al., 2017; Xue, 2019). Rectified linear units (ReLU; Lu et al., 2017) was chosen as the activation function to bring nonlinearity to the system. The unbiased latent trait

where

where
To train the unknown parameters

In the weighted cost function, we used two kinds of error functions corresponding to two outputs. Because the first target,
Two Item Parameter Adjustment Methods
The DFN converted observed response pattern
The first adjustment method, item equating adjustment (IEA), was inspired by the horizontal equating method (Baker, 1984), which refers to the equating of tests administered to groups with similar abilities taking similar tests.

where
The second adjustment method, bootstrapping adjustment (BA), was proposed to reduce the biases contained in both item difficulty and item discrimination parameters. The BA method includes four steps:
Creating a new item response set based on sampling with replacement from the anchor students considering their unbiased ability estimates
Apply 2PL-IRT to the new sample set to estimate the item parameters
Repeat Step 1 and Step 2
Calculate the estimate of item discrimination as
In our study,
Simulation Study
In this section, we report an evaluation of the proposed semisupervised learning method and adjustment methods through a simulation study with the 2PL-IRT model as the population model. The research question we addressed was: To what extent can the semisupervised learning-based method lead to a reduction in bias of item parameter estimates from the 2PL-IRT model?
Method
To imitate the operational data set used in the exploratory study, we simulated data that contained the same number of students (63,625), the same number of items in each domain, the same number of domains (10), and also the same number of districts. We used the state’s standardized mathematics test scores and biased item parameters from the exploratory study as population parameters for student true ability and item parameters during data generation, with the latter obtained by fitting 2PL-IRT models to the data (treating domains as separate data sets) that contained missingness. The simulation steps for each domain were as follows:
We simulated the response for each item using the student pretest mathematics ability and the item parameters under the 2PL-IRT model. The item parameters were estimated by fitting the 2PL-IRT model to the observed data containing missingness.
Given the true ability, we calculated the probability of the student skipping the domain using the fitted logistic regression model in Equation 1 as the data-generating model. Using this probability, students were classified into a “skipping domain” group if
For the students classified into the “not skipping domain” group in Step 2, we used the fitted logistic regression model in Equation 2 as the data-generating model to calculate the probability of completing domains for each student. If the probability
For students belonging to the “not completing domain” group in Step 3, we used the fitted logistic regression model in Equation 3 as a data-generating model to define if a student skipped an item using student pretest ability and the observed item’s incorrect response rate. For students who skipped the item (
Table 3 compares our operational data and our simulated data with respect to the average ability and the number of students for the three groups: students who skipped a domain (skipping domain group), students who completed the domain (anchor students group), and students who completed a portion of the items in a domain (mixed response group). For the anchor student group, the average ability and the number of students were very similar between the operational and simulated data. Taking the domain “Quadratics—Part 2” as an example, the average ability and number of students in the operational data were 0.23 and 3008, respectively, while the two values in the simulated data were 0.23 and 2964, respectively. In addition, for the skipping domain group, the average abilities in both data sets were negative, and for the mixed response group the average abilities in both data sets were positive.
The Comparison Between Observed Operational Data and Simulated Data.

Note. In each cell, the first number indicates the average ability of the students; the second number in the bracket indicates the number of students.
Analysis and Results
We used the “mirt” package (Chalmers et al., 2012) in R (R Core Team, 2013) to conduct data simulation and IRT model fitting, and the “Tensorflow” library (Abadi et al., 2016) in python (Van Rossum & Drake, 2009) to implement the semisupervised deep learning. 1
After simulating the data, we first fit the 2PL-IRT model to anchor students’ responses for each domain to estimate the item parameters and student abilities. For example, Figure 6 shows the comparison between estimates and the true value of items contained in the domain “Quadratics—Part 2.” We could observe that for most items, the 95% confidence interval of the item discrimination estimates covered the true values, but the 95% confidence interval of the item difficulty estimates did not cover the true difficulty parameters. We observed similar patterns in other domains.
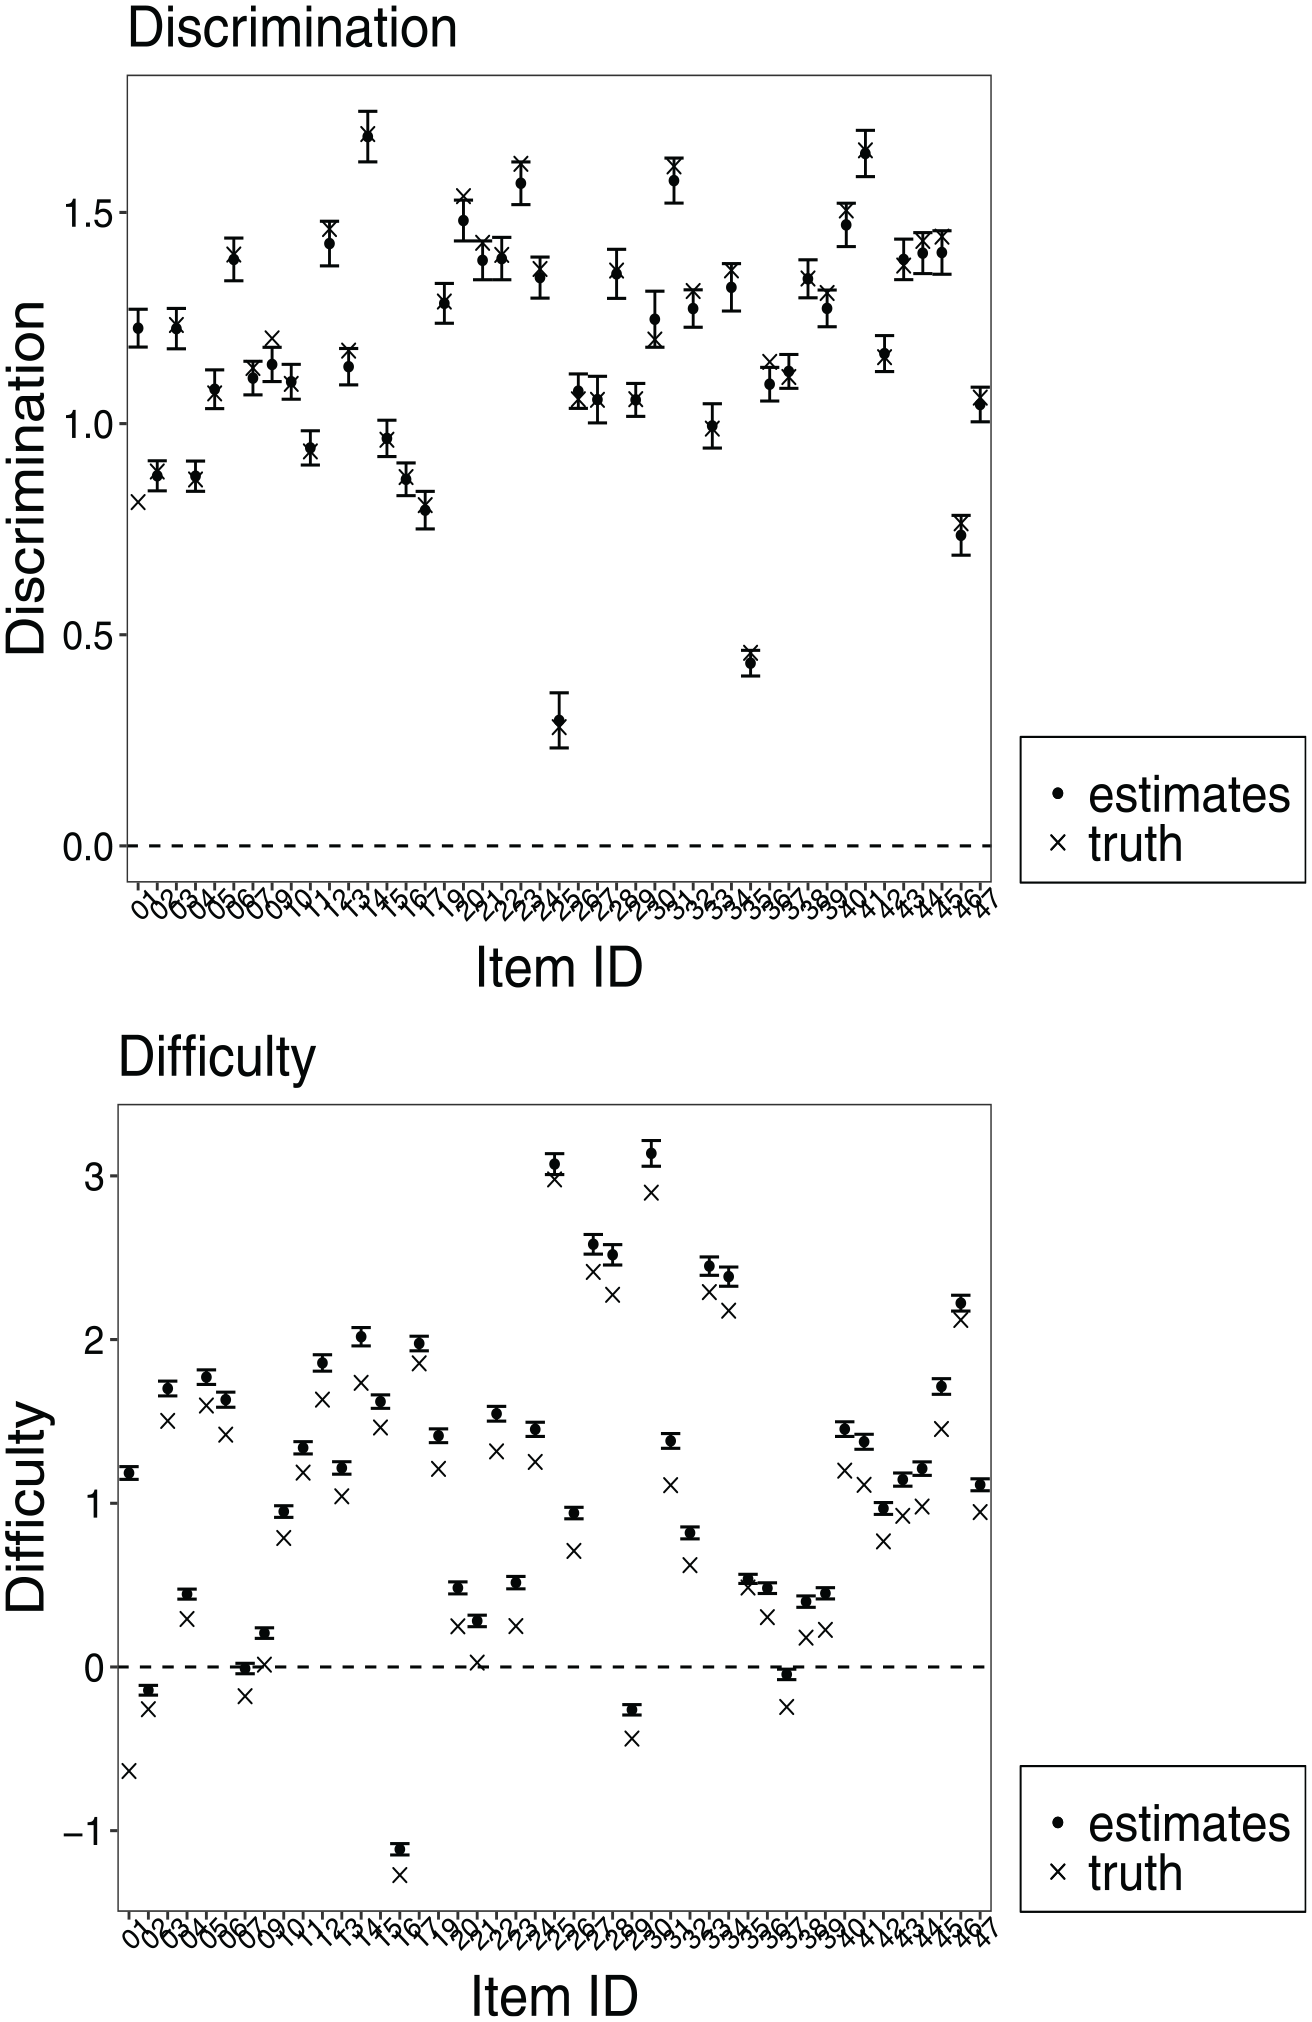
Comparison between estimates and the true value of items contained in the domain “Quadratics—Part 2.”
Then, the proposed semisupervised deep learning architecture (see Figure 5) was applied using the simulated anchor students’ responses as input and using the anchor students’ ability estimates and their response patterns as two targets. The unbiased abilities of anchor students were estimated by minimizing the weighted cost function in Equation 7. The validating test was conducted in the training procedure to avoid overfitting and to determine the two hyperparameters,
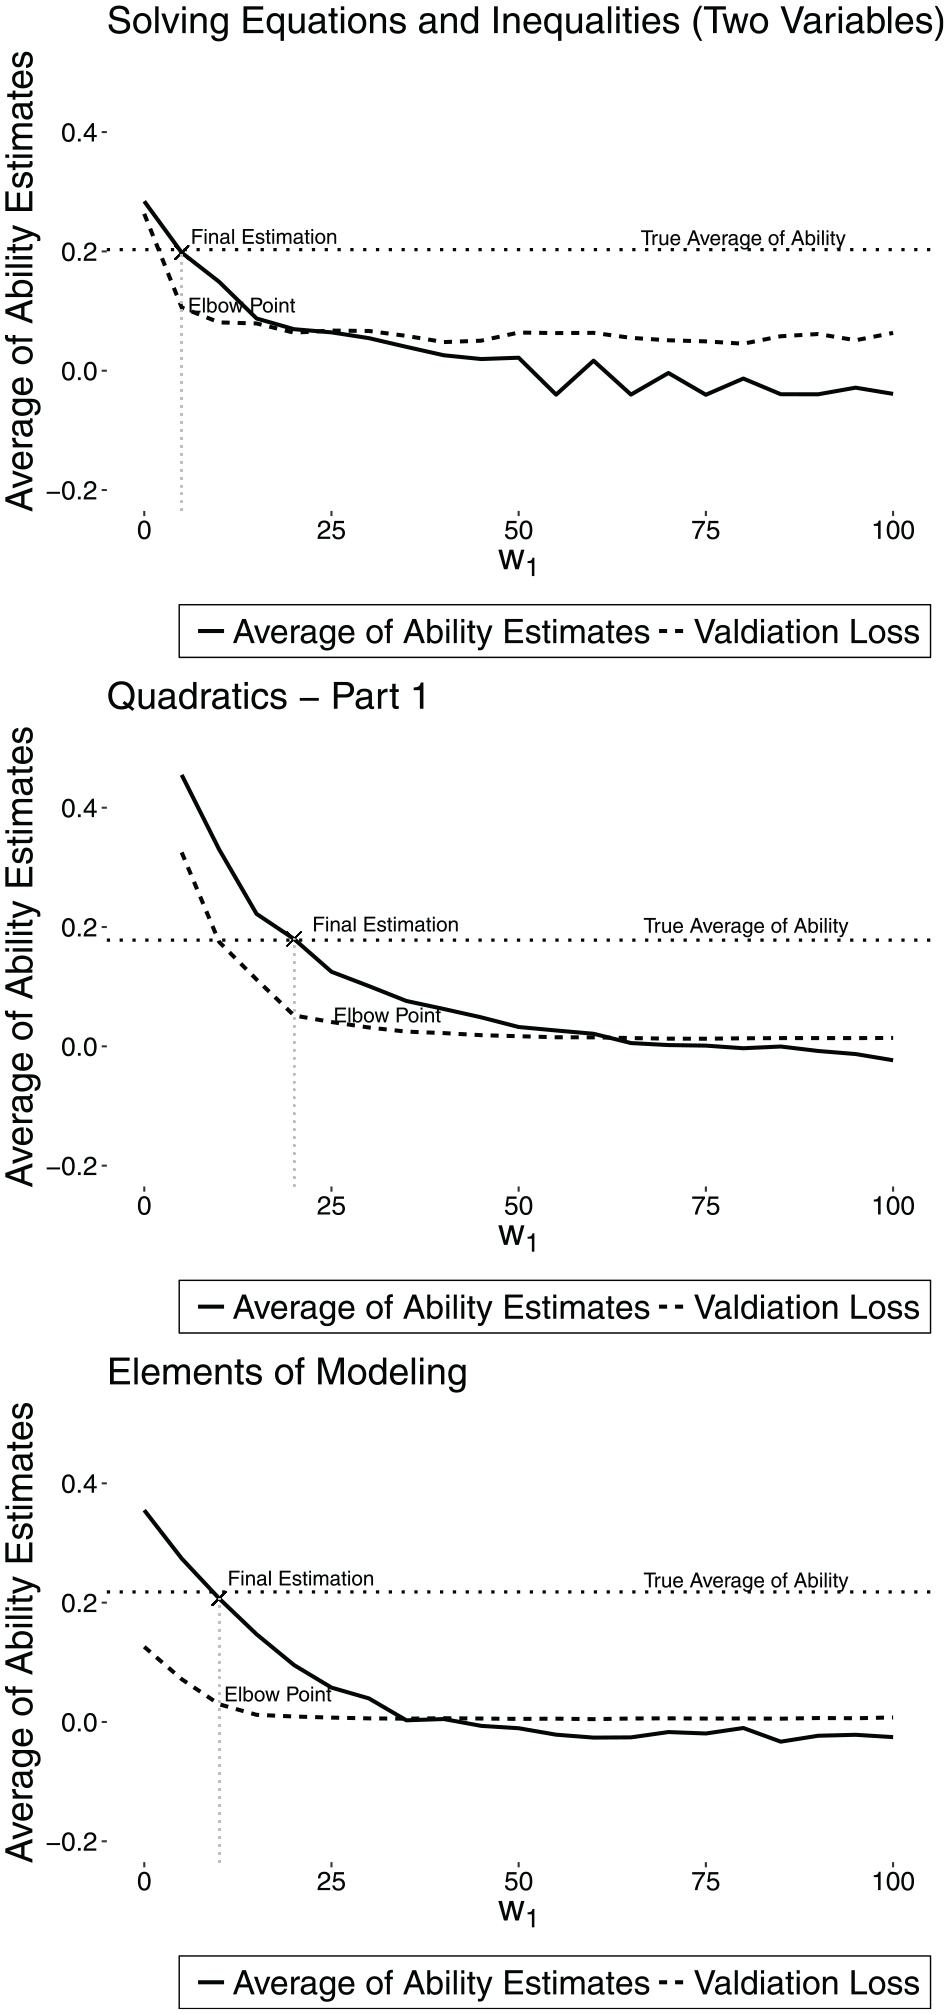
Three examples of choosing the appropriate hyperparameters using the elbow method.
Because of the large number of parameters contained in the deep learning structure, the random initialization of parameters may affect the optimization when the training sample size is not large enough. Thus, one concern of using ANNs/deep learning techniques for psychometrics is that using a feature extracted by deep learning through a single training is risky as it is sensitive to the starting points of the parameters (Briggs & Circi, 2017). To solve this concern, we conducted 100 DFN trainings individually, produced ability estimates for each training, and then averaged the results as the final estimates of ability for anchor students. It took approximately 10 minutes to complete 100 DFN trainings in one domain. The total time for completing each domain was approximately 2 hours.
Table 4 compares the distribution of anchor students’ ability between the biased 2PL-IRT model estimates and the proposed semisupervised deep learning architecture estimates. Table 4 shows that for each domain, the true average ability was positive and the standard deviation was less than 1. However, when fitting the 2PL model to the original data with correct, incorrect, and missing item responses (i.e., 1, 0, and NA), the average ability was consistently estimated as 0 across the domains. In contrast, the averages of the student ability estimates from the proposed semisupervised deep learning architecture were close to the true values. The proposed semisupervised deep learning architecture achieved more accurate average ability estimates without pre-data analysis to test if the sample collected could represent the population.
Comparison of the Distribution of Ability Estimates Between the 2PL-IRT Model Fitting to Original Data and the Proposed Semisupervised Deep Learning Architecture.

Note. In each cell, the first number refers to the average ability, and the number in the bracket refers to the standard deviation (
Parameter Estimate Bias Adjustment
After estimating the anchor students’ abilities through the semisupervised deep learning architecture, the two proposed adjustment methods, IEA and BA, were conducted to reduce the biases contained in the item difficulty parameters. We chose three criteria to compare the two adjustment methods with the biased 2PL-IRT model fitting results using the anchor students’ response: bias, root mean square error (RMSE), and variance of absolute bias of item difficulty parameter estimates (Variance). Bias indicates the difference between item difficulty estimates and true item difficulty parameters. RMSE indicates the distance between item difficulty estimates and true item difficulty parameters. Variance indicates the consistency of the bias adjustment across items. The bias, RMSE, and Variance were calculated as
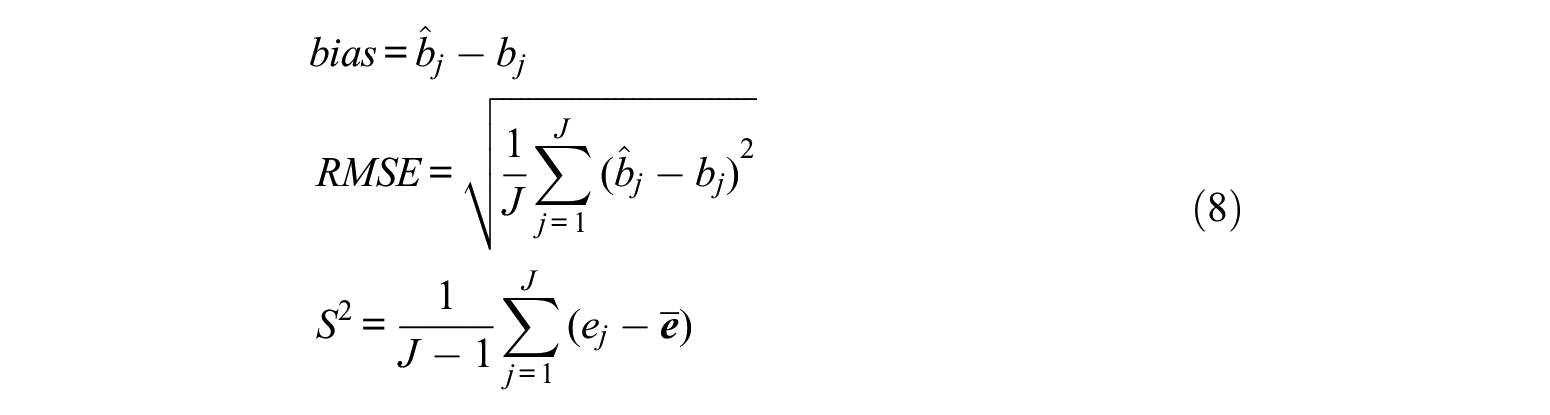
where
Figures 8, 9, and 10 compare the unadjusted item difficulty parameter estimates to the adjusted estimates based on both the IEA and BA methods. Figure 8 shows that the error results stemming from the IEA and BA method estimates cover 0 for all 10 domains, but the unadjusted item difficulty parameter estimates are biased for some domains (e.g., “Categorical and Numerical Data in Two Variables”). Figure 9 shows that the IEA and BA methods achieved smaller RMSE results for each domain. For variance of absolute bias in Figure 10, since the IEA adjusted the difficulty estimates based on a parallel shift of the ability distribution, the variances of absolute bias from both IEA and the unadjusted estimates are equal. In other words, IEA can decrease the RMSE of parameter estimates and adjust the total bias, but the consistence of the bias adjustment is not improved. However, the BA method obtained more consistent bias adjustment (i.e., lower variance) because the bootstrapping in BA created standard-unit normally distributed samples, which matched the assumption of the original IRT estimation.
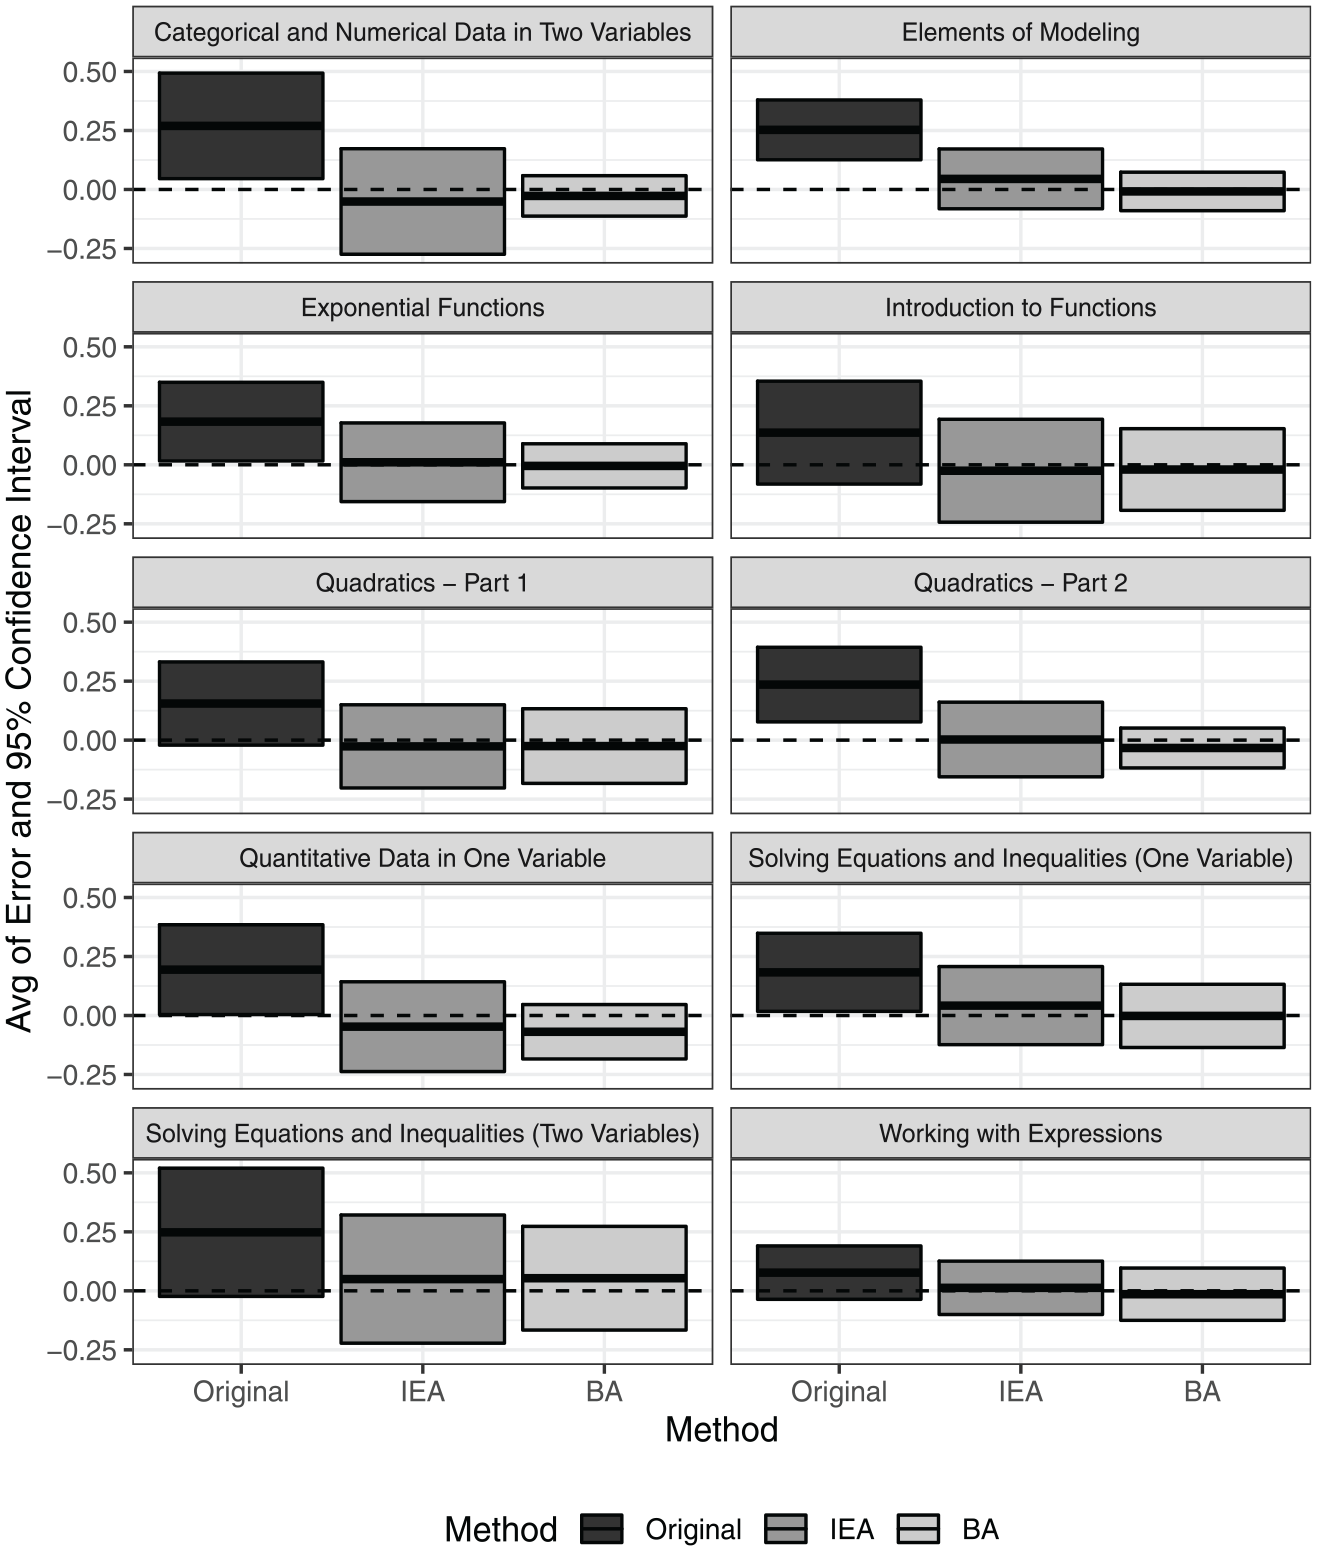
Bias comparison of item difficulty estimates across the unadjusted results (Original), the item equating adjustment (IEA) results, and the bootstrapping adjustment (BA) results.

RMSE comparison of the item difficulty estimates across the unadjusted results (Original), the item equating adjustment (IEA) results, and the bootstrapping adjustment (BA) results.

Variance of absolute bias comparison of the item difficulty estimates across the unadjusted results (Original), the item equating adjustment (IEA) results, and the bootstrapping adjustment (BA) results.
Discussion and Conclusion
With the proliferation of VLE usage in educational systems (King & South, 2017), there is a desire to obtain accurate estimates of student ability from VLE log file data, which would most often needs to be done through item response data. This is complicated by the fact that the unstructured item response data often contains a large proportion of missingness. However, if one can obtain unbiased IRT item parameter estimates associated with the item response data, fixed item parameters can be used in a variety of ways to obtain accurate ability estimates for students who have taken different sets of items in the VLE.
To tackle the challenge of obtaining unbiased item parameter estimates from sparse VLE item response data, we first explored a statewide-used VLE data set to test hypotheses surrounding the relationships between the missing data and student ability and item difficulty. The exploratory study showed that the missingness was nonignorable (i.e., MNAR), which indicated that ignoring it would affect parameter estimation accuracy. Restated, the estimated parameters are unbiased for the students who completed all items (i.e., anchor students in this research) but might be biased for the students who did not complete all items in the VLE (i.e., students skipped some domains, students skipped some items within domains, or students did both).
To solve this problem, we proposed a semisupervised learning framework that is novel to IRT applications. In the proposed framework, we used deep learning to convert observed response patterns to continuous latent traits and approximate some continuous functions, which are otherwise hard to simultaneously specify mathematically. In addition, using the ability estimates through the semisupervised learning framework, we also proposed two kinds of adjustment methods to improve the item parameter estimation accuracy. The simulation results showed that the proposed framework adjusted the biases contained in both students’ ability estimates and item parameter estimates under the 2PL-IRT model. We believe that many researchers using VLE data can benefit from following our proposed method in order to obtain critical, accurate information about item parameters that can be used to support ongoing ability estimation in the VLE platform.
There were still some limitations in the proposed framework. The first limitation is that some anchor students (students who did not skip items in a domain) are required for the proposed method. In the absence of a sufficient number of anchor students, the deep learning architecture could potentially be modified to a multiclass classification model that considers the missing values as the third response type among the correct and incorrect responses. One potential advantage of this combination is that all students’ responses (including missingness) could be used as training data. The second limitation is that a large data set is required for training in the deep learning architecture, but for new items in a VLE platform, the sample size of responses may not be large enough. Transfer learning (Pan & Yang, 2009) and item characteristic prediction using natural language processing (Manning & Schütze, 1999) are potentially applicable solutions to this problem. Transfer learning and natural language processing could provide better starting values and initialization of the parameters for training models on new items with few responses from students.
Footnotes
Declaration of Conflicting Interests
The author(s) declared no potential conflicts of interest with respect to the research, authorship, and/or publication of this article.
Funding
The author(s) disclosed receipt of the following financial support for the research, authorship, and/or publication of this article: The research reported here was supported by the Institute of Education Sciences, U.S. Department of Education, through Grant R305C160004 to the University of Florida. The opinions expressed are those of the authors and do not represent the views of the Institute or the U.S. Department of Education.