
Abstract
Using classical test theory and item response theory, this study applied sequential procedures to a real operational item pool in a variable-length computerized adaptive testing (CAT) to detect items whose security may be compromised. Moreover, this study proposed a hybrid threshold approach to improve the detection power of the sequential procedure while controlling the Type I error rate. The hybrid threshold approach uses a local threshold for each item in an early stage of the CAT administration, and then it uses the global threshold in the decision-making stage. Applying various simulation factors, a series of simulation studies examined which factors contribute significantly to the power rate and lag time of the procedure. In addition to the simulation study, a case study investigated whether the procedures are applicable to the real item pool administered in CAT and can identify potentially compromised items in the pool. This research found that the increment of probability of a correct answer (p-increment) was the simulation factor most important to the sequential procedures’ ability to detect compromised items. This study also found that the local threshold approach improved power rates and shortened lag times when the p-increment was small. The findings of this study could help practitioners implement the sequential procedures using the hybrid threshold approach in real-time CAT administration.
Computerized adaptive testing (CAT) reuses test items over time. Therefore, test-takers can obtain previous access to test items that allows them to achieve illegal gains in their test scores. This is especially true in high-stakes licensure exams administered by using CAT. If the stem and answer choices of a compromised or leaked item have been shared with test-takers before they take an exam, they have a better chance to respond to the item correctly during the exam. Compromised items can threaten the validity of inferences from examination scores as well as the fairness of an exam. To maintain the validity and fairness of a high-stakes testing program, continuous monitoring of test items ensures the soundness of items’ psychometric properties.
Various methods detect compromised items in CAT. One method indicates a drift in the item difficulty parameter. Veerkamp and Glas (2000) used a statistical quality control method to detect such a drift. This method reestimates item difficulty parameters for items during the CAT administration and compares them with their initial difficulty parameters. If an item becomes significantly easier according to the cumulative sum (CUSUM) chart, a sequential analysis used for monitoring change-points (Grigg et al., 2003; Page, 1954), the item may be compromised. Kang and Chang (2016) have extended the procedure by using log-likelihood CUSUM statistics. These methods show a satisfactory detection rate, but they cannot be implemented during real-time CAT administration due to the repeated calibrations they require.
Another way to detect compromised items in CAT is to identify aberrant examinees. To detect these respondents, Belov (2014) used a 3D algorithm—merging information theory and combinatorial optimization. Qian et al. (2016) used a lognormal response time model (van der Linden, 2006) to detect aberrant examinees and compromised items in computer-based examinations and a case study based on CAT. Sinharay (2017) proposed using a likelihood ratio test and score test to detect aberrant examinees. O’Leary and Smith (2017) used differential person and item functioning to detect candidate preknowledge and compromised items. Wang et al.’s (2018) mixture hierarchical item response theory model used both response accuracy and response time information to detect aberrant behavior and compromised items. These methods show great potential to detect compromised items, but first they must identify the aberrant examinees. This requirement is very challenging because psychometric evidence may not be sufficient to prove the aberrant behavior of an examinee.
Zhang (2014) and Zhang and Li (2016) proposed sequential procedures based on classical test theory (CTT) and item response theory (IRT), respectively. The procedures use a series of statistical hypothesis tests to monitor whether the item response function (IRF) of individual items had changed significantly across test administration over time. These procedures could be applied to CAT in real time. Choe et al. (2018) incorporated response times into the IRT-based sequential procedure in addition to actual responses. Thus, the procedure can provide even greater statistical power for detecting compromised items as well as stronger substantive evidence that an item is compromised. Liu et al.’s (2019) model with a leakage parameter considers various scenarios in which items become compromised. The more generalized detection method that they developed achieves a high level of detection accuracy while maintaining Type I error rates at the nominal level.
The sequential procedures look promising based on their simulation studies (Zhang, 2014; Zhang & Li, 2016). Although the data simulations in the studies were based on real CAT data sets, the sequential procedures have been applied to few real CAT programs. In addition, the test forms in the studies were fixed-length (≤40 items) from a small item pool (about 400 items). Moreover, the studies used a global threshold, a single cutoff value for all the items in the pool with a high probability (.8 or .9) of being answered correctly. At these high probabilities, the global threshold could detect compromised items well (Zhang, 2014; Zhang & Li, 2016), but it was not applied to items at lower probabilities. In real CAT tests, this high probability may be uncommon, and the probability may increase gradually after items are compromised. Therefore, these procedures may not detect compromised items immediately, and they may have long lag times.
The current study applied the sequential procedures from Zhang (2014) and Zhang and Li (2016) to a real operational item pool in a variable-length CAT. The item pool had 1,472 items administered to 65,753 candidates taking a licensure exam within a 3-month period. The number of items administered to test-takers ranged between 75 and 265. This study used an approach that also works when the probability is lower of test-takers answering a compromised item correctly. To accomplish this goal, this study examined probabilities as they gradually increased to 1.0 by small increments (.1).
The current study proposed a hybrid threshold approach to improve the detection power rate of the sequential procedure while controlling the Type I error rate. The hybrid threshold approach proposes a local threshold for each item in the beginning of the CAT administration. The local threshold is useful for detecting potentially compromised items with probabilities that have increased but are still relatively low overall. The local threshold, a threshold for each item, is determined by using the (1 −α)th percentile of the CTT and IRT statistics from the corresponding item. The hybrid threshold approach uses the global threshold to indicate a large change in the item response function at the monitoring point after the item is flagged as compromised by the local threshold.
This study addressed the following research questions:
What factors affect the detection power rate and lag time of the sequential procedures based on CTT and IRT models?
Does the local threshold approach improve power rates and shorten lag times by using small increases in probability to detect compromised items?
How does the hybrid approach detect possible compromised items in a real test administration based on CAT?
The article is organized as follows. The next section provides the theoretical framework of the sequential procedure based on the CTT and IRT statistics. Then it outlines a hybrid threshold approach. The “Simulation Studies” section describes three simulation studies, including a Type I error study, a power study using the global threshold approach, and a power study using the local threshold approach. The “Case Study” section applies the hybrid approach to the real CAT data to identify any potentially compromised items. Last, after summarizing the simulation and case studies, the article discusses the implications and limitations of the proposed approach.
Theoretical Framework
This research employed a theoretical framework proposed by Zhang (2014). Figure 1 illustrates a series of examinees to whom an item i is administered in a CAT. Let n be an examinee sequence for item i: more specifically, the nth examinee to whom item i is administered. Because items might not be compromised immediately as they are administered in the sequential procedure, a starting point of monitoring (
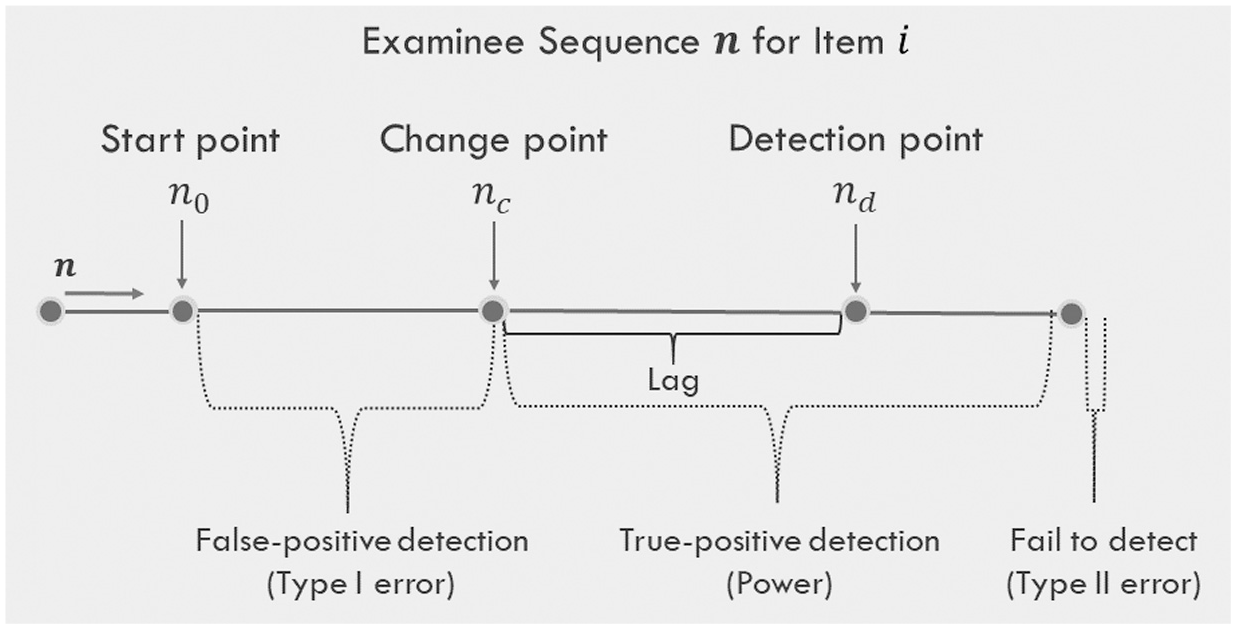
The sequential procedure in an examinee sequence for an item.
The sequential procedure contains three elements that should be predefined by users. The first element, a moving sample size (
Sequential Procedure Based on Classical Test Theory
Based on CTT, the item response function can be defined as a

Reference and target samples and item response functions in the sequential procedure.
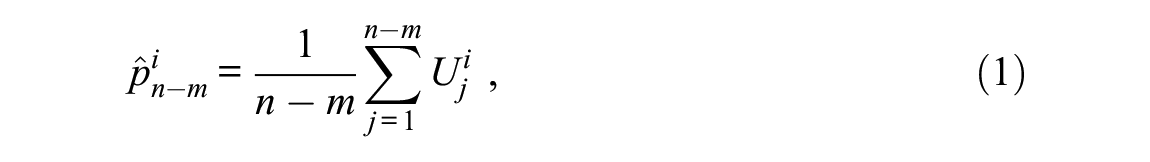
where
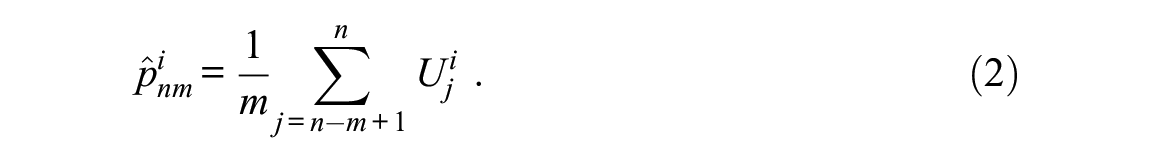
The
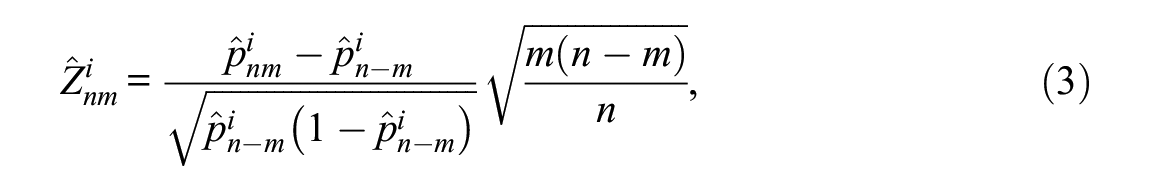
where the denominator of the Z statistic is the standard deviation of the reference sample. If the item has not been compromised at
Sequential Procedure Based on Item Response Theory
The item response function obtained based on item response theory is the probability of answering correctly item i (
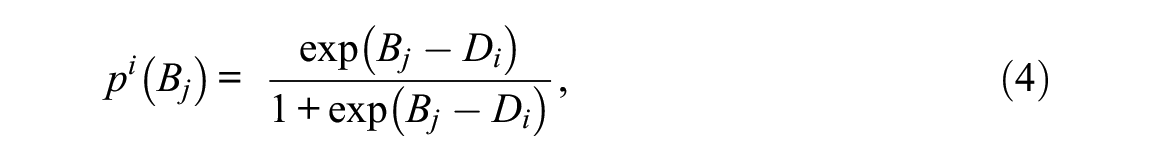
where
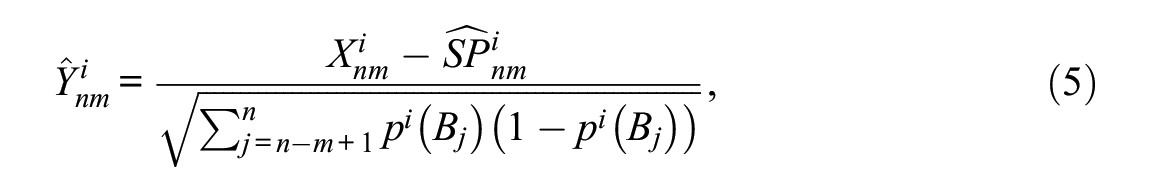
where
Hybrid Threshold Approach
As described in the previous section, a cutoff point or threshold for the sequential procedure must be selected to detect compromised items. If a Z statistic from the CTT method or a Y statistic from the IRT method in the sequence of responses to an item is larger than the predefined threshold, then the item is flagged as compromised. Finding an appropriate threshold for items administered by a CAT system can use a simulation study that mimics the CAT system for the real exam. All the items in the simulation study are initially assumed to be uncompromised. The significance level (
Zhang (2014) and Zhang and Li (2016) used maximum statistics to select a global threshold, a single threshold for all the items in the pool. However, the global threshold could perform well only when the proportion of correct answers to total answers for the compromised items is greater than or equal to 0.8. In a real CAT, though, the proportion of correct responses may increase gradually after items are compromised. In this situation, the global threshold-based procedures cannot detect the compromised items immediately, so those procedures would have longer lag times.
Therefore, the current study proposed a hybrid threshold approach to improve the sequential procedure’s ability to detect when item compromise has begun. The hybrid threshold approach suggests a local threshold for each item in an early stage of the CAT administration, during which the item response function may not have dramatically changed. The local threshold is determined by using the 95th percentile (
This increased detection power rate, however, may accompany an increased Type I error rate. To control the Type I error and indicate a large change in the item response function, the hybrid approach suggests using a global threshold in addition to a local threshold. This approach is especially useful for the decision-making stage. Not only does it help to control the Type I error rate, but it also allows the sequential procedure to flag an item for blocking in the CAT administration until evidence of item compromise is found. The next section describes a series of simulation studies that compared the two threshold methods in terms of power rates and lag times under different simulation conditions.
Simulation Studies
This research conducted three simulation studies—a Type I error study and two power studies—for the simulated data based on real variable-length CAT data. The real variable-length CAT program uses the Rasch model with a minimum length of 60 items and a maximum length of 250 items. The wide range of test length is to ensure the classification accuracy of the candidates whose ability is near the passing standard because it is a high-stake licensure exam. The average test length is around 125 items. The starting point is one logit below the passing standard. A Bayesian ability estimation is used until a candidate gets at least one item correct and one item wrong, at which point the theta estimation method changes to maximum likelihood estimation.
The Type I error study attempted to determine both a global threshold for all the items and a local threshold for each item in the pool. These thresholds were used to flag potentially compromised items in the power studies and the case study. If the Z or Y statistic of a monitoring point for an item was larger than the threshold, the item was flagged as compromised.
Two power studies were performed. Power Study 1 used the global threshold to investigate influential factors on power rates and lag times in the sequential procedures. Power Study 2 used the local thresholds to compare that method’s performance with the performance of the global threshold method, especially under small increments of change, such as .1 or .2, regarding the probability of test-takers answering correctly to items.
Methods
Both CTT- and IRT-based sequential procedures were employed for the simulation studies.
Data
Data were generated based on the real CAT data described in the “Case Study” section. Specifically, candidate abilities were simulated from a normal distribution with a mean of .30 and a standard deviation of .44. Also, candidate responses were generated by using the same 1,472 items and variable-length CAT algorithm as the items and algorithm used in the real exam. Then, simulation studies selected 190 items that had between 1,000 and 2,200 responses to examine the performance of the procedures under the different simulation conditions, described in the “Simulation Factors” section. Table 1 presents the number of responses and the descriptive statistics of the item difficulty levels for all the items in the item pool and for the 190 selected items. The power studies randomly selected 20 items among the 190 items as compromised items in each replication. Responses for the 20 items after the change-point were manipulated according to the increment of probability of correct answers (p-increment).
Descriptive Statistics for Difficulty Levels of Selected Items.
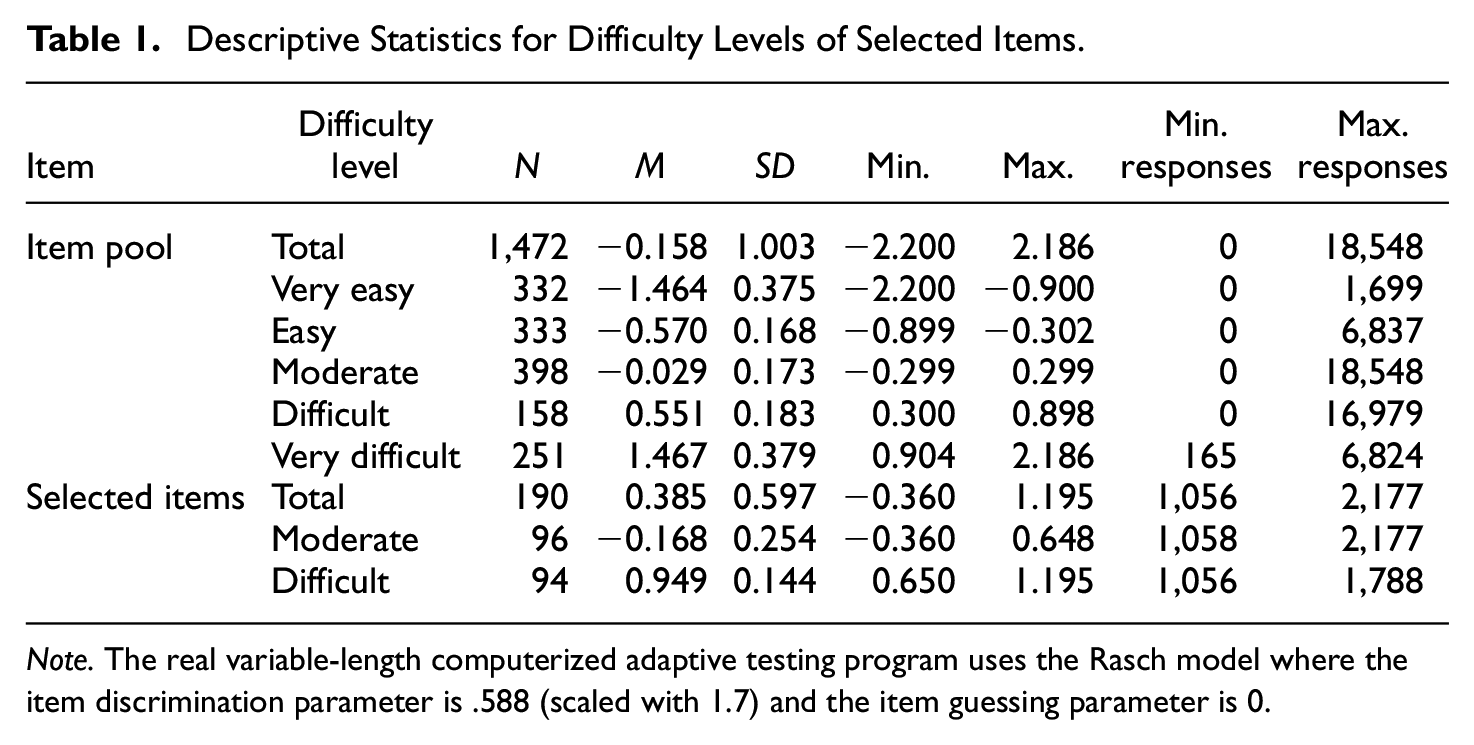
Note. The real variable-length computerized adaptive testing program uses the Rasch model where the item discrimination parameter is .588 (scaled with 1.7) and the item guessing parameter is 0.
Simulation Factors
The simulation factors for this study are summarized as follows:
• Type I error rate (
• monitor starting point (
• moving sample size (
• item difficulty level (
• response change-point (
• increment of probability of correct answer (p-increment): .1, .2, . . ., until the target probability reaches 1.0
The Type I error study used the first three simulation factors: Type I error rates, monitor starting points, and moving sample sizes. The two Type I error rates, .05 and .01, were selected because they are commonly used nominal significance levels in most studies regardless of research area. The three monitor starting points were chosen based on the actual exam administration. For example, about 50% of items in the item pool were administered to about 60, 300, and 500 examinees in 1 day, 1 week, and 2 weeks, respectively. Considering the monitor starting points (
The power studies used all six simulation factors. The fourth factor was item difficulty levels (b): moderate and difficult. The difficulty levels for the 190 selected items ranged between −0.36 and 1.20. According to the criteria used in the real exam practice, each was classified as a moderate or a difficult item. A similar number of items was assigned to all levels.
The fifth factor was the response change-point or the item compromise point (
The last factor was the increment of probability of correct responses (p-increment) after items were compromised. Studies conducted by Zhang (2014) and Zhang and Li (2016) used a fixed probability of respondents answering correctly after items are compromised, such as .8 or .9. Instead, the current study increased the probability by .1 in order to examine the power rates and lag times under different p-increments. This study assumed that, when the CAT is administered with a large item pool, items could be compromised gradually, and compromised items would influence the item response pattern gradually. The p-increment started from .1 and increased until the target proportion equaled 1.0, which means that 100% of respondents answer the compromised item correctly. The p-increment was added to a reference probability of the correct answer. The reference probability was the proportion of correct to total responses before the compromise point. Using the increased probability, responses for the compromised items were generated. For the IRT-based sequential approach, the examinee’s interim ability was calculated by using maximum likelihood estimation as well as the Bayesian approach estimation for extreme response patterns, such as all incorrect answers or all correct answers. For all combined conditions, 20 compromised items were used, which represented about 10% of the 190 items selected for this study. The number of replications for each combination was 100, and the results were averaged over the 100 replications.
When summarizing the results from the power study, this research applied the analysis of variance (ANOVA) and stepwise regression to reduce the number of factors. First, it used a saturated variance model. The response variable was the power rate or lag time, and the covariates were the six factors and sequence procedure methods as well as their first-order interactions. A full model for power rate or lag time was not converged, and the first-order interaction and main factor model still explained well the variance for the power rate (>93%) and lag time (>83%). Next, the study simplified the model by dropping nonsignificant terms at the 5% significance level in terms of the Akaike information criterion (AIC). Finally, it removed simulation factors if their main effects and interaction effects explained less than 1% of the total variance of the power rate or lag time (R2). The “Results” section describes power rates and lag times by using the simulation factors that remained in the final variance model. For the ANOVA test and stepwise regression, it uses R programming (R Core Team, 2020).
Results
Global and Local Thresholds
Table 2 shows the global thresholds and ranges of the local thresholds from the CTT- and IRT-based methods for two Type I error rates (
Global and Local Thresholds for Type I Error Rates (
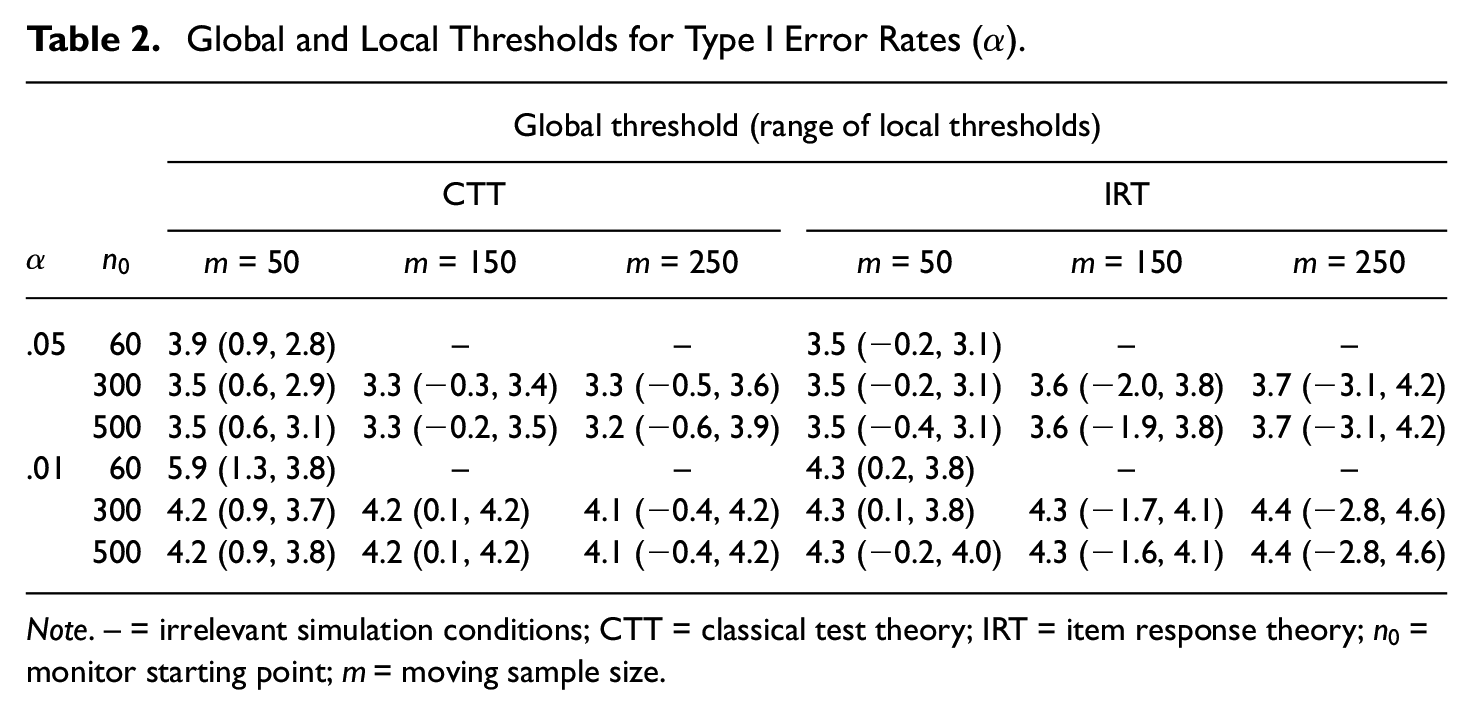
Note. – = irrelevant simulation conditions; CTT = classical test theory; IRT = item response theory;
Overall, the IRT method yielded broader ranges for the local thresholds than did the CTT method regardless of the
Power Study 1: Using the Global Threshold
Power rates
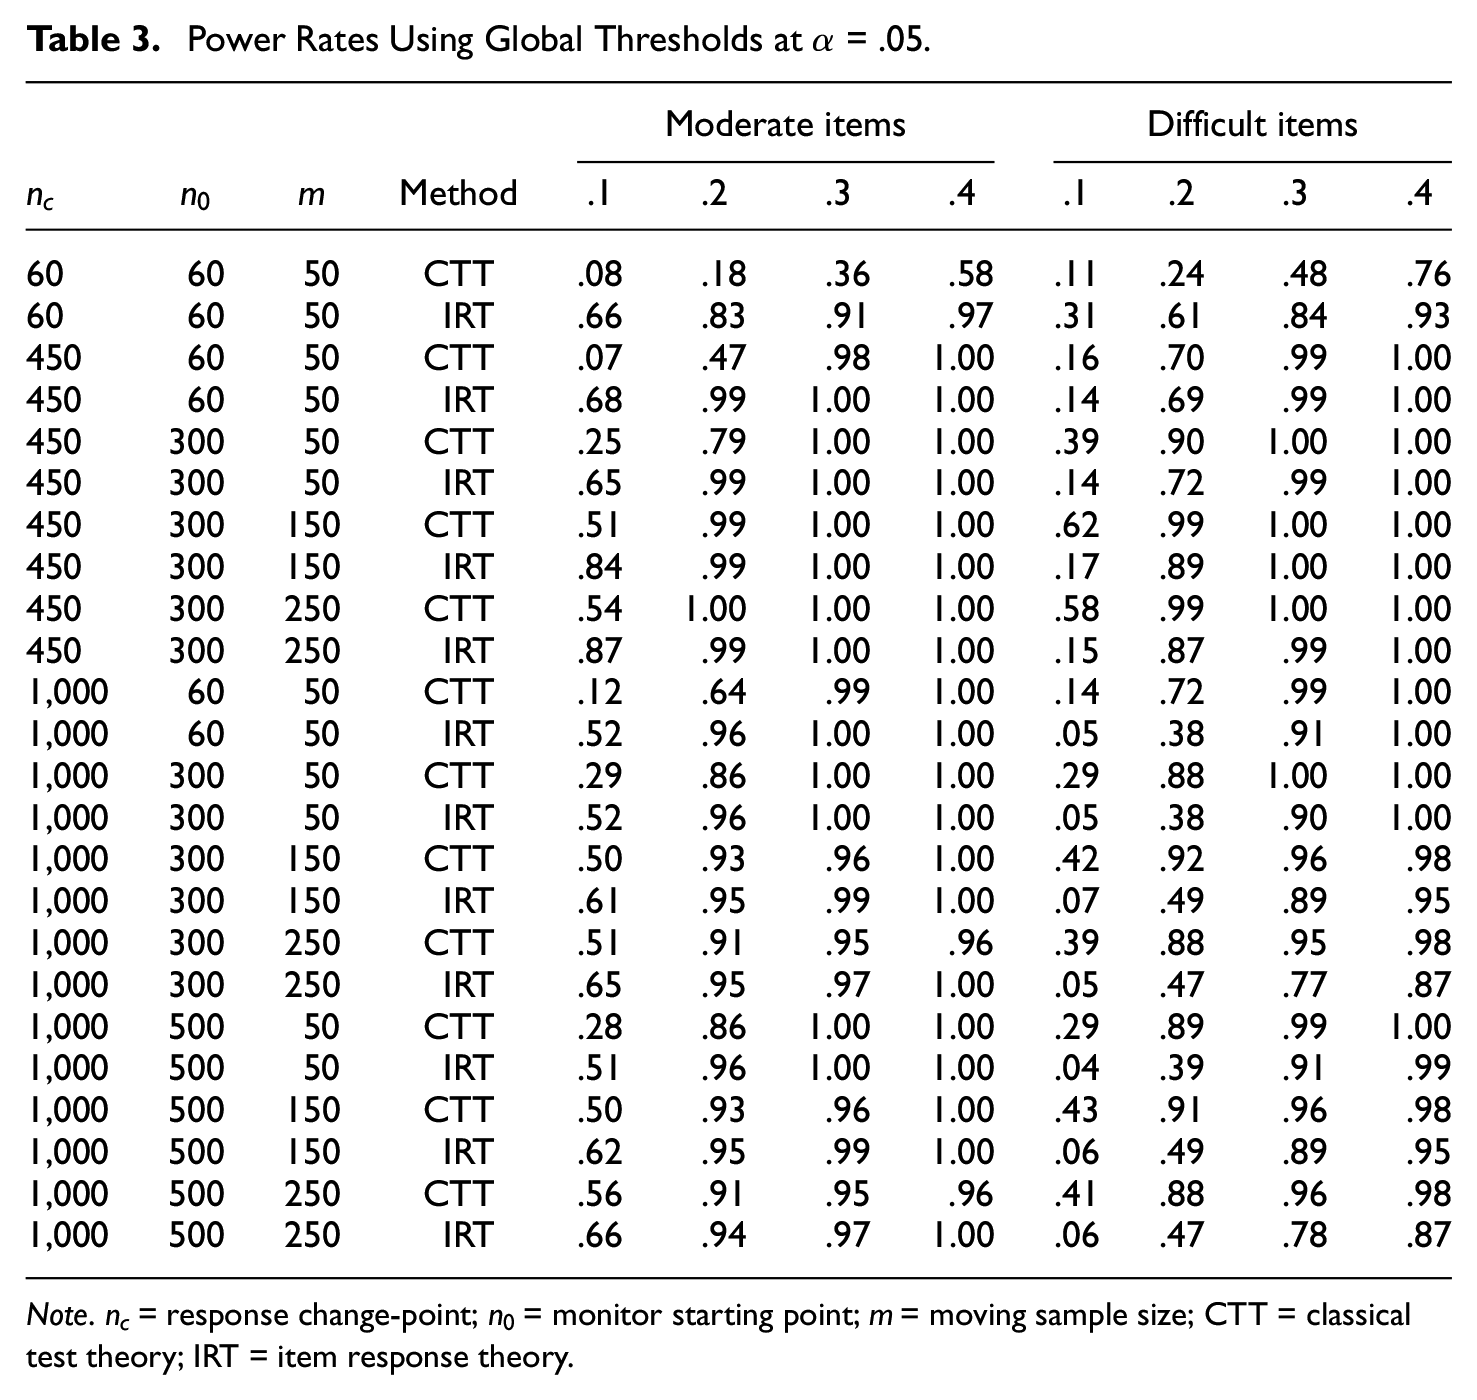
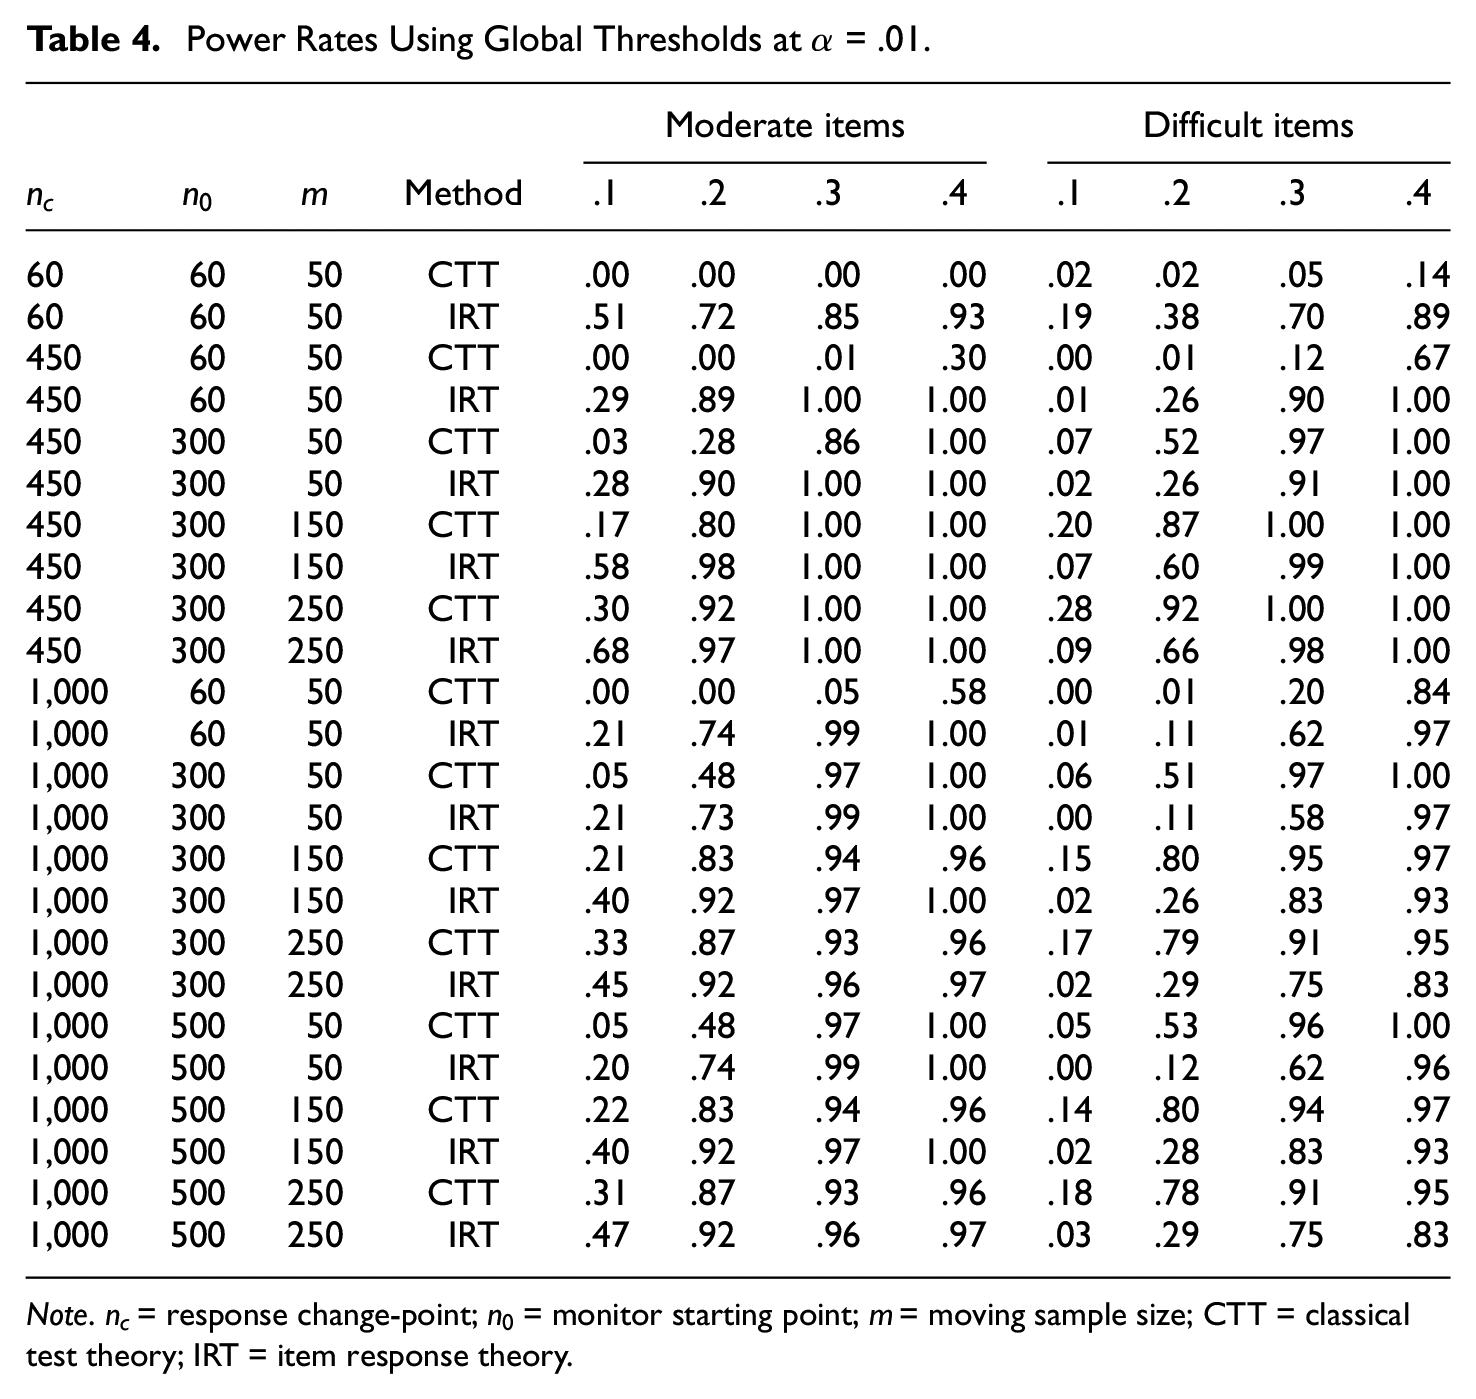
ANOVA analysis and stepwise regression showed that all the simulation factors were important in terms of their significance level and total variance of the power rate explained by each simulation factor. Appendix A summarizes the statistically important interaction- and main-effect terms of the factors. The interaction effects between the p-increment and the other simulation factors were significant for the power rate. Power rates from the two sequential procedures at
Power Rates Using Global Thresholds at
Note.
Power Rates Using Global Thresholds at
Note.
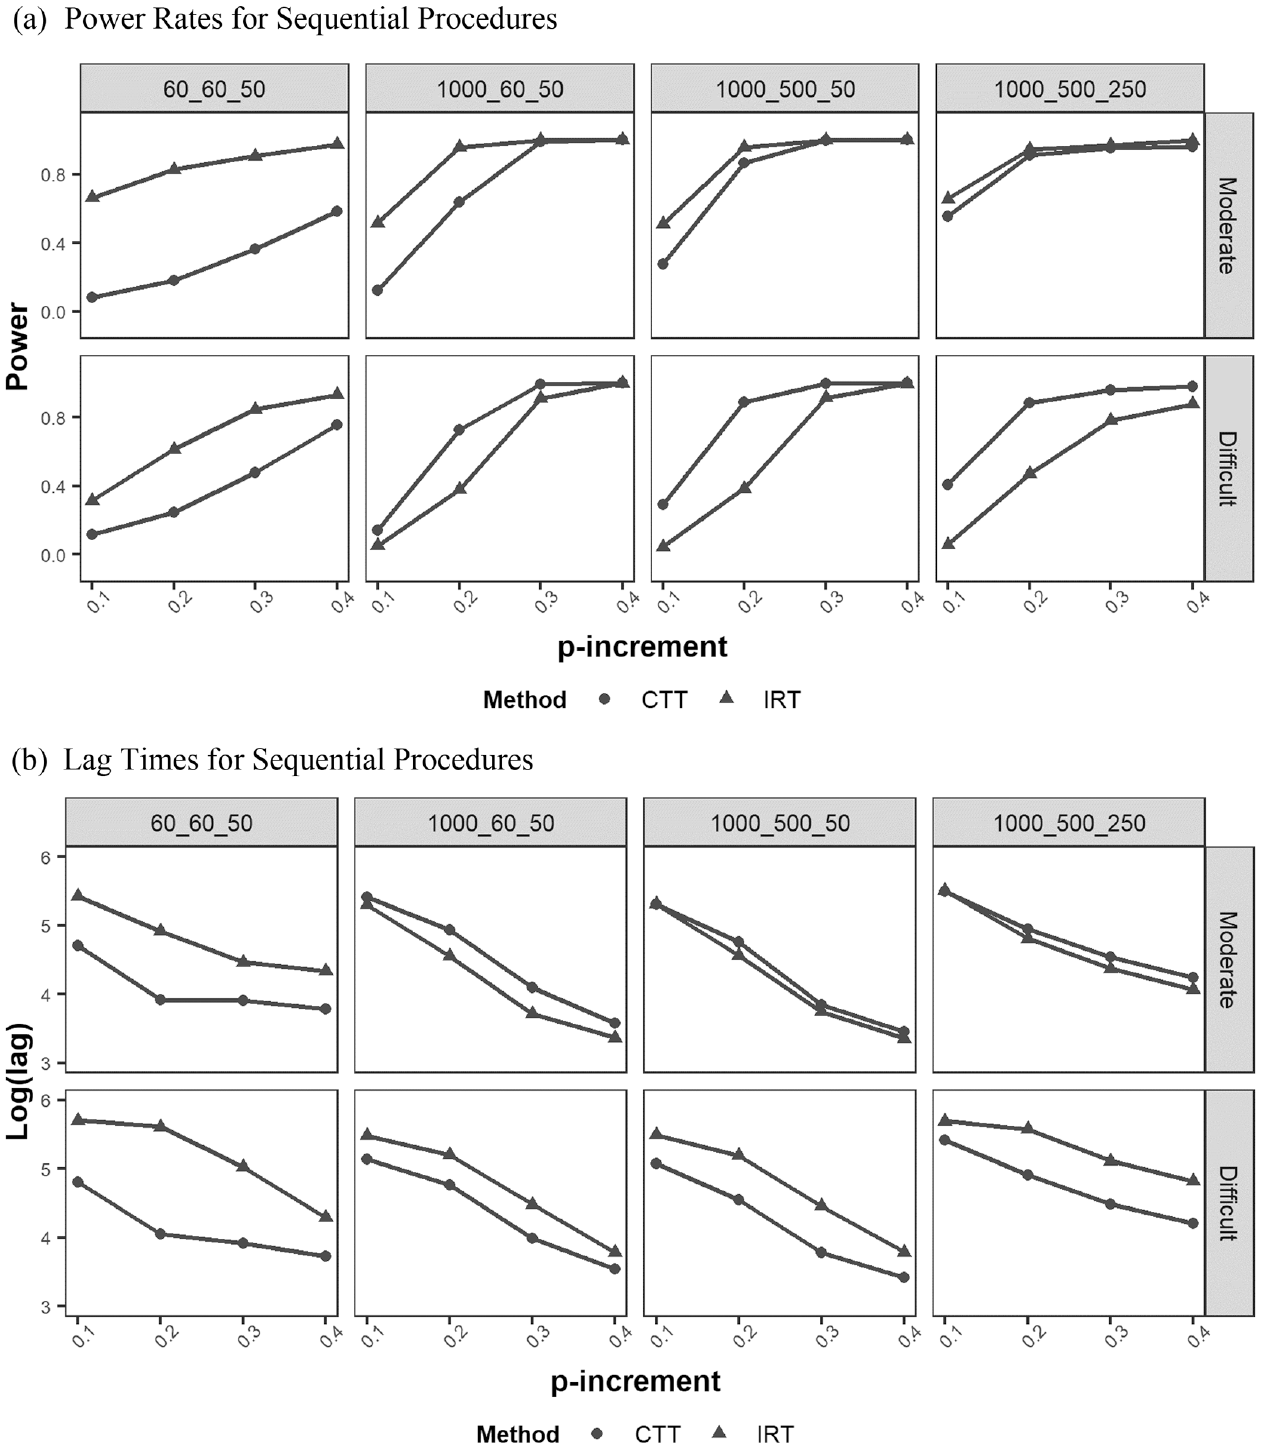
Figure 3a shows power rates over the p-increment for each of the sequential procedures. The first row of panels shows the results for the moderately difficult items while the second row of panels shows the results for the difficult items. For the moderately difficult items, the IRT-based method had higher power rates than the CTT-based method, but the differences between the two methods’ power rates decreased as the p-increment,
Power and lag over p-increments for each of the sequential procedures at
Figure 4a illustrates power rates over the p-increment for each of the combinations of

Power and lag over p-increments for each combination of
Lag times
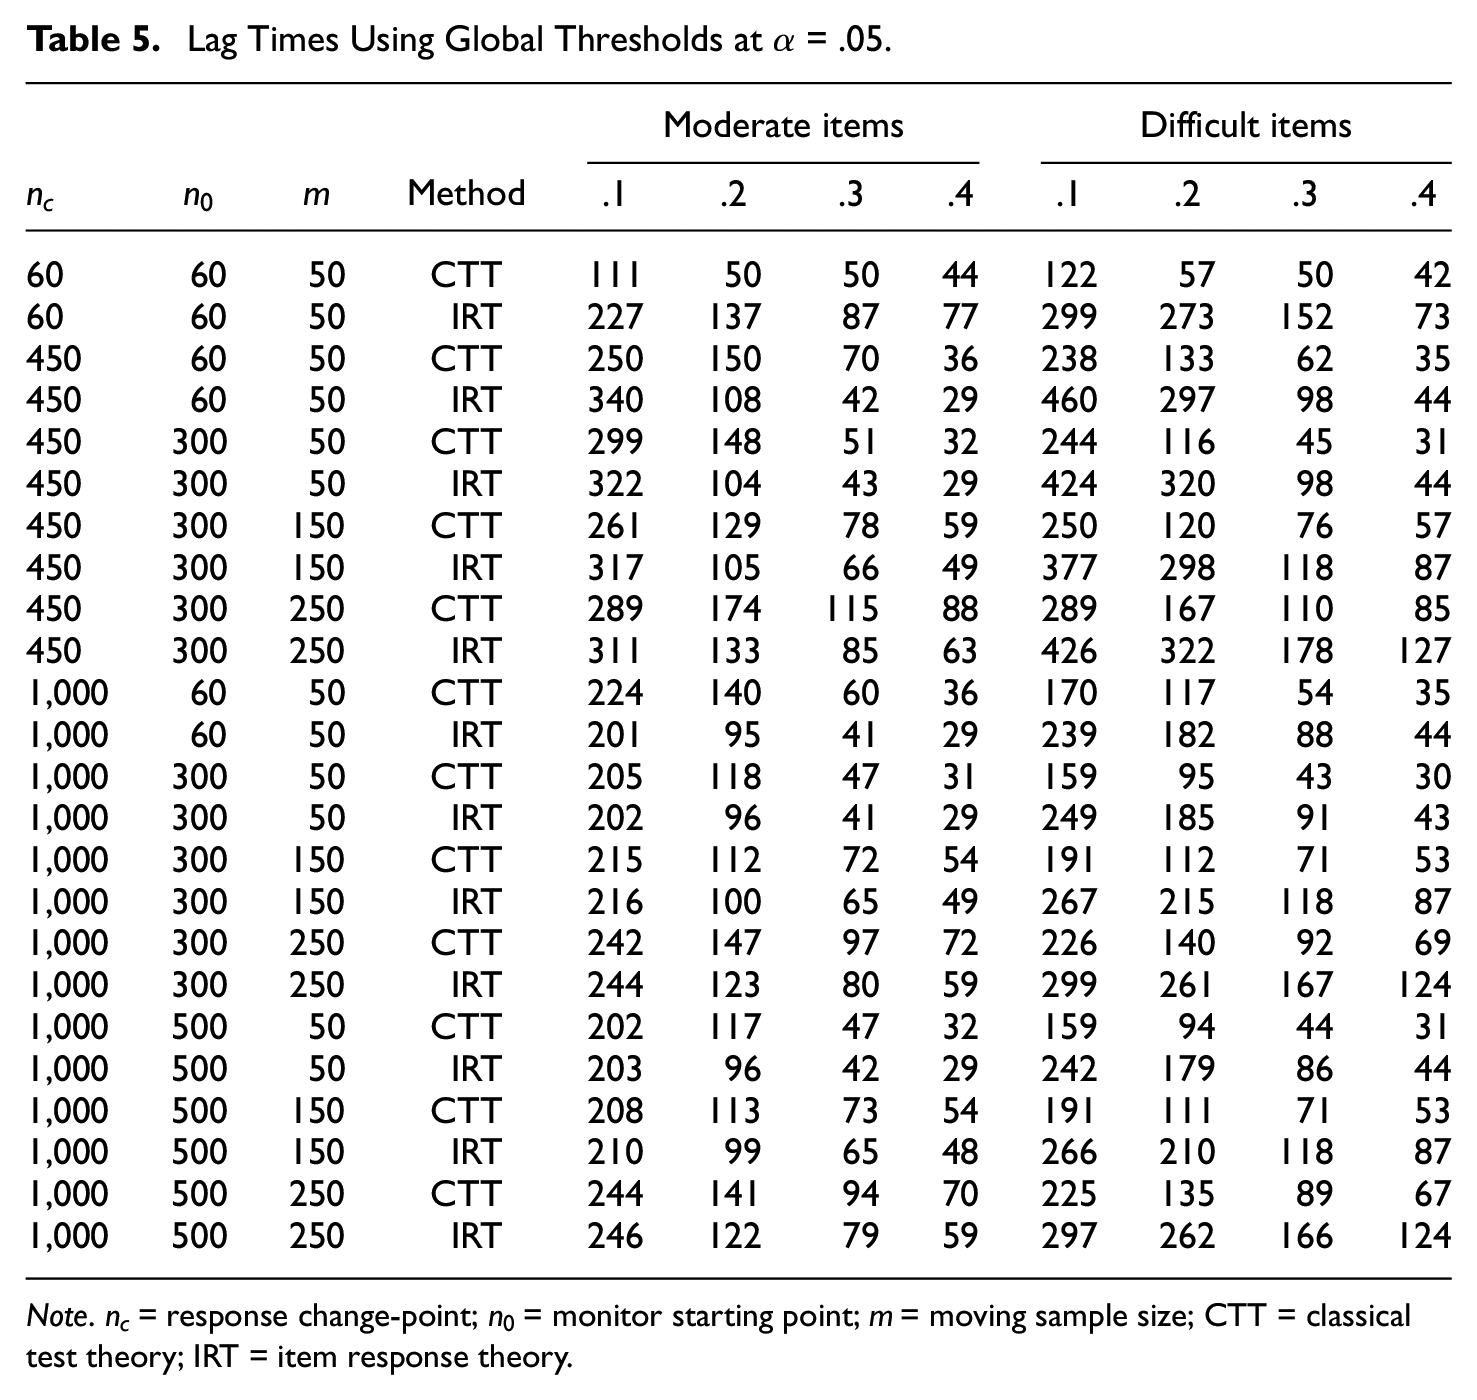
ANOVA analysis and stepwise regression showed that all the simulation factors were important in terms of their significance level and total variance of the lag time explained by each simulation factor. Appendix B summarizes the statistically important interaction- and main-effect terms of the factors. The interaction effects between the p-increment and the other simulation factors were significant for the lag time, just as they were for the power rates. Lag times from the two sequential procedures at
Lag Times Using Global Thresholds at
Note.
Lag Times Using Global Thresholds at

Note. – = power rates of .00. CTT = classical test theory; IRT = item response theory.
Figure 3b presents lag times over the p-increment for each of the sequential procedures. To depict the lag time in plots, lag times were converted to log values. As shown in Figure 3b, the item difficulty levels differently affected the lag times of the sequential methods. For moderately difficult items (see the first row of panels), the CTT method had slightly longer lag times than the IRT method except at
Figure 4b shows the log lag over the p-increment for each of the combinations of
Power Study 2: Using the Local Threshold
Power rates
ANOVA analysis and stepwise regression with two selection criteria—significance levels and the amount of variance explained by each simulation factor—resulted in a simpler model when the local threshold approach was used than when the global threshold approach was used. This occurred because the p-increment became a more dominant factor in the local threshold approach. The interaction effects between the p-increment and
Figure 5a compares power rates between the global and local threshold methods under combinations of three simulation factors (
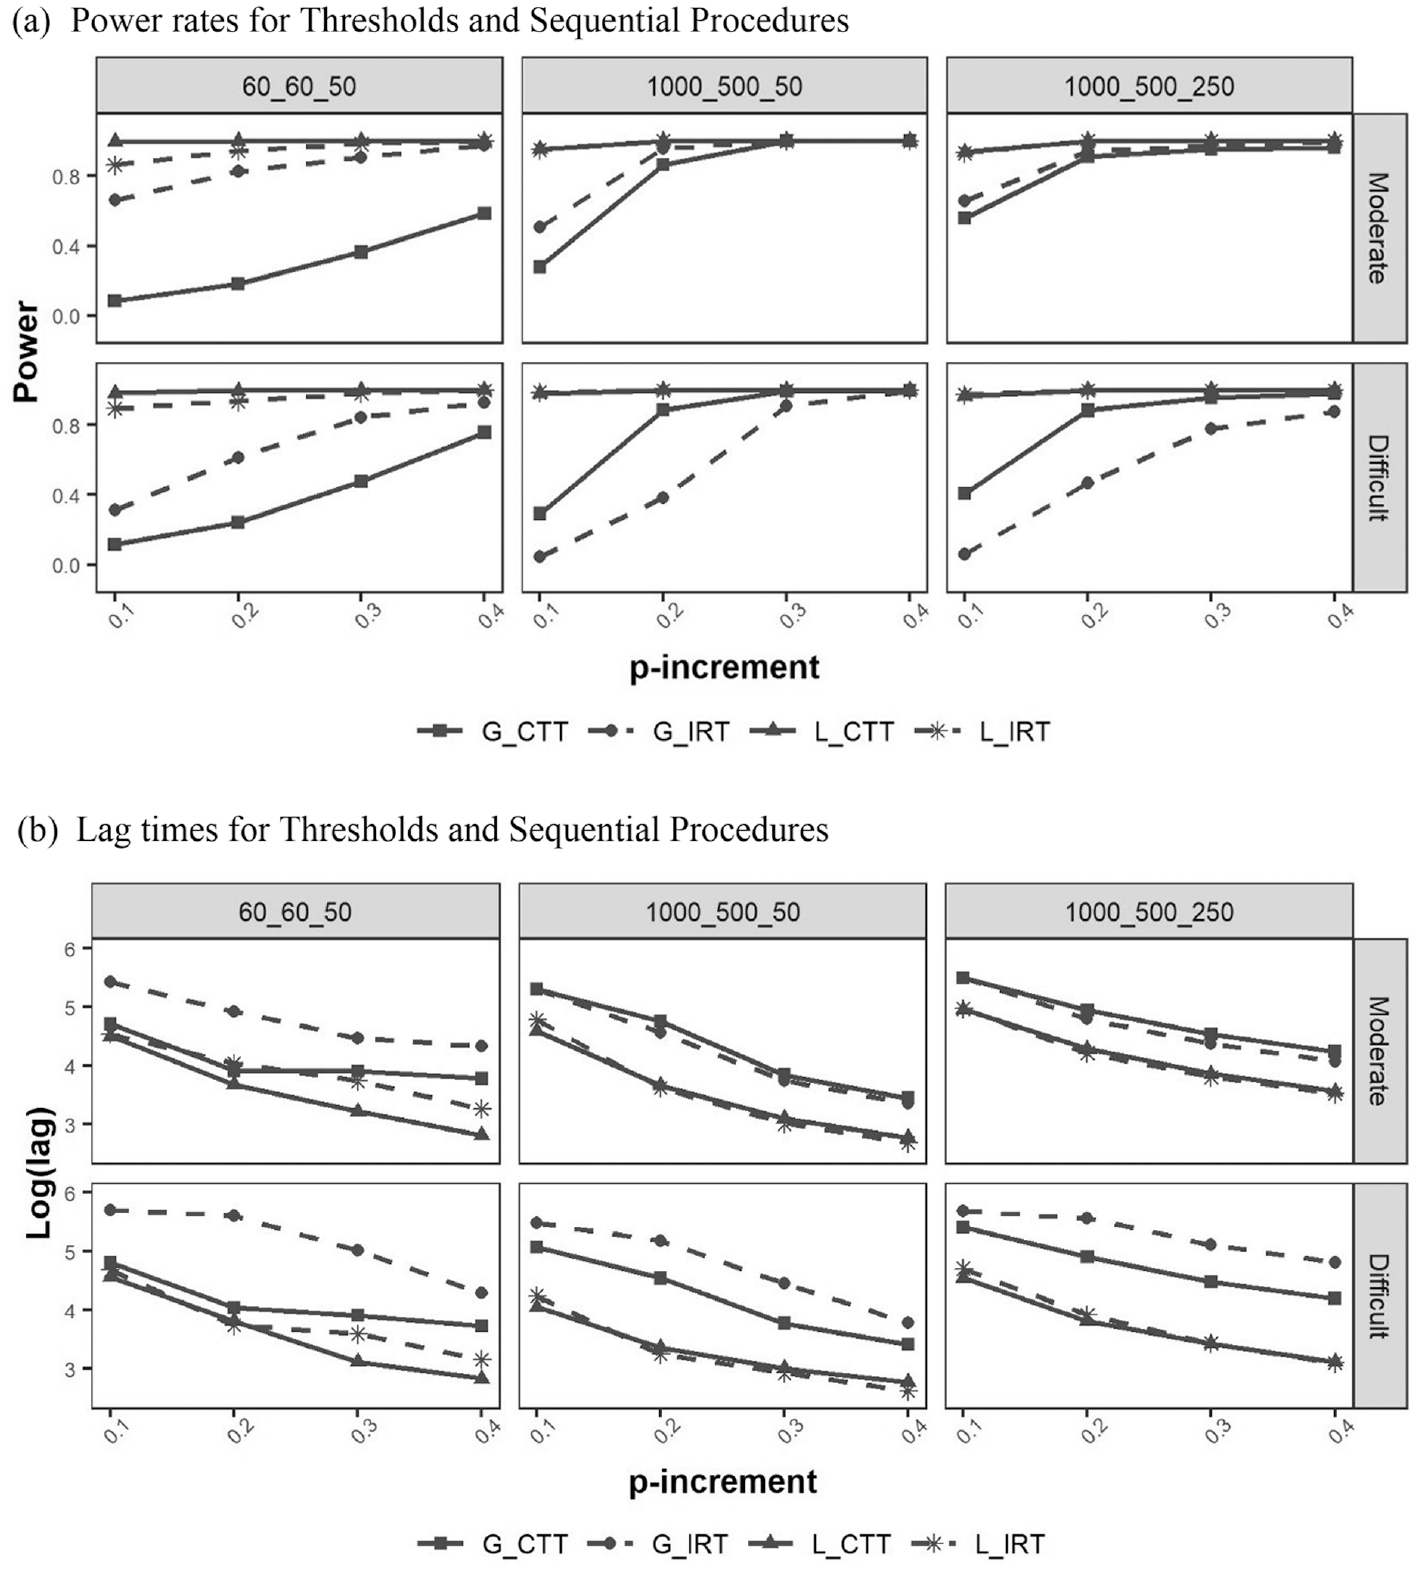
Power and lag over p-increments for thresholds and sequential procedures at
Lag times
ANOVA analysis and stepwise regression showed that the interaction effects between the p-increment and the other simulation factors were significant for lag times, just as they were for power rates. In addition to the interaction effects between the p-increment and the sequential procedures (Method) and between
Case Study
Methods
In addition to the simulation studies, a case study attempted to identify potentially compromised items in the real item pool administered in CAT. It used a real CAT data set from a licensure testing organization. The item pool included 1,472 items administered by using CAT to 69,562 candidates during 3 months in 2015. The number of responses to the items ranged from 0 to 18,548. The mean and the standard deviation (SD) of candidates’ abilities were .30 and .44, respectively. Among 1,472 items, 190 items were selected based on the number of responses generated for the simulation study. The number of responses to the selected items in the real data ranged between 3,109 and 9,505. All the selected items were multiple-choice items, and the item difficulty values ranged between −0.36 and 1.20.
The case study implemented the hybrid threshold method with cutoff points from the Type I error study at
Results
The CTT- and IRT-based procedures flagged 41 and 55 items as compromised, respectively, when the global threshold was used under the conditions of
One of the 12 items flagged by both methods is illustrated in Figure 6. Figure 6a shows the first 2,150 Y and Z statistics from the IRT and CTT procedures, respectively. The item was administered to 7,389 candidates, which indicated that the item’s exposure rate was 10.6% of all examinees in the exam period. The item’s difficulty parameter was −0.21, a moderate level of difficulty in the item pool. The two sequential procedures were applied from the 300th response, generating 7,090 (7,389 − 300 + 1) Y statistics and Z statistics in the IRT and CTT procedures, respectively. When

An example item flagged as compromised by CTT and IRT methods.
As shown in Figure 6a, the IRT method resulted in larger statistics than did the CTT method over the monitoring process. At the 556th response, the two statistics rose above the local threshold for the first time in the monitoring period. Then, between the 561st and 591st responses, the two statistics remained above the local threshold. At this point, the item may be flagged as a potentially compromised item and be monitored for trends in its statistics. In the monitoring process, the two statistics continuously increased and rose above the global threshold between the 1,960th and 1,984th responses. Figure 6b presents those statistics between the 1,970th and the 2,028th responses (59 responses in points). At the 1,970th response, the item was first flagged by the two local thresholds. The statistics of the item continuously increased, rose above the global threshold at the 1,984th response, and remained higher than the global threshold until the 2,004th response. At this point, this item could be masked immediately in the CAT. Suspending the item from delivery through masking would ensure that it would not be administered to any candidates during the following days until conclusive determination of whether the item was compromised.
However, as shown in Figure 6a, the statistics became smaller than the global threshold after the 2,004th response and even below the local thresholds after the 2,008th response. This pattern, characterized by increasing statistics above the local threshold and then decreasing statistics below the local threshold, seemed to recur many times in the examinee sequence until the end of administration, regardless of the sequence method. However, the Z statistics were not higher than the global threshold after the 2,004th response. The other 11 items flagged by the two methods in the case study showed similar patterns.
For further investigation, the 12 flagged items were sent to the test development content review team, which found no evidence of item compromise. In addition, examination of the candidates’ possible association factors at the change-points found, concerning the flagged items, no common factor among the candidates.
Discussion
The goal of this research was threefold: (1) applying sequential procedures to a variable-length CAT to find significant factors that contribute to their power rates and lag times, (2) proposing a local threshold approach for sequential procedures, and (3) suggesting a hybrid threshold approach to apply the sequential procedures to a real item pool.
The first goal of this research was to apply the CTT- and IRT-based sequential procedures to a real licensure exam in a variable-length CAT under various simulation factors, and it accomplished this goal by using the global threshold approach. This study showed that the two sequential procedures performed differently with some simulation factors when the p-increment was small. The CTT-based procedure had higher power rates and shorter lag times as the monitor starting point and change-point increased. In contrast, the IRT-based procedure had higher power rates and shorter lag times as the change-point increased, but its power rates and lag times remained relatively constant as the monitor starting point increased. Both procedures had shorter lag times and higher power rates as the moving sample size increased from 50 to 150. However, as the moving sample size increased from 150 to 250, power rates remained similar or decreased. Overall, the IRT procedure seemed to be more sensitive than the CTT procedure, and it flagged more items as compromised. The case study also indicated that the IRT method seemed more sensitive for moderately difficult items than for difficult items. As this study illustrated, one sequential procedure could perform better than the other under some conditions, but not under all. Hence, identifying items by using both sequential procedures flags a reasonable number of items.
Of the factors used in this study, the p-increment was the most important for the sequential procedure to detect compromised items in terms of the power rate and lag time. For example, if the p-increment was at least .3 at
To resolve these problems, another goal of this study was to propose a local threshold approach. This approach involves increasing the detection power rate when the p-increment is small, which can be more reasonable in real CAT tests. The simulation result showed that the local threshold approach was promising for detecting compromised items when the p-increment was small. When the p-increment was .1 or .2, the power rates using the local threshold were improved significantly, and the lag time was shortened. In practice, however, it would not be easy to determine whether the small increase in the statistics of the sequential procedure was from true item compromise or from false detection. In addition, the case study demonstrated that the statistics became higher than, and then lower than, the local threshold many times in the response sequence of each item.
Therefore, the current study suggested a hybrid threshold approach. The hybrid threshold approach can use the local threshold to expose a potentially compromised item in an early stage of the CAT administration and to monitor trends in item response functions until the item is flagged by the global threshold. If a reasonable number of statistics lie above the defined global threshold for an item, immediately masking the item ensures that the item will not be seen by any candidates until an item content review panel determines whether the item is compromised or not. In practice, it would be much easier to mask potentially compromised items than to detect and punish possible cheaters because psychometric evidence may not be sufficient to prove that examinees’ behavior is aberrant. Based on the global threshold, it can be beneficial to investigate candidates and see whether they had any factors in common, such as school, testing center, or city, although these factors may have decreased in significance due to the development of social media. If evidence suggests associations between candidates or supports the possibility of collusion, the item can be indicated as compromised and its administration can stop.
This study found that the sequential procedures using the hybrid approach can be implemented in real time. Before implementing these procedures, users should select a monitor starting point and a moving sample size (e.g., the 300th response and 50 responses, respectively). In addition, the global and local thresholds should be determined by their own CAT algorithms for administered items. Then the procedure using the hybrid approach can be applied to items after they have been administered to 300 test-takers and can monitor items on each day’s responses.
This study had some limitations that future research can investigate. First, using different item characteristics and CAT algorithms may result in different outcomes from those found in this study because the global and local thresholds depend heavily on items’ characteristics and the CAT algorithm. Such a study would attract more researchers to conduct studies on sequential procedures in other CAT algorithms. Second, the current study utilized the Rasch model and showed that the sequential procedure performed differently at varying difficulty levels. Examining the global threshold approach for subsets of items according to those items’ characteristics in different IRT models (e.g., 2PL [two-parameter logistic] or 3PL IRT model) would be another potential topic for future research.
This research demonstrated that the CTT- and IRT-based sequential procedures using the hybrid threshold approach can be applied to a variable-length CAT in real time. Because the licensure exam used in this study follows the standard item development process (American Educational Research Association, American Psychological Association, & National Council on Measurement in Education, 2014) and is administered to more than 60,000 candidates in every quarter, the study presented a potential application of the sequential procedures by using the hybrid threshold approach to any CAT-based exam. In addition, the findings of this study can provide test developers and stakeholders with helpful guidelines for using the sequential procedures to detect compromised items administered in CAT. Moreover, the hybrid threshold approach can resolve the problems from the local and global thresholds. The approach improved power rates and lag times in an early stage of item administration and controlled Type I error rates in the decision-making stage.
Footnotes
Appendix
Lag Times based on the Local Threshold at α = .01

| Moderate Items | Difficult Items | ||||||||||
|---|---|---|---|---|---|---|---|---|---|---|---|
| n c | n 0 | m | Method | .1 | .2 | .3 | .4 | .1 | .2 | .3 | .4 |
| 60 | 60 | 50 | CTT | 195 | 101 | 52 | 32 | 207 | 94 | 43 | 25 |
| 60 | 60 | 50 | IRT | 129 | 83 | 50 | 42 | 174 | 64 | 47 | 31 |
| 450 | 60 | 50 | CTT | 146 | 47 | 28 | 21 | 150 | 55 | 29 | 21 |
| 450 | 60 | 50 | IRT | 151 | 46 | 26 | 19 | 157 | 53 | 29 | 21 |
| 450 | 300 | 50 | CTT | 142 | 46 | 27 | 20 | 138 | 50 | 27 | 21 |
| 450 | 300 | 50 | IRT | 143 | 46 | 26 | 19 | 140 | 48 | 27 | 21 |
| 450 | 300 | 150 | CTT | 163 | 72 | 49 | 38 | 145 | 68 | 48 | 37 |
| 450 | 300 | 150 | IRT | 176 | 68 | 45 | 33 | 144 | 64 | 44 | 34 |
| 450 | 300 | 250 | CTT | 196 | 98 | 66 | 51 | 172 | 87 | 62 | 50 |
| 450 | 300 | 250 | IRT | 185 | 85 | 54 | 41 | 173 | 79 | 53 | 40 |
| 1000 | 60 | 50 | CTT | 113 | 43 | 22 | 17 | 120 | 59 | 28 | 18 |
| 1000 | 60 | 50 | IRT | 122 | 50 | 26 | 20 | 148 | 64 | 31 | 21 |
| 1000 | 300 | 50 | CTT | 97 | 41 | 23 | 18 | 91 | 45 | 25 | 17 |
| 1000 | 300 | 50 | IRT | 119 | 50 | 27 | 20 | 106 | 43 | 24 | 17 |
| 1000 | 300 | 150 | CTT | 142 | 60 | 41 | 31 | 127 | 57 | 35 | 24 |
| 1000 | 300 | 150 | IRT | 169 | 66 | 44 | 33 | 124 | 52 | 31 | 23 |
| 1000 | 300 | 250 | CTT | 177 | 85 | 57 | 41 | 135 | 64 | 41 | 30 |
| 1000 | 300 | 250 | IRT | 191 | 84 | 56 | 41 | 130 | 61 | 38 | 27 |
| 1000 | 500 | 50 | CTT | 123 | 46 | 26 | 18 | 98 | 41 | 25 | 18 |
| 1000 | 500 | 50 | IRT | 124 | 46 | 26 | 18 | 104 | 42 | 25 | 18 |
| 1000 | 500 | 150 | CTT | 139 | 62 | 40 | 30 | 116 | 57 | 36 | 25 |
| 1000 | 500 | 150 | IRT | 159 | 67 | 43 | 31 | 111 | 53 | 33 | 23 |
| 1000 | 500 | 250 | CTT | 168 | 82 | 55 | 41 | 127 | 60 | 39 | 29 |
| 1000 | 500 | 250 | IRT | 187 | 83 | 54 | 40 | 126 | 58 | 36 | 26 |
Note. n c = response change-point, n0 = monitor starting point, and m = moving sample size.
Acknowledgements
We thank Dr. Marcoulides and two anonymous reviewers for their helpful comments and suggestions. Also, we thank Jennifer Pretzer whose support helped improve and clarify this manuscript.
Declaration of Conflicting Interests
The authors declared no potential conflicts of interest with respect to the research, authorship, and/or publication of this article.
Funding
The authors received no financial support for the research, authorship, and/or publication of this article.