
Abstract
Proposed is a new method of standard setting referred to as response vector for mastery (RVM) method. Under the RVM method, the task of panelists that participate in the standard setting process does not involve conceptualization of a borderline examinee and probability judgments as it is the case with the Angoff and bookmark methods. Also, the RVM-based computation of a cut-score is not based on a single item (e.g., marked in an ordered item booklet) but, instead, on a response vector (1/0 scores) on items and their parameters calibrated in item response theory or under the recently developed D-scoring method. Illustrations with hypothetical and real-data scenarios of standard setting are provided and methodological aspects of the RVM method are discussed.
Introduction
The standard setting is a complex process of establishing cut-scores on assessment scales to classify examinees into two groups (e.g., mastery/nonmastery) or more than two groups (e.g., below basic, basic, proficient, and advanced). The derivation of cut-scores is based on judgments of content experts (panelists) guided by the methodology of the selected standard setting method. There is a variety of standard-setting approaches, with most popular to date being the Angoff’s (1971) method (e.g., Clauser et al., 2006; Hambleton, 2001; Hambleton & Plake, 1995; Plake & Cizek, 2012), and the bookmark method (Lewis et al., 1999; Mitzel et al., 2001; see also Cizek et al., 2004; Karantonis & Sireci, 2006; Lin, 2006). Other methods of standard setting are, for example, the mapmark method (Schulz & Mitzel, 2005, 2011), item-mapping method (Wang, 2003), body of work method (Cizek & Bunch, 2007; Hambleton & Pitoniak, 2006; Wyse et al., 2014), item-descriptor (ID) method (Ferrara et al., 2008; Ferrara & Lewis, 2012), benchmark method (Phillips, 2012), and other (e.g., Zwick et al., 2001).
The ongoing efforts for improving existing methods of standard setting and developing new ones are motivated, in general, by the need to address problems related to consistency and accuracy of cut-scores produced by such methods and the validity of examinees’ classifications into targeted levels of performance. Furthermore, there is no single (“best”) approach to setting standards for a variety of assessment scenarios and policy guidelines. Without engaging into a comprehensive overview of existing methods of standard setting and related problems, provided next is a brief description and comments on the widely used Angoff’s (1971) and bookmark methods, as well as the relatively new ID matching method, to highlight issues addressed with the proposed response vector for mastery (RVM) method of standard setting.
Angoff Method
Under the Angoff (1971) method and its modifications, content experts (panelists) are required to conceptualize the minimally proficient (borderline) examinee―the examinee whose proficiency level is just high enough to justify a given classification (e.g., see Cizek & Bunch, 2007). Then the panelists are asked to review each test item and estimate the probability with which the borderline examinee would answer correctly the item. The sum of such probabilities over the test items is an estimate of the true score for the borderline examinee, which is then mapped on the test characteristic curve to obtain the cut-score (“theta”) on the item response theory (IRT) logit scale. Main problems with this method are (a) the panelists’ error-prone conceptualizations of a borderline examinee and (b) probability judgments for correct response on each test item by the borderline examinee. As noted by Berk (1986), “judges have the sense that they are pulling the probabilities from thin air” (p. 147) (see Chang, 1999; Ricker, 2006; van der Linden, 1982).
Bookmark Method
Under the bookmark method, the test items are sorted by increasing difficulty in an ordered item booklet (OIB), and the panelists are asked to place a bookmark at the point between the items in the booklet at which the probability of correct response by the borderline examinee drops below a prespecified value referred to as response probability (RP). Most frequently used is RP = .67 (denoted RP67), that is, 67% (or 2/3) chances of correct item response (e.g., Huynh, 1998, 2006), but other RPs (e.g., .50 and .80) have also been used (e.g., Beretvas, 2004; Wang, 2003). The cut-score is the point on the IRT scale that corresponds to the selected RP of a correct response for the item located just before the bookmark; (in some cases, the cut-score is set equal to the midpoint between the bookmarked item and the previous item).
Although the bookmark method is considered a better alternative to the Angoff’s (1971) method and its variants, there are serious doubts about the conceptualization of key concepts and understanding of the bookmark procedure by participating panelists (e.g., Baldwin, 2018; Davis-Becker et al., 2011; Ferrara & Lewis, 2012; Lewis et al., 1999; Lewis et al., 2012; Skaggs & Tessema, 2001; Williams & Schulz, 2005; Zieky, 2001). Main problems with the bookmark method relate to the conceptualization of the borderline examinee, the choice of a RP value, the probability judgment for placing the bookmark, item disordinality, and restricted focus on item difficulty. Provided next are brief details in this regard.
Conceptualizing the Borderline Examinee
As with the Angoff method, a major validity hurdle with the bookmark method is the proper and consistent conceptualization of the borderline examinee by the panelists. There is no persuasive research evidence on the panelists’ ability to create a valid mental model of the borderline examinee at the training stage (or other rounds) of the bookmark procedure. The bookmark approach to this task is challenged by researchers seeking for alternative solutions, such as the ID matching method (Ferrara et al., 2008; Ferrara & Lewis, 2012).
The RP Choice
Research on the bookmark method shows that the choice of RP values (e.g., .67, .50, or .80) systematically affects the resulting cut-score (e.g., Baldwin, 2018; Baldwin et al., 2019; Beretvas, 2004; Hauser et al., 2005; Lewis et al., 2012; Williams & Schulz, 2005; Wyse, 2011). For example, in a study using three RP values (1/2, 2/3, and 4/5), Beretvas (2004) found that the ordering of the bookmark difficulty locations changes depending on the RP used. In a different study, investigating the destabilizing role of the RP choice, Baldwin (2018) noted that “the implications of these findings are alarming—after all, if panelists are unable to adjust their judgments to reflect the choice of RP, what do their judgments actually mean?” (p. 483). Also, based on rigorous analytic derivations in that study, he demonstrated that “the often-repeated claim that the .67 [RP] value corresponds with the maximum information for a correct response, which is believed to be beneficial in some way, is mistaken” (Baldwin, 2018, p. 481).
Item Disordinality
The term item disordinality refers to the disagreement among bookmark panelists on the order of items within the OIB (e.g., Lewis & Green, 1997; Skaggs & Tessema, 2001). Such a disagreement typically occurs when the panelists differ in education curricula and/or judgments on item difficulty. Item disordinality is particularly problematic when it occurs near the cut-scores produced by individual panelists. As noted by Lewis and Green (1997), item disordinality issues arise in virtually all applications of the bookmark method. In another study, Davis-Becker et al. (2011) compared cut-score results of experts using OIBs with results of experts placing bookmarks in test forms where the items were randomly ordered by difficulty, and they found similar recommendations on cut-scores under both conditions.
Narrow Focus on Item Difficulty
The bookmark panelists focus on item difficulty to mark an item within the OIB. As noted by Zieky (2001), “this does not allow participants to distinguish purposefully among the items above the bookmark, or among the items below the bookmark on the basis of importance, curricular relevance, or necessity for performance on the job” (p. 35). This issue, not fully addressed in the extant research on the bookmark method, has negative affect on the substantive meaning of the cut-score―that is, the cut-score do not reflect adequately the substantive structure of the dimension(s) measured by the test.
ID Matching Method
The ID matching method (Ferrara et al., 2008; Ferrara & Lewis, 2012; see also Cizek & Bunch, 2007) involves three key elements―OIB, item response demands (IRDs), and performance level descriptors (PLDs). Specifically, (a) the OIB contains all test items sorted from the easiest to the most difficult based on IRT scale location, just like under the bookmark method; (b) the IRDs of an item represent the content knowledge, skills, and cognitive processes required by the item; and (c) the PLDs describe the knowledge and skills that the examinees in a particular performance level are expected to be able to demonstrate (Ferrara et al., 2008; Lewis & Green, 1997; Perie, 2008).
Under the ID matching, the panelists match the IRDs of each item and the PLDs. This results in (a) one sequence of items that most closely match the PLDs in a given performance level, (b) another sequence of items that match the PLDs of the next (higher) performance level, and (c) a “threshold region” with items that do not match clearly either of the PLDs of the two adjacent performance levels. The cut-score is located between the scale values of the first and last items in the threshold region. Typically, the cut-score is obtained (a) by asking the panelists to identify the first item in the sequence of items in the threshold region whose IRDs match more closely the PLDs of the higher performance level and use the scale value of this item as a cut-score or (b) computing the cut-score as the midpoint between the scale locations of the first and last item in the threshold region (e.g., Ferrara & Lewis, 2012).
Unlike the bookmark method, the ID matching does not require panelists to conceptualize a borderline examinee and make probability judgments (e.g., using RP67). As stated by Ferrara et al. (2008), This simplifies the cognitive complexity of the panelists’ judgmental task, relative to the Bookmark method. In ID Matching, panelists can focus on matching the knowledge and skill requirements of each item to the knowledge and skills articulated in performance level descriptors. (p. 2)
Response Vector for Mastery Method of Standard Setting
Motivation of the RVM Method
Along with the advantages of the ID matching over the bookmark, some problems remain under both methods. Specifically, the location of cut-scores on the IRT scale under both the bookmark and ID matching methods is affected by (a) the RP-based item ordering in the OIB, as described earlier and (b) their dependence on a single test item, whereas the estimation of ability scores in IRT is based on the likelihood of response vectors of binary (1 or 0) scores on all test items.
The proposed RVM method is designed to (a) free the panelists from psychometric conceptualizations and judgments, (b) avoid the use of OIB and related problems, (c) produce cut-scores based on response vectors of item scores (1/0), instead of using a single OIB item, and (d) produce cut-scores on the IRT scale and (if needed) on the D-scale of a recently developed “delta-scoring” (D-scoring) method (DSM; Dimitrov, 2016, 2018, 2020; Dimitrov & Atanasov, 2021). The DSM is used, for example, with large-scale assessments by the National Center for Assessment (NCA) in Saudi Arabia. The proposed RVM method has been already used for deriving cut-scores on the D-scale for teacher licensure tests (Dimitrov & Alsadaawi, 2019) and multiple cognitive ability tests (Dimitrov et al., 2020) in Saudi Arabia.
The remainder of this article is organized as follows. First, provided is a brief description of the DSM and its D-scale. Second, the proposed RVM method of standard setting is described and illustrated with computations of cut-scores on the D-scale and the IRT logit scale. Third, summary comments, limitations, and recommendations for future research on the RVM method are provided in the discussion part.
D-Scoring Method
The DSM is developed in a classical framework (DSM-C; Dimitrov 2016, 2018, 2020) and latent framework (DSM-L; Dimitrov & Atanasov, 2021). The DSM-C and DSM-L share the same D-scale, which ranges from 0 to 1, with D = 0 when all test items are answered incorrectly and D = 1 when all items are answered correctly. Also, the DSM-C and DSM-L share the same analytic expression for item response functions (IRFs) on the D-scale, but differ in approaches to the estimation of item and person parameters.
IRF on the D-Scale
A key feature of the DSM (classical and latent versions) is the two-parameter rational function model (RFM2) which is used to obtain IRFs on the D-scale (Dimitrov, 2020). The analytic form of RFM2 is
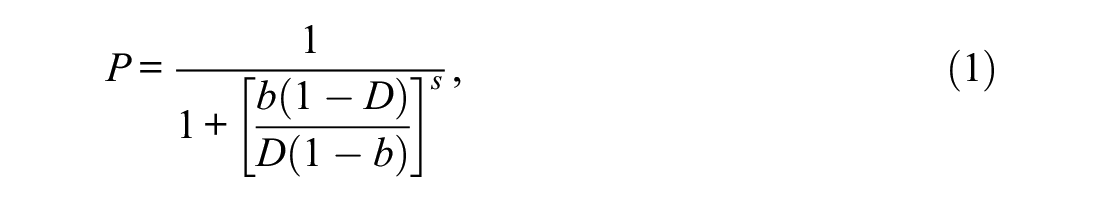
where P is the probability of correct item response, D is the person’s test score on the D-scale (from 0 to 1), b is the item location on the D-scale (i.e., the location where the probability of correct item response is 0.5), and s is a fit parameter for shape. The item discrimination, a, is obtained “post hoc” as a function of the parameters b and s as follows (see Dimitrov, 2020).

The RFM2 model can be reduced to a one-parameter model (RFM1) by fixing s = 1 in Equation 2 or extended to a three-parameter model (RFM3) by introducing a pseudo-guessing parameter, c, as it is done in IRT (e.g., Hambleton et al., 1991).
DSM-C
Under the DSM-C, Equation 1 is treated as a classical nonlinear regression where the person’s score D (computed a priori) is used as a predictor of the item score (1 or 0), whereas the item parameters b and s are estimated as regression coefficients. Specifically, the D-score is based on the examinee’s response vector of (1/0) item scores weighted by the expected item difficulties,
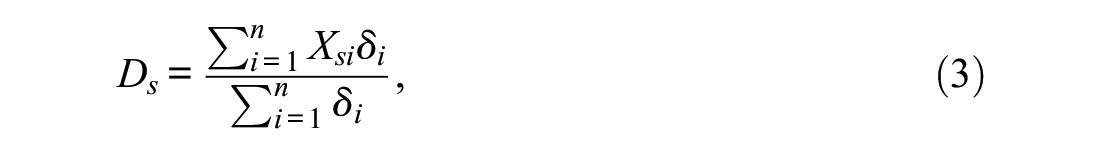
where
DSM-L
Under the latent DSM-L, Equation 1 is treated as a latent (IRT-like) model where the D-scores are not known in advance but, instead, estimated along with the item parameters b and s using a maximum-likelihood method (e.g., Dimitrov & Atanasov, 2021) or other methods, such as the Markov Chain Monte Carlo estimation method (e.g., Sheng, 2008).
As a side note, as shown by Robitzsch (2021), the latent RFM2 model in Equation 1 is theoretically equivalent (at population level) to the two-parameter logistic (2PL) model in IRT (e.g., Hambleton et al., 1991) bounded to the scale interval [0-1]; (at sample level, however, the 2PL realization of the RFM2 is complicated by practically inconvenient restrictions).
RVM Method of Standard Setting
The RVM method is aligned with the conception according to which, as stated by Ferrara and Lewis (2012), “panelists are expected to develop a shared understanding of the cognitive requirements associated with a given method’s cognitive judgmental task so that each panelist can make independent judgments with a common frame of reference” (p. 263).
Under the RVM method, the cognitive judgmental task for the panelists is not performed for ordered items in a OIB, as this is done under the bookmark and ID matching methods but, instead, for items grouped into response vector units (RVUs) on substantive basis.
Response Vector Units
Along with avoiding issues with the OIB, described earlier, grouping the items into RVUs preserves the substantive structure of the test. This is important because the items of standardized tests are usually grouped into domains, subdomains, and so on. For example, the items of an operational test, used for licensure of teachers in Saudi Arabia, are associated with three content domains and further grouped by teaching standards within each domain. To illustrate, the items associated with the domain “professional practice” are grouped into three teaching standards―(a) planning and implementing teaching, (b) creating interactive and supportive learning environments for learners, and (c) assessment. In this case, 10 teaching standards in the content domains were used as RVUs in RVM-based computations of cut-scores for mastery by standards, domains, and the entire test (Dimitrov & Alsadaawi, 2019).
RVM Cognitive Judgmental Task
For each RVU, the panelists are asked to mark the items that they consider as sufficient (if answered correctly) for mastering the respective unit. This task requires matching of IRDs and PLDs like in the ID matching method, but the matching is performed on substantively grouped items in a RVU, instead of individual items in a OIB. Of course, the validity of a RVM produced by panelists depends on the clarity and completeness of the IRDs and PLDs―a critical condition for the quality of any standard setting method (e.g., see Egan et al., 2009; Ferrara et al., 2009; Mills & Jaeger, 1998; Skorupski & Hambleton, 2005). The panelists are also provided with the difficulty of each item as an auxiliary information for their work on producing RVMs by units.
As an example, the Arabic language test (ALT), developed and administered by the NCA in Saudi Arabia, consists of 80 binary items grouped into four content domains as follows: reading comprehension, rhetoric expression, structure, and writing accuracy. Each domain is divided into two subdomains, with the items in each subdomain grouped by subdomain elements. In a workshop with panelists for standard setting on the ALT, the subdomain elements were used as RVUs. This is illustrated in Table 1 for reading comprehension, with two subdomains (explicit and implicit) and five subdomain elements used as RVUs. The selected items (“circled” in Table 1) were identified by the panelists as sufficient to evidence “mastery” of the respective RVU, which resulted in a RVM of reading comprehension.
Specification Table for Panelists to Provide a Response Vector for Mastery (RVM) of the Reading Comprehension Domain of the ALT.

Note. Working in “steps” by subdomain elements selected as RVUs, the panelists are required to “circle” the items that (if answered correctly) are sufficient to evidence “mastery” of the respective unit. The selected items are scored as 1 and unselected as 0 in the response vector for “mastery” of the respective unit, which results in a RVM for the reading comprehension domain. ALT = Arabic language test; RVU = response vector unit.
This RVM, along with the RVMs for the other three domains produced in the same way, resulted into a RVM for the entire test (not shown here for space consideration; e.g., Dimitrov & Al-Shamrani, 2019).
RVM-Based Computation of Cut-Scores
The cut-score based on a RVM can be placed on (a) the D-scale of the DSM or (b) the IRT logit scale. In any case, the computation is based on the RVM and item parameters (known in advance). Illustrated next is the computation of cut-scores in three cases where the examinees’ test scores are obtained using (a) Equation 3 under the DSM-C, (b) the two-parameter IRF model (RFM2) under the DSM-L (see Equation 1), and (c) the 2PL model in IRT (e.g., Hambleton et al., 1991). In all three cases, item parameters are estimated for simulated data on a test of 20 binary items and 3,000 persons. The items are grouped into four RVUs (e.g., content domains) with a hypothetical response vector (RVM) for each unit and a resulting RVM for the entire test.
Case 1
Under the DSM-C, expected item difficulties,
Computing Cut-Scores for “Mastery” on the D-Scale: A Hypothetical Test of 20 Items Grouped in Four Response Vector Units (RVUs).

Notes. δ = expected item difficulty (for a target population of examinees). For each RVU, it is assumed that panelists have come to agreement that answering correctly the “circled” items is sufficient for mastery of the RVU. Using Equation 3, cut-scores on the D-scale are computed for each RVU (e.g., for diagnostic feedback) and then on the entire test (for final “mastery” classification).
Case 2
Under the DSM-L, the item parameters for location, b, and shape, s, under the RFM2 model (see Equation 1) were estimated using a maximum-likelihood estimation (MLE) approach (e.g., Dimitrov & Atanasov, 2021) implemented in the computer program DELTA. The estimates of b and s, along with the hypothetical RVMs, are provided in Table 3. The cut-sore on the D-scale (
Response Vector for Mastery (RVM) and Estimates of Item Parameters Under the Two-Parameter Models in the DSM-L (b and s) and IRT (a and b) for 20 Simulated Items.
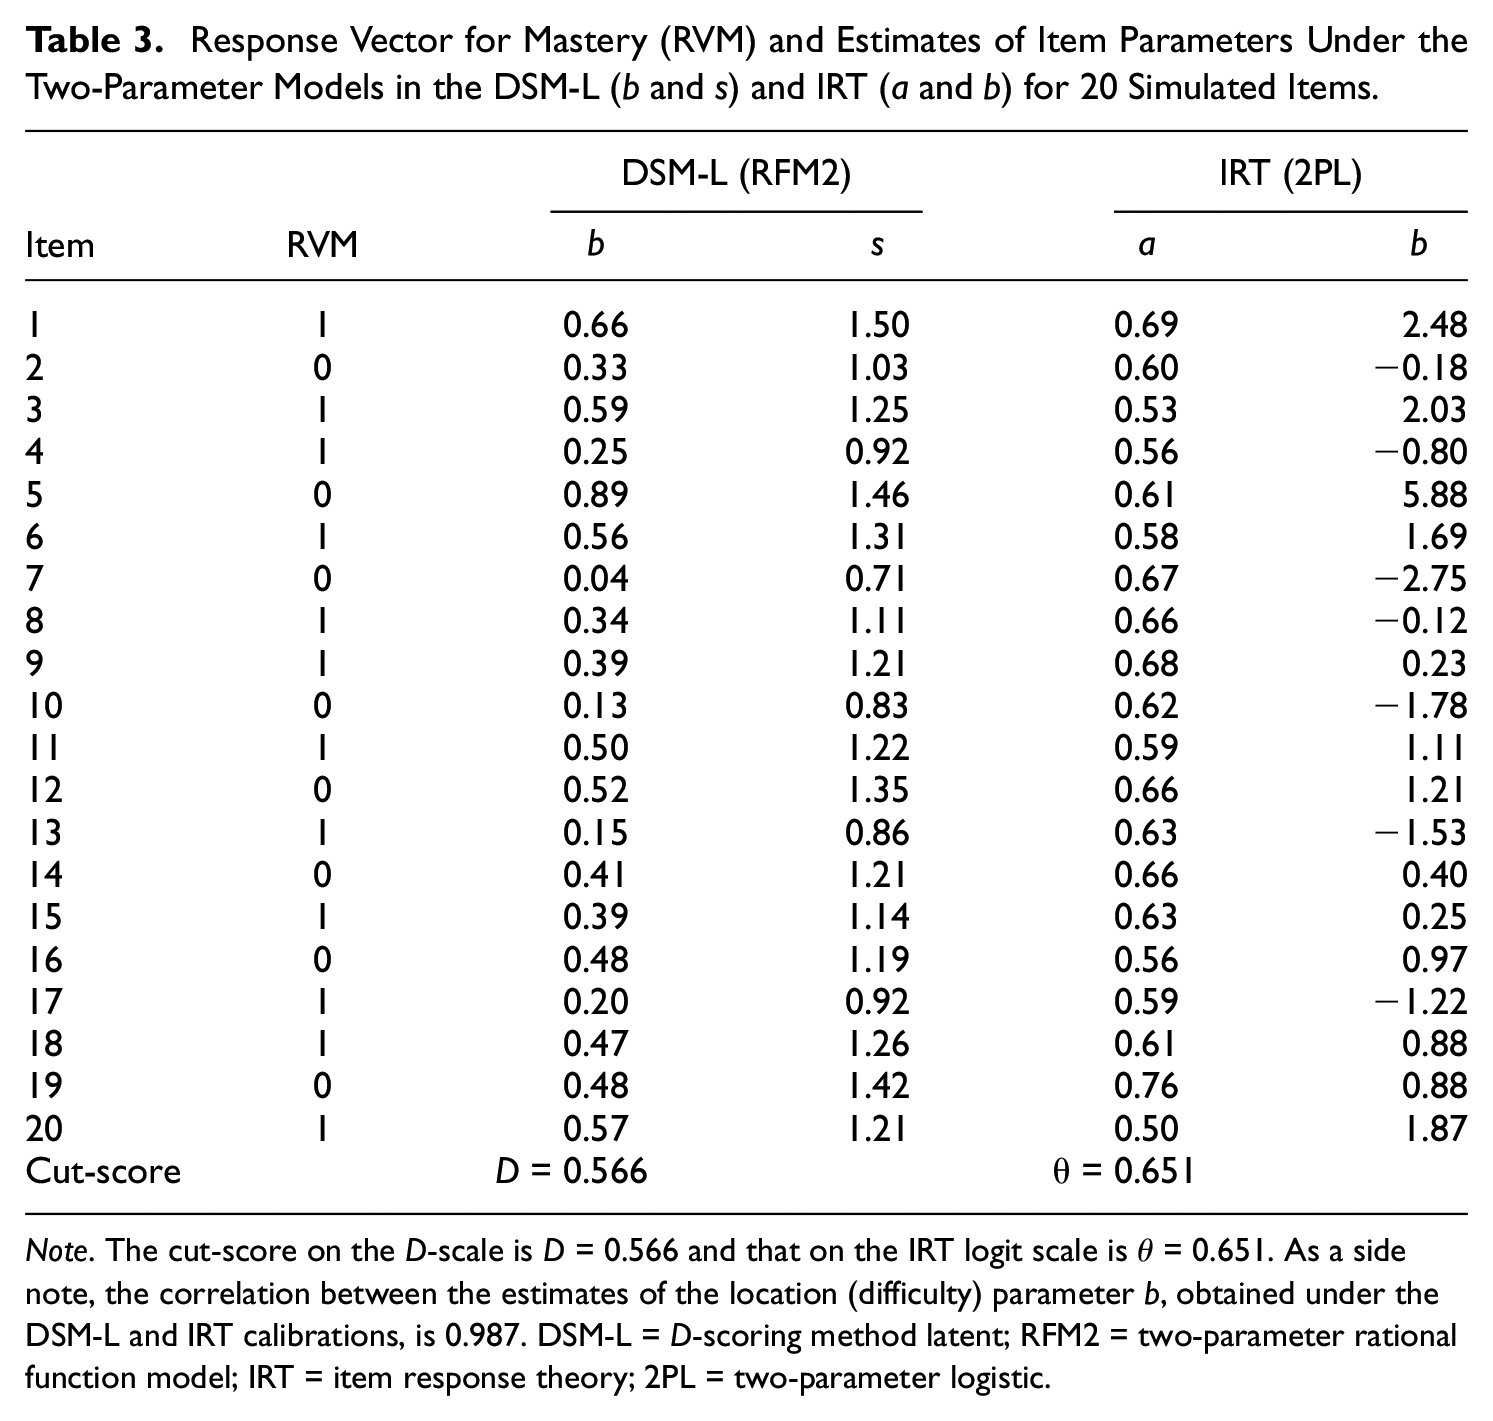
Note. The cut-score on the D-scale is D = 0.566 and that on the IRT logit scale is θ = 0.651. As a side note, the correlation between the estimates of the location (difficulty) parameter b, obtained under the DSM-L and IRT calibrations, is 0.987. DSM-L = D-scoring method latent; RFM2 = two-parameter rational function model; IRT = item response theory; 2PL = two-parameter logistic.

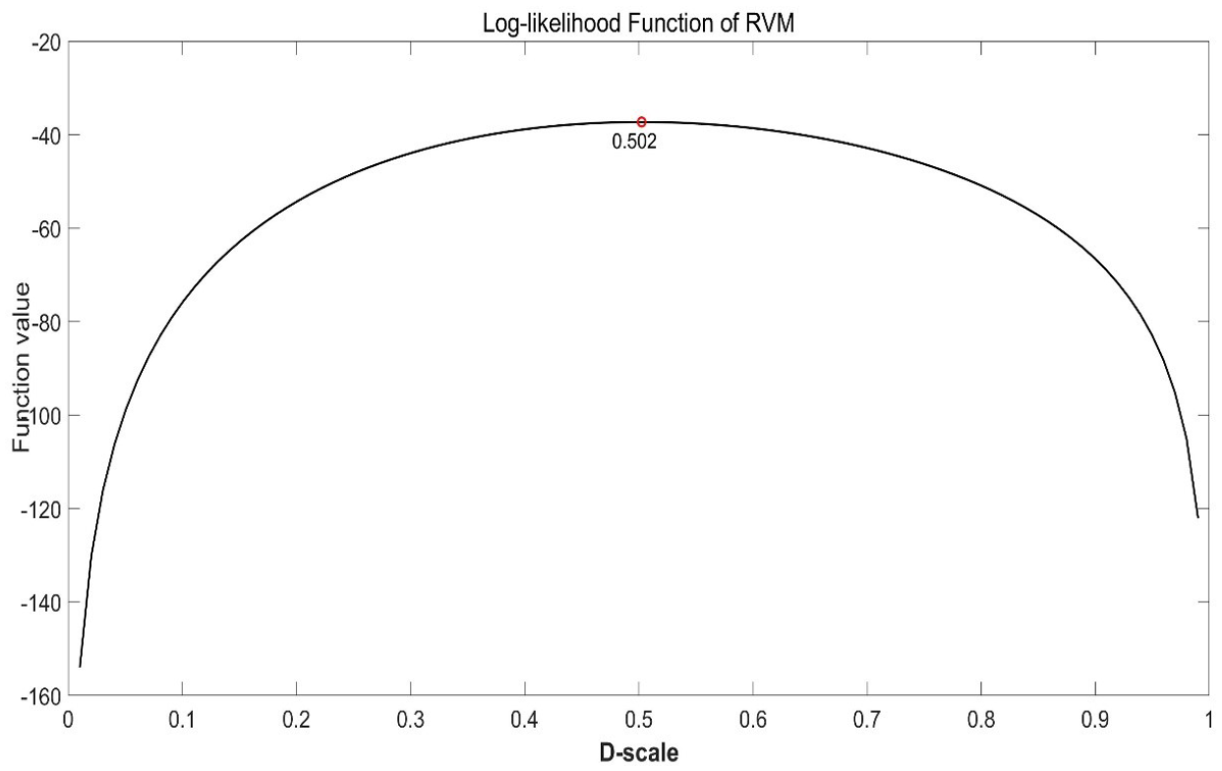
The cut-score (0.566) on the D-scale estimated for the RVM and two item parameters (b and s) of 20 simulated items (see Table 3) via MLE under the RFM2 model of the DSM-L.
Case 3
In IRT framework, the item parameters were estimated under the 2PL model using the computer program IRTPRO. The estimates of item parameters for discrimination, a, and location (model-based difficulty), b, are also provided in Table 3. The cut-sore on the IRT logit scale (

The cut-score (0.651) on the IRT logit scale estimated for the RVM and two item parameters (a and b) of 20 simulated items (see Table 3) via MLE under the 2PL model in IRT.
An Example of Using the RVM Methods
The main purpose in this section is to describe procedures and results related to using the RVM method in a standard setting workshop aiming at the derivation of cut-scores on a test referred to as multiple cognitive abilities assessment (MCAA). For comparison, cutting scores based on the bookmark method under the RP67 and RP50 criteria were also derived in the standard setting process involving the same panelists (experts on the MCAA content). The cut-scores are used for admission of students to education programs (specialized curricula, summer and after school programs, and competitions) under the Mawhiba Project for gifted and talented students in Saudi Arabia (http://www.mawhiba.org). Three versions of the MCAA are developed for three school levels, namely: Level 1 (Grades 3-5), Level 2 (Grades 6-8), and Level 3 (Grades 9-12) (e.g., seeMourgues et al., 2016). For consistency with the terminology used here, the term mastery is used for the category of students with MCAA performamce above the cut-score and nonmastery for those who perform below the cut-score at the respective school level.
Given the illustrative purpose of this example, only results for Level 1 (Grades 3-5) are presented, but the RVM and bookmark procedures are identical for the panelists at all three school levels. The MCAA for Grades 3 to 5 consists of 52 dichotomously scored (1/0) items associated with four content domains (a) mental flexibility, (b) verbal reasoning and reading comprehension, (c) mathematical and spatial reasoning, and (d) scientific and mechanical reasoning, with 13 items per domain. A brief description of these domains is presented next.
Verbal reasoning and reading comprehension (VR&RC). This subscales measures (a) linguistic reasoning—the ability to use language to reach conclusions by processing available information and facts according to specific logical rules and procedures and (b) reading comprehension—the ability to apply grammar and use it in dealing with reading content.
Mathematical and spatial reasoning (MR&SR). This subscale measures (a) mathematical reasoning—the ability to use mathematical skills and logical thinking to obtain solutions or results through specific strategies and (b) spatial reasoning—the pictorial ability to find a logical relationship between forms, whether in terms of change, similarity, congruence, difference, folding or counting.
Scientific and mechanical reasoning (SR&MR). This subscale measures (a) scientific reasoning—the ability to use available data and facts in a science, experience and logic to obtain information from data and facts that have not been tried before, to build natural objects and to visualize their past and future, as well as the ability to process logical reasoning based on evidence-based extrapolation, and (b) mechanical reasoning—the ability to use principles and concepts in natural sciences to understand and solve different phenomena, such as light, sound, electricity, magnet, motion, diverse forces, pressure, heat, properties of materials, and gases.
Mental flexibility (MF). This subscale measures the ability to produce diverse ideas, direct thinking to visualize what is the opposite of what exists, directing and linking areas of use and changing and diversifying ways of dealing with things and situations according to their nature. This can be achieved through analyzing factors of the difficulties that can be identified and used in finding solutions.
Procedure
The work of participating panelists was organized according to the methodology of standard setting, including training, presentation of the RVM and bookmark methods, and rounds of implementation (e.g., Dimitrov et al., 2020; Ferrara et al., 2008; Lewis et al., 2012; Mitzel et al., 2001). The RVM rounds were conducted in 2 days, whereas the bookmark rounds took 6 days using the RP67 and RP50 criteria of response probability in two separate sessions. Some details are provided next.
RVM Rounds
The RVM method was applied in two rounds over 2 days and 5 hours per day. Twenty-eight panelists were divided into groups based on their expertise in MCAA domains. Specifically, four panelists were assigned to each of the first three domains described here above and four panelists to each the four subdomains (areas of science) of the domain SR&MR, namely: Biology, Physics, Chemistry, and Geology. The panelists were asked to identify RVMs for seven RVUs, (a) RVU1 for MF, (b) RVU2 for VR&RC, (c) RVU3 for MR&SR, (d) RVU4 for Biology, (e) RVU5 for Physics, (f) RVU6 for Chemistry, and (g) RVU7 for Geology.
During the first round, after receiving training on the RVM method, each panelist worked independently on the test unit (RVU) in their area of expertise to identify a RVM for that unit. The panelists were given a booklet describing the RVU items, their IRDs and difficulty, and PLDs for mastery of the RVU. During the second round, the panelists worked collectively in groups of four to come up with a final RVM for the respective RVU of the test. They were provided with a feedback from Round 1, including their individual RVMs, the resulting cut-scores, and the percentage of examinees expected to pass those cut-scores. The identification of RVMs for each of the seven RVUs resulted “automatically” in a RVM for “mastery” on the entire test, MCAA (not shown here for space consideration). This procedure was repeated for each of the three MCAA tests by grade levels (L1, L2, and L3). The time schedule is shown in Table 4.
Time Schedule of the Panelists’ Work Under the RVM Method.

Note. VR&RC = verbal reasoning and reading comprehension; MR&SR = mathematical and spatial reasoning; MF: mental flexibility; SR&MR = scientific and mechanical reasoning.
Grade levels: 1 = Grades 3 to 5; 2 = Grades 6 to 8, and 3 = Grades 9 to 12.
Bookmark Rounds
The bookmark method was conducted in 6 days, 4 hours per day, involving the same experts who worked under the RVM method. The test forms by grade levels were structured in OIBs under the bookmark method. After providing instructions to the experts, their work was conducted in two sessions.
During the first session, the experts worked individually under two scenarios for each domain of the MCAA tests by grade levels. In the first scenario the panelists used the OIB under the RP67 rule; that is, RP = 2/3 (67% chances of correct item response by the borderline student). In the second scenario they worked under the RP50 rule; that is, RP = 1/2 (50% chances of correct item response by the borderline student). The experts worked individually and then by groups related to the four MCAA subscales (domains). The first day they used the MCAA tests for Grade Levels 1 and 2, under the RP = 2/3 rule. The second day they used the MCAA test for grade levels and RP values as follows: (a) Level 3, RP = 2/3 and (b) Level 1, RP = 1/2. The third day, the used the MCAA tests for Levels 2 and 3, under RP = 1/2.
During the second session, the experts worked only in four groups, by content domains of their expertise, using the OIBs for the entire MCAA test by grade level. The first day they used the MCAA tests for Grade Levels 1 and 2, under the RP = 2/3 rule. The second day they used the MCAA test for grade levels and RP values as follows: (a) Level 3, RP = 2/3 and (b) Level 1, RP = 1/2. The third day, they used the MCAA tests for Levels 2 and 3, under RP = 1/2. The number of booklets (OIBs) with marked items for “mastery” on the entire MCAA test is given in Table 5.
Number of Booklets (OIBs) Used by Experts Individually and in Groups by Grade Level and RP Values Under the Bookmark Method.

Note. RP = 2/3 (67% chances of correct response); RP = 2/3 (50% chances of correct response). RP == response probability (likelihood of correct item response); OIB = ordered item booklet.
Computation of Cut-Scores
Of primary interest was the derivation of cut-scores on the scale of the entire MCAA test for decisions on the examinees’ acceptance to programs for gifted and talented students in Saudi Arabia. Cut-scores by MCAA content domains were also computed for diagnostic feedback to the education program.
RVM Cut-Scores
Under the RVM method, cut-scores were computed on the D-scale. As noted earlier, provided here are only results for the MCAA at Level 1 (Grades 3-5) due to space consideration. For illustration, the cut-score on the IRT logit scale, based on RVM provided by the panelists for the entire test (Grades 3-5) was also computed and provided here. Cut-score were computed in three scenarios, using (a) Equation 3 under the DSM-C, (b) MLE under the RFM2 model in DSM-L, and (c) MLE under the 2PL model in IRT. Under the DSM-C, the cut-score on the D-scale (0-1) was found to be
The cut-score (0.502) on the D-scale estimated for the RVM and two item parameters (b and s) of the MCAA items via MLE under the RFM2 model of the DSM-L.
Validation
Regarding the validity of performance standards, Kane (1994, 2001) suggested three types of validity evidence―procedural, internal, and external. The procedural validation of the RVM application in the context of this example can be addressed from two perspectives. First, the RVM method simplifies and facilitates the panelists’ judgmental task by focusing on their expertise and entirely eliminating probability judgments about performance of a “borderline” examinee on individual items. Second, the panelists were surveyed about their understanding of the RVM method and confidence in the derived cut-scores for “mastery” of the domains of their expertise and the entire test, MCAA. Their responses were in strong support to the RVM method.
The internal validation of the RVM method was addressed by estimating the panelists’ consistency in the produced RVMs and resulting cut-scores by the domains of their expertise. For example, the panelists’ agreement on the domain “mental flexibility” (see Table 6) was estimated by comparing their RVMs, produced at the first round, with the final RVM produced at the second round of the procedure. For example, 3/4 (75%) of the panelists agreed that Item 5 should be selected (scored as 1), whereas 4/4 (100%) agreed that Item 7 may not be selected (scored 0) in the RVM for “mental flexibility.” The average agreement over all 13 items in this domain is 79%. Furthermore, the cut-score on the D-scale, obtained with the RVM for this domain via Equation 3 is
Response Vectors for Mastery (RVM) of the “Mental Flexibility (MF)” Domain of the MCAA Produced by Four Panelists at Round 1 and Their Final Solution Produced at Round 2 of the Standard Setting Procedure.
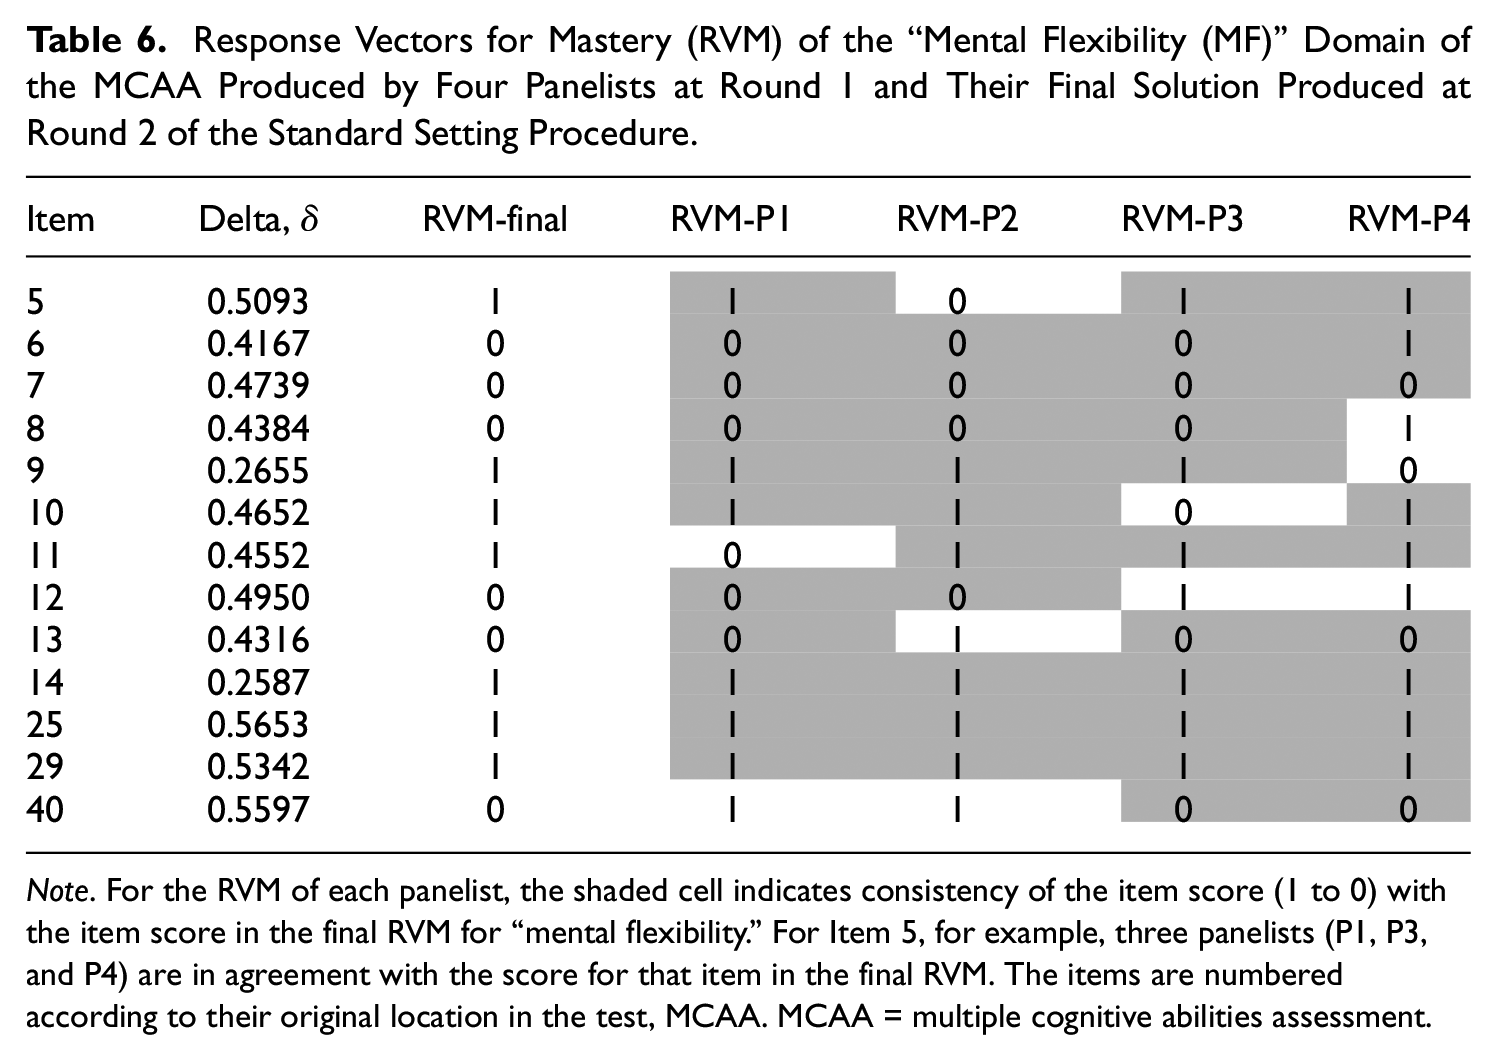
Note. For the RVM of each panelist, the shaded cell indicates consistency of the item score (1 to 0) with the item score in the final RVM for “mental flexibility.” For Item 5, for example, three panelists (P1, P3, and P4) are in agreement with the score for that item in the final RVM. The items are numbered according to their original location in the test, MCAA. MCAA = multiple cognitive abilities assessment.
One aspect of external validation of the RVM method in the context of this example was to compare the location of cut-scores on the D-scale [0-1], obtained via MLE under the DSM-L, and on the IRT scale, obtained via MLE under the 2PL model in IRT. As shown earlier for simulated data (see Figures 1 and 2), the cut-scores based on the RVM for all test items are (a)
Response Vector for Mastery (RVM) and Estimates of the Item Parameters Under the 2PL Models in the DSM-L (b and s) and IRT (a and b) for the Items in the “Mental Flexibility” Domain of the MCAA.
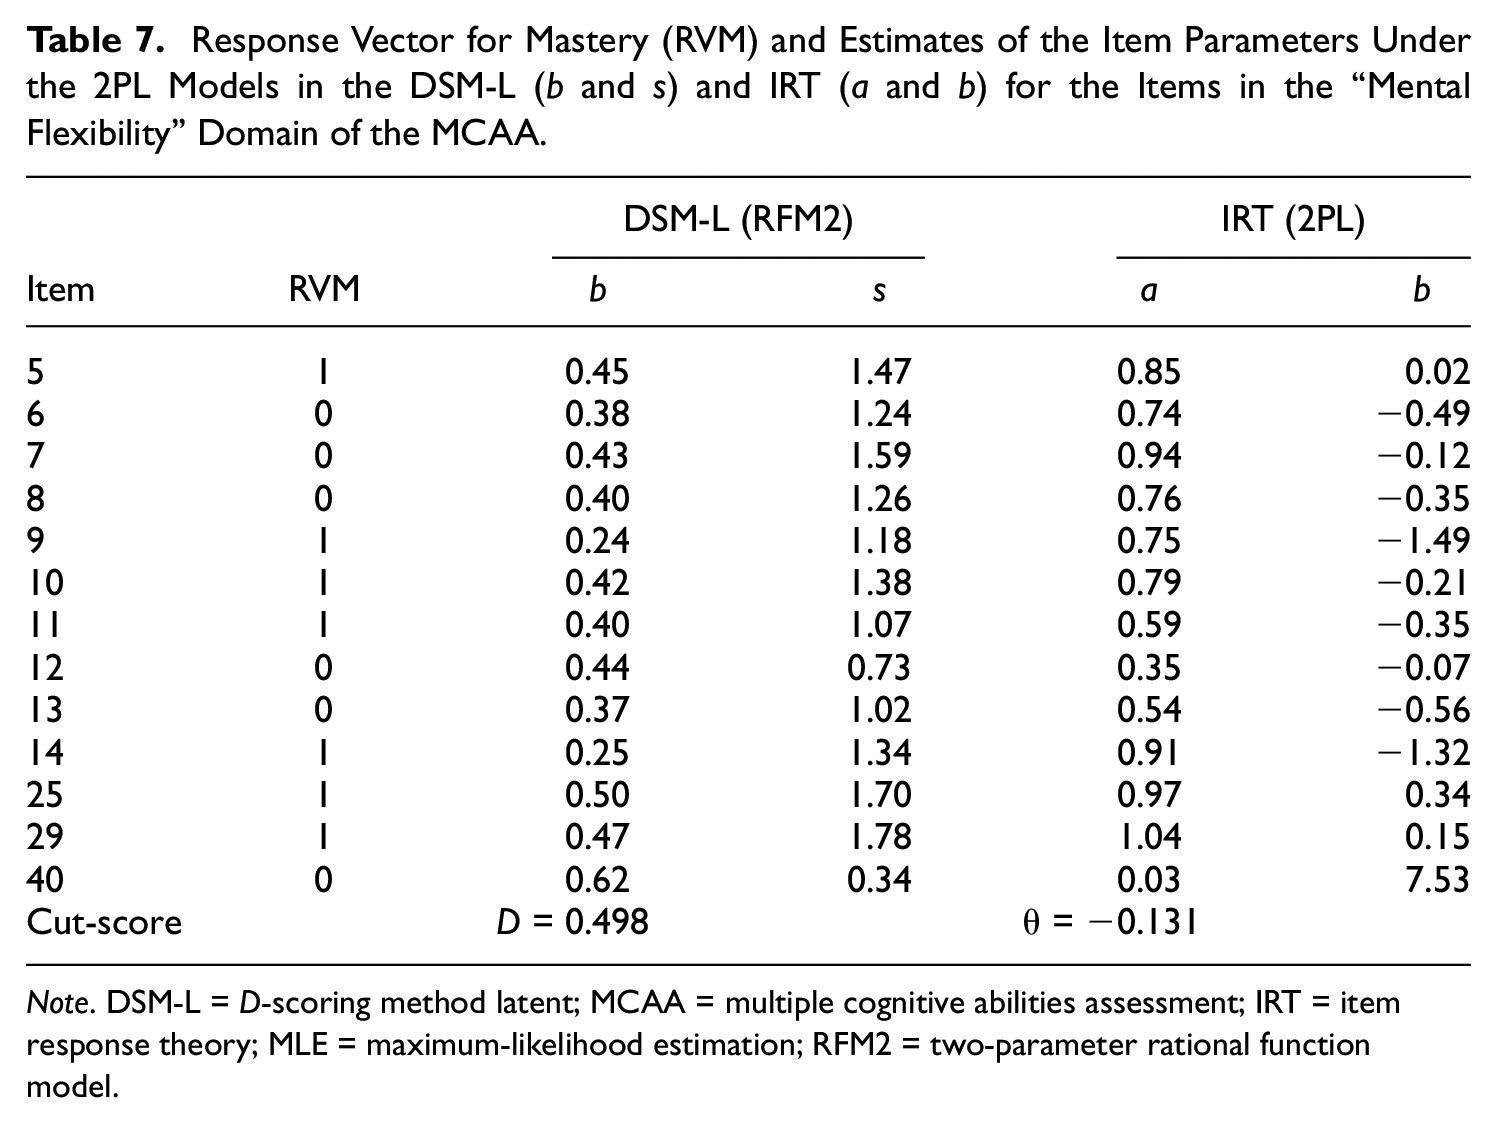
Note. DSM-L = D-scoring method latent; MCAA = multiple cognitive abilities assessment; IRT = item response theory; MLE = maximum-likelihood estimation; RFM2 = two-parameter rational function model.

The cut-score (0.087) on the IRT logit scale estimated for the RVM and two item parameters (a and b) of the MCAA items via MLE under the 2PL model in IRT.
Bookmark Cut-Scores
The bookmark method was applied for derivation of cut-scores on the D-scale to control for the scale factor in the comparison of cut-scores obtained under RVM and bookmark methods. Therefore, instead of IRT-based item parameters, the OIB of the bookmark was based on DSM-L item parameters for location (model-based difficulty), b, and shape/discrimination, s, obtained under the latent RFM2 model given in Equation 1. Another adjustment to using the bookmark method under the DSM-L relates to the formula of the cut-score computation based on the item marked in the OIB by panelists. Details on this matter are provided in the appendix. Apart from these two minor technical adjustments, the bookmark method is the same for derivation of cut-scores on the D-scale and IRT logit scale. The resulting cut-scores on the D-scale for the entire test and by content domains for Grades 3 to 5, obtained under the bookmark rules RP67 and RP50, are reported in Table 8. For comparison, the corresponding cut-scores obtained under the RVM method, as described in the previous section, are also reported in Table 8.
Cutting Scores for “Mastery” Under the RVM and Bookmark Method (BM) on the D-Scale (0-100) for Students at Grades 3 to 5.
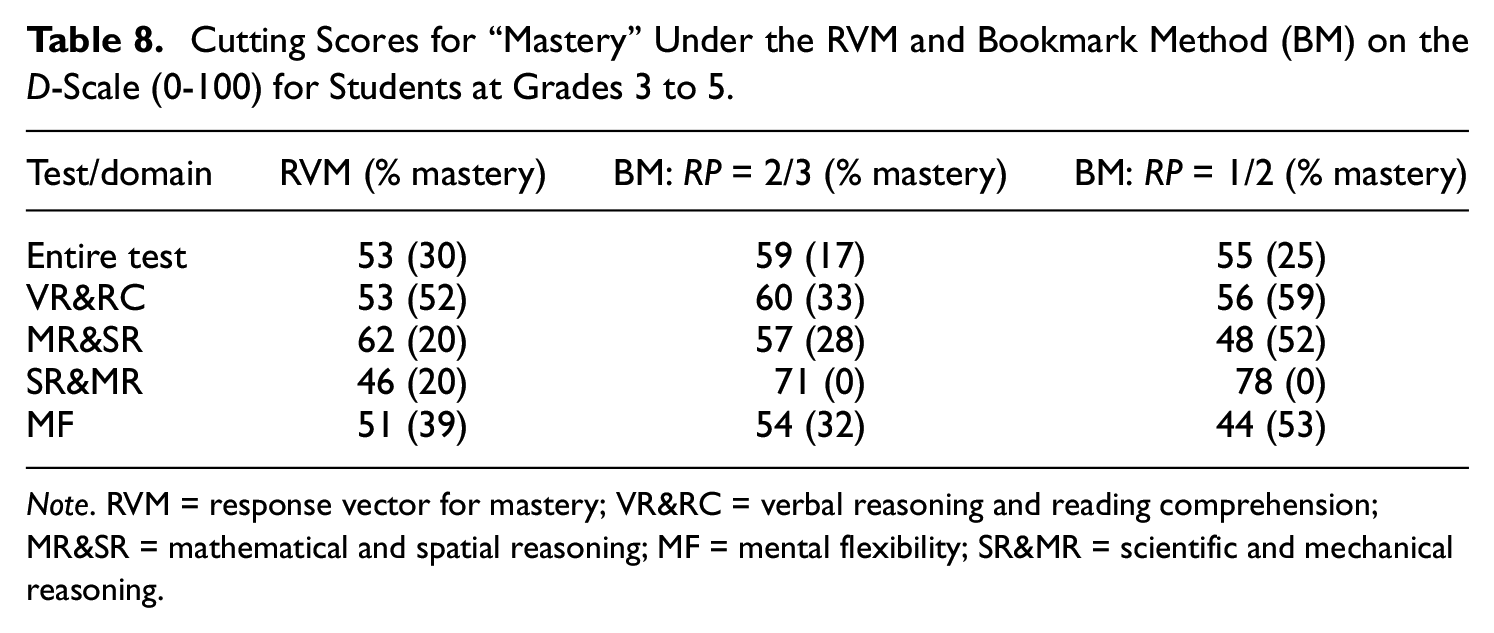
Note. RVM = response vector for mastery; VR&RC = verbal reasoning and reading comprehension; MR&SR = mathematical and spatial reasoning; MF = mental flexibility; SR&MR = scientific and mechanical reasoning.
Comparison of RVM and Bookmark Results
The RVM and bookmark results are examined by comparing (a) values of cut-scores obtained under the two methods on the D-scale, (b) agreement among panelists on produced cut-scores, and (c) panelists’ opinions about the two methods. The D-scores are given here on a scale from 0 to 100 for ease of interpretation and consistency with their presentation in reports on test results. First, as shown in Table 8, the bookmark cut-scores under the RP67 and RP50 rules (59 and 55, respectively) are higher than the RVM cut-score on the entire test (Dcut = 53). This trend holds for the cut-scores by content domains, with an exception for the domain of MR&SR. From practical perspectives, related to targeted proportions of acceptance to Mawhiba education programs and diagnostic feedback on expected performance by content domains, the panelists and other stakeholders were unanimously in favor of the RVM cut-scores. Provided in Figure 5 is the distribution of D-scores for the study sample of examinees in school Grades 3 to 5 (N = 16,075), with RVM cut-score (Dcut = 53) producing 30% acceptance to the Mawhiba education programs. Furthermore, the bookmark cut-scores on the content domain SR&MR are totally unrealistic, with 0% passing rate compared with 20% produced by the RVM cut-score.

D-score distribution for students at Level 1 (Grades 3-5) with the response vector for mastery (RVM) cut-score (Dcut = 53) producing 30% acceptance to Mawhiba education programs.
Second, there was higher level of agreement among the participating panelists when they work under the RVM method compared to the bookmark method. This can be seen, for example, from the results in Table 9 where the standard deviation (SD) of cut-scores produced independently by the panelists is smaller under the RVM method (SD = 5.50) compared with the bookmark method using the RP67 rule (SD = 6.67) or RP50 rule (SD = 9.79).
Means and Standard Deviations of Cut-Scores Obtained Under the RVM and Bookmark Methods.

Note. Cut-scores on the D-scale (0-100). RVM = response vector for mastery; RP = response probability.
Third, at the end of the standard setting workshop the participating panelists answered survey questions about their opinions on comparing the RVM method and the bookmark method (with RP = 2/3 and RP = 1/2). Overall, the panelists were in favor of the RVM method as being “more comprehensive, sound, and taking into account all items (in a RVM unit).” Regarding the bookmark methods, the panelists noted that “this method is difficult to practice and apply, and it needs more work and good training” as well as that the bookmark method “ignores the rest of the questions” (after the marked item in the OIB).
Discussion
The proposed method of standard setting, referred to as RVM method, was designed to (a) overcome some problems related to the Angoff’s (1971) method, the bookmark method (Lewis et al., 1996; Mitzel et al., 2001), and the relatively new and promising ID matching method (Ferrara et al., 2008; Ferrara & Lewis, 2012), (b) reflect more adequately the content structure of typical standardized assessment tools, and (c) align the computation of cut-scores with the computation of ability scores on the D-scale and the IRT logit scale. Summarized briefly are some arguments in this regard.
First, similar to the ID matching method, the RVM method does not require panelists to conceptualize a borderline examinee and make probability judgments as this is done under the Angoff and bookmark methods. Second, the RVM method avoids problems related to the OIB (e.g., item disordinality), which is used in bookmark and ID matching methods. Third, the RVUs reflect more adequately the structure of the test compared with a single-item focus under the other methods. Fourth, the estimation of cut-scores based on RVMs is aligned with the estimation of examinees’ ability levels using their response vectors (e.g., via MLE) in the framework of DSM or IRT. Such an alignment is not performed with OIB-based estimations of cut-scores using a single item, leaving out ability information coded in the other items (e.g., Zieky, 2001). Also, in the illustrative example provided in the previous section, the RVM method performed better than the bookmark method (using the RP67 and RP50 rules) in several aspects, (a) the RVM cut-scores were associated with more realistic (targeted) passing rates, (b) the participating panelists were in a higher level of agreement on cut-scores produced under the RVM method, and (c) the panelists found the RVM method easier to apply, more comprehensive, and more adequately reflecting the content structure of the test.
Practical Considerations
The Choice of RVUs
The RVUs are obtained via partitioning the content structure of the test into substantively meaningful units that (a) are relatively short (e.g., 5-10 items) and (b) can be evaluated for “mastery” on relevant descriptors. For each RVU, the panelists should identify items that are sufficient to evidence mastery of the unit (if answered correctly). The identification of response vectors for mastery by units “automatically” results in a response vector for targeted ‘mastery’ over the entire test. With the example on teacher licensure test provided earlier, the test is structured by content domains and “teaching standards” related to each domain. In this case, the teaching standards were used as RVUs as they were relatively short and well described according to targeted performance. Similarly, the ALT is structured by content domains, with each domain further partitioned into substantively defined units that were selected as RVUs (see Table 1).
Computation of Cut-Scores
When the goal is to place cut-scores on the D-scale, their computation under the DSM-C (see Table 2) can be referred for its transparency, simplicity, and dependability. Specifically, the transparency of a cut-score is provided by its explicit and direct computation via the scalar product of two vectors―the RVM (a sequence of 1/0 item scores) and the vector of expected item difficulties, δ (see Equation 3). The estimation of
Thus, when cut-scores are presented on the D-scale from 0 to 100 (i.e., multiplying by 100) and rounded to the nearest integer for report purposes, it would be appropriate to use the DSM-C approach to cut-score computation (see Table 2). When cut-scores are placed on the IRT scale, MLE-based computations using the RVM produced by panelists and estimates of item parameters (e.g., under the 2PL) is a viable option. Technically, this option is facilitated by the availability of MLE procedures for IRT estimations in R, MATLAB, and other software packages. 1
Limitations and Future Research
The RVM method is appropriate when the content structure of the test allows for a substantively based identification of units, called RVUs, with availability of PLDs for each unit. Also, the length of each RVU must be relatively small (e.g., 5-10 items) to allow for manageable and efficient work by the panelists related to the identification of response vectors for “mastery” (RVMs) by units. If these conditions are not in place, the RVM method may not be appropriate―a scenario which is, however, highly unlikely to occur with tests designed for standard setting.
Some limitations of the present study (not necessarily of the RVM method per se) relate to issues that are not addressed here but need to be examined in future research. Additional studies are needed to further understand the suitability of the RVM method in different contexts of standard setting. For example, the RVM method is discussed here in the context of binary (e.g., mastery/nonmastery) classifications, so additional research can investigate its suitability for the classification of examinees into more than two performance categories (e.g., basic, proficient, advanced). Also, the validation of RVM-based cut-scores need to be examined from a variety of perspectives, including modern approaches to estimating errors under controlled conditions of “mastery” classifications (e.g., Grabovsky & Wainer, 2017). Comparisons of the RVM method with other standard setting methods on methodology and practical efficiency are recommended.
Conclusion
With the understanding that there is no single (“best”) approach to setting standards for a variety of assessment scenarios and policy guidelines, the proposed RVM method is an efficient approach to standard setting with unique features of transparency, simplicity, dependability, and separability of panelists’ judgments and psychometric estimations of cut-scores on the IRT scale and/or the D-scale of the recently developed D-scoring method.
Footnotes
Appendix
Acknowledgements
The author would like to thank Dr. Abdullah Qataee and Dr. Abdullah Sadaawi, from the National Center for Assessment at the Education & Training Evaluation Commission (ETEC) in Saudi Arabia, for their support related to piloting of the RVM method at ETEC; Dr. Hanan Ghamdi and Dr. Maisaa Alahmadi for their help with the logistics of the standard setting study for the MCAA test, as well as participating panelists and Mawhiba representatives.
Declaration of Conflicting Interests
The author declared no potential conflicts of interest with respect to the research, authorship, and/or publication of this article.
Funding
The author received no financial support for the research, authorship, and/or publication of this article.