
Abstract
Researchers frequently use Mokken scale analysis (MSA), which is a nonparametric approach to item response theory, when they have relatively small samples of examinees. Researchers have provided some guidance regarding the minimum sample size for applications of MSA under various conditions. However, these studies have not focused on item-level measurement problems, such as violations of monotonicity or invariant item ordering (IIO). Moreover, these studies have focused on problems that occur for a complete sample of examinees. The current study uses a simulation study to consider the sensitivity of MSA item analysis procedures to problematic item characteristics that occur within limited ranges of the latent variable. Results generally support the use of MSA with small samples (N around 100 examinees) as long as multiple indicators of item quality are considered.
To appropriately interpret the results from their item analyses, researchers need to be aware of the sensitivity of selected methods to various problematic item characteristics under a variety of conditions, including various sample sizes. In particular, small sample sizes limit statistical power to detect problematic item characteristics such as those illustrated in Figure 1, especially when the problematic characteristics only occur within a limited range of examinee locations. As illustrated in Figure 1, items may exhibit monotonicity (average item responses increase with increasing examinee locations on a latent variable), appropriate discrimination (items distinguish among examinees with different locations on the latent variable, and invariant item ordering (IIO; items have the same relative difficulty ordering) for some, but not all examinees. Item analysis procedures that are sensitive to such characteristics can help researchers identify areas for improvement in their measurement procedures and inform the interpretation of results.
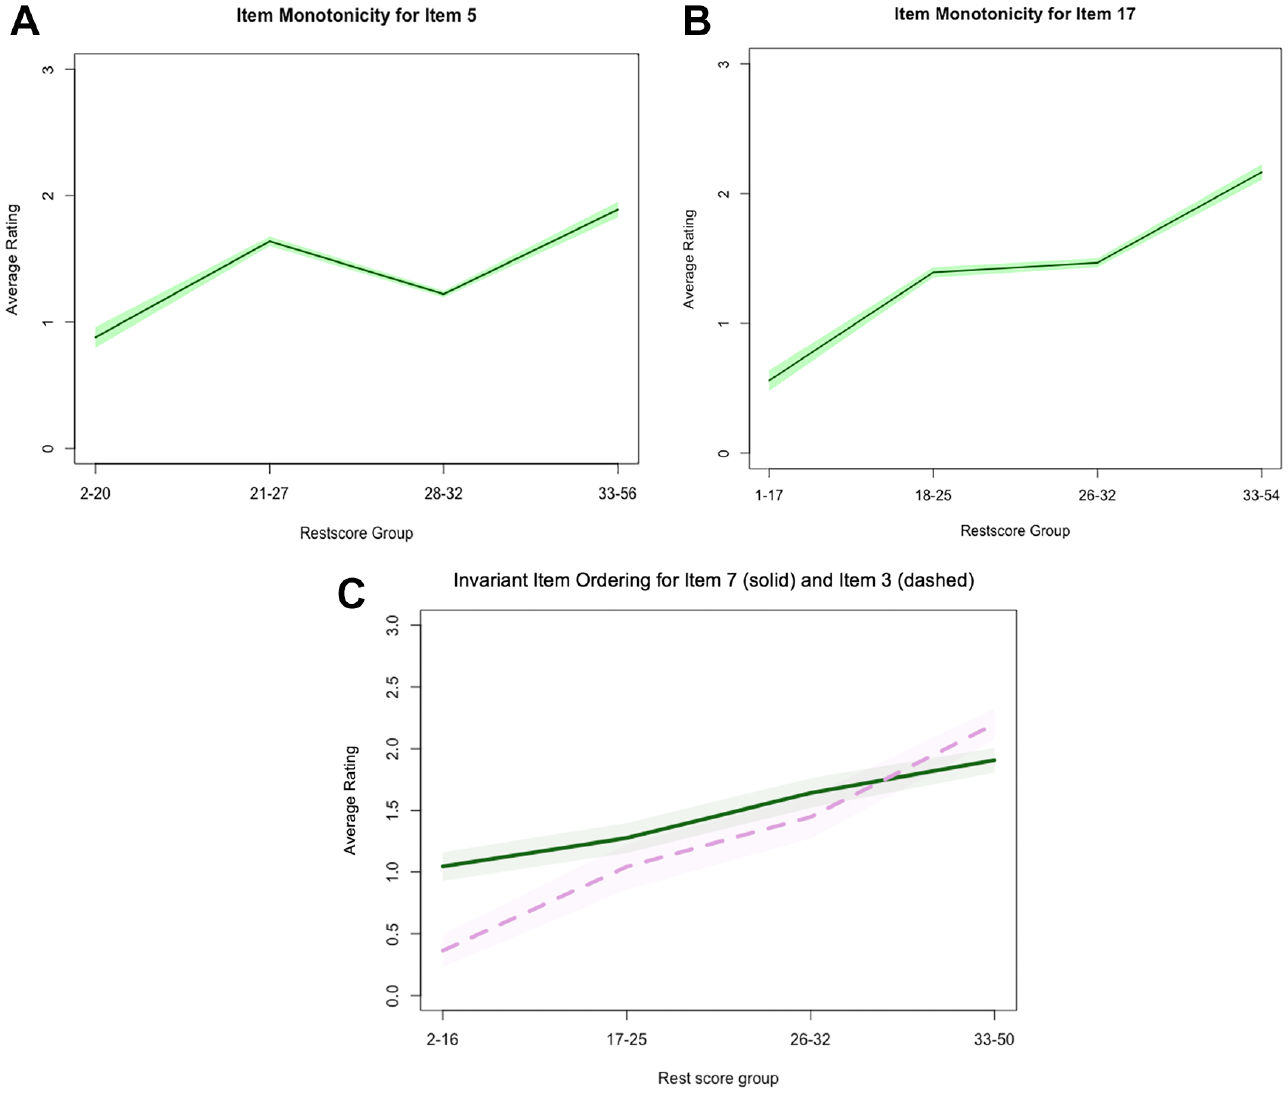
Illustration of problematic item characteristics: (A) item monotonicity for item 5, (B) item monotonicity for item 17, and (C) invariant item ordering for item 7 (solid) and item 3 (dashed).
Mokken scale analysis (MSA; Mokken, 1971) is a theory-based nonparametric approach to item response theory (IRT) that is well suited for detecting problematic item characteristics with relatively small samples (Sijtsma & Molenaar, 2002; Sijtsma et al., 2011). In addition, MSA is sensitive to problematic item characteristics that occur within limited ranges of the latent variable, such as among examinees with relatively low or high locations (Meijer & Baneke, 2004; Santor & Ramsay, 1998). For didactic introductions to MSA, please see Sijtsma and Molenaar (2002), Sijtsma and van der Ark (2017), and Wind (2017).
Although several researchers have proposed minimum sample size requirements for MSA (Straat et al., 2014; Watson et al., 2018), they have not specifically considered how sample sizes may affect the sensitivity of MSA indices to problematic item characteristics that occur within a limited range of the latent variable.
Purpose
Focusing on ordinal polytomous data, such as those that are often collected in attitude questionnaires, this research note illustrates how MSA indicators of item quality can identify problematic item characteristics with small sample sizes. Analyses focus on the following question:
What is the sensitivity of MSA item quality indicators to problematic item characteristics related to monotonicity, discrimination, and IIO when they occur for all examinees and within limited ranges of examinee locations across a range of examinee sample sizes?
The analyses focus on item-level characteristics that may be of interest during procedures such as pilot analyses or other exploratory analyses that researchers conduct for the purpose of item analysis.
Sample Size Requirements for MSA
In a literature review of real data MSA applications, Straat et al. (2014) found that researchers used sample sizes ranging from 133 to 15,022 participants. Recognizing this wide range, two teams of researchers have considered minimum sample size requirements for MSA, and they have offered recommendations based on their findings.
Focusing on automated procedures for assigning items to scales using MSA scalability coefficients, Straat et al. (2014) conducted a simulation study in which they generated item response data from short tests (N = 10 items) and long tests (N = 20 items) in five ordered categories that reflected two latent variables with examinee sample sizes ranging from N = 50 to N = 3,500. These researchers observed that when items exhibited high scalability (i.e., high item quality), smaller participant sample sizes were sufficient to accurately assign items to their respective scales, but when there was low scalability (i.e., poor item quality), larger participant sample sizes were required. Item sample size did not have a substantial effect on the results. Straat et al. (2014) recommended that researchers use a minimum sample size between 250 and 500 participants for high-quality items or between 1,250 and 1,750 participants with low-quality items when the purpose of an analysis is to correctly assign items to scales.
Watson et al. (2018) used a large publicly available dataset made up of participants’ responses to the 14-item Warwick Edinburgh Mental Wellbeing Scale to conduct a methodological investigation of the minimal sample sizes for appropriate use of MSA. From the full sample of N = 7,510 usable responses, the authors selected random samples of participants to form new samples that ranged from 50 to 1,000 participants. Watson et al. recommended samples of at least 250 participants for evaluating the scalability of an entire scale, at least 500 participants for item-pair scalability analyses, at least 750 participants to evaluate item-level scalability, and at least 1,000 participants to identify items with less-extreme violations of item-level scalability for elimination from further analyses.
Methods
Using base programing in R, I generated data with the generalized partial credit model (GPCM; Muraki & Muraki, 2018). The GPCM expresses the probability for a rating in each rating scale category (category x) as a function of examinee locations (θ) on the latent variable, item-specific rating scale threshold locations (δ ik ), and item-specific discrimination (α i ):
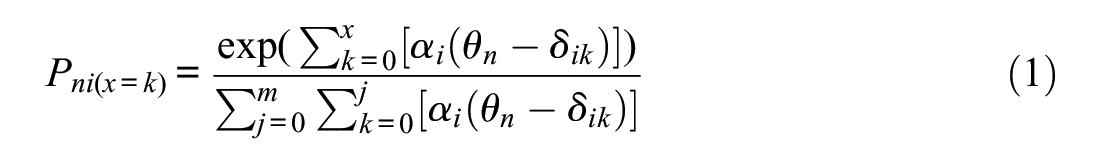
I used the GPCM to generate item responses because it allowed me to manipulate item-level discrimination that would result in violations of monotonicity and poor scalability.
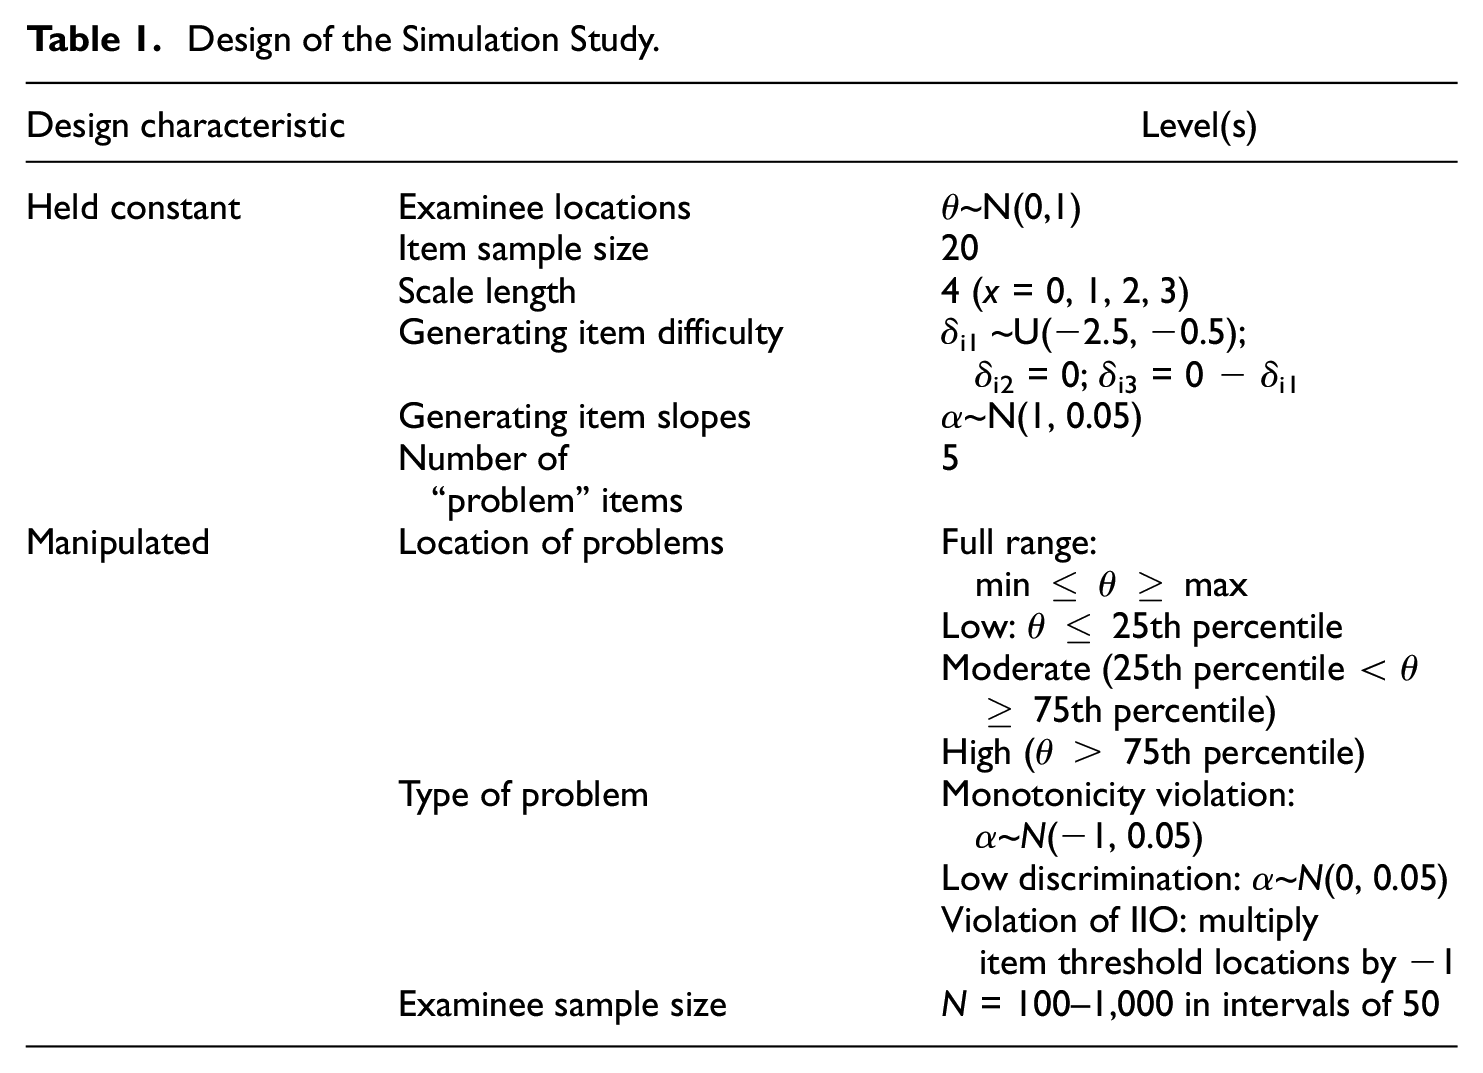
I generated data using the characteristics in Table 1; the design characteristics reflect recent real data analyses with MSA methods (e.g., Chou et al., 2017; Tillema et al., 2021; Vaughan & Grace, 2018). I simulated 500 replications of each condition. Readers who are interested may contact the author for a copy of the code used to generate and analyze the data.
Design of the Simulation Study.
Simulating Problematic Item Characteristics
I simulated five randomly selected items (hereafter, “problem items”) in each condition to exhibit measurement problems; this value reflects the proportion of items that other researchers have identified as exhibiting problematic characteristics with MSA (e.g., Lee et al., 2017; Vaughan & Grace, 2018). I simulated problematic item characteristics within either a subset of the examinee location range or the entire range of examinee locations. For the subset conditions, I simulated the problematic item response characteristics within a subset of the examinee sample whose logit-scale locations were low (θ ≤ 25th percentile), moderate (25th percentile < θ ≥ 75th percentile), or high (θ> 75th percentile). To do this, I generated item responses separately for the examinees with the specified locations with the problematic characteristics included (described below). For the other examinees, I did not simulate problematic characteristics.
Non-Monotonicity
Within the sample of examinees with problematic item response characteristics, I generated items that exhibited violations of monotonicity using negative item discrimination parameters (α~N[−1, 0.05]). For the other items, I used the specifications in Table 1.
Poor Scalability
I generated items that exhibited poor scalability by using item discrimination parameters close to zero (α~N[0, 0.05]) for the selected subset of examinees (all, low, moderate, or high). As a result of the near-zero item discrimination parameters, the items had similar responses from examinees who otherwise would be expected to respond differently, which is one component of poor item scalability (Sijtsma & Molenaar, 2002; Sijtsma & van der Ark, 2017). For the other items, I used the specifications in Table 1.
Violations of IIO
Finally, I generated violations of IIO by multiplying the item threshold location parameters (δ ik ) by −1 for the selected items within the selected subset of examinees. By changing the item location parameters, the item difficulties varied for the selected subgroup of examinees. When I simulated IIO violations for the complete sample, I randomly selected half of the examinees from the complete sample and changed the item difficulty parameter for the selected subgroup while retaining the original item difficulty parameter for the remaining examinees. As a result, differences in item ordering were not specific to a certain range of examinee locations on the latent variable. For the other items, I used the same item parameters for all examinees.
Data Analysis
I used the mokken package for R (van der Ark, 2007, 2012) to conduct the analyses. First, I used MSA procedures to evaluate each item for statistically significant violations of monotonicity using the default restscore group sizes and probability level (p < 0.05) in the mokken package. Items that had at least one statistically significant violation of monotonicity were flagged as problematic; other items were considered acceptable. Second, I calculated MSA item-level scalability coefficients (Hi) for each item. I interpreted item scalability coefficients using Mokken’s (1971) criteria for classifying item scalability as a reference (0.3 ≤ Hi < 0.4: weak scalability; 0.4 ≤ Hi < 0.5: medium scalability; Hi ≥ 0.5: strong scalability). Finally, I used the manifest IIO procedure to evaluate each item for statistically significant violations of IIO using the default restscore group sizes and probability level (p < .05) in the mokken package. Items that had at least one statistically significant violation of IIO were flagged as problematic; other items were considered acceptable.
Results
Figure 2 summarizes the results for the “problem items” in the conditions where I simulated violations of monotonicity, low scalability, and violations of IIO. Detailed numeric results are available in Supplemental Appendix.
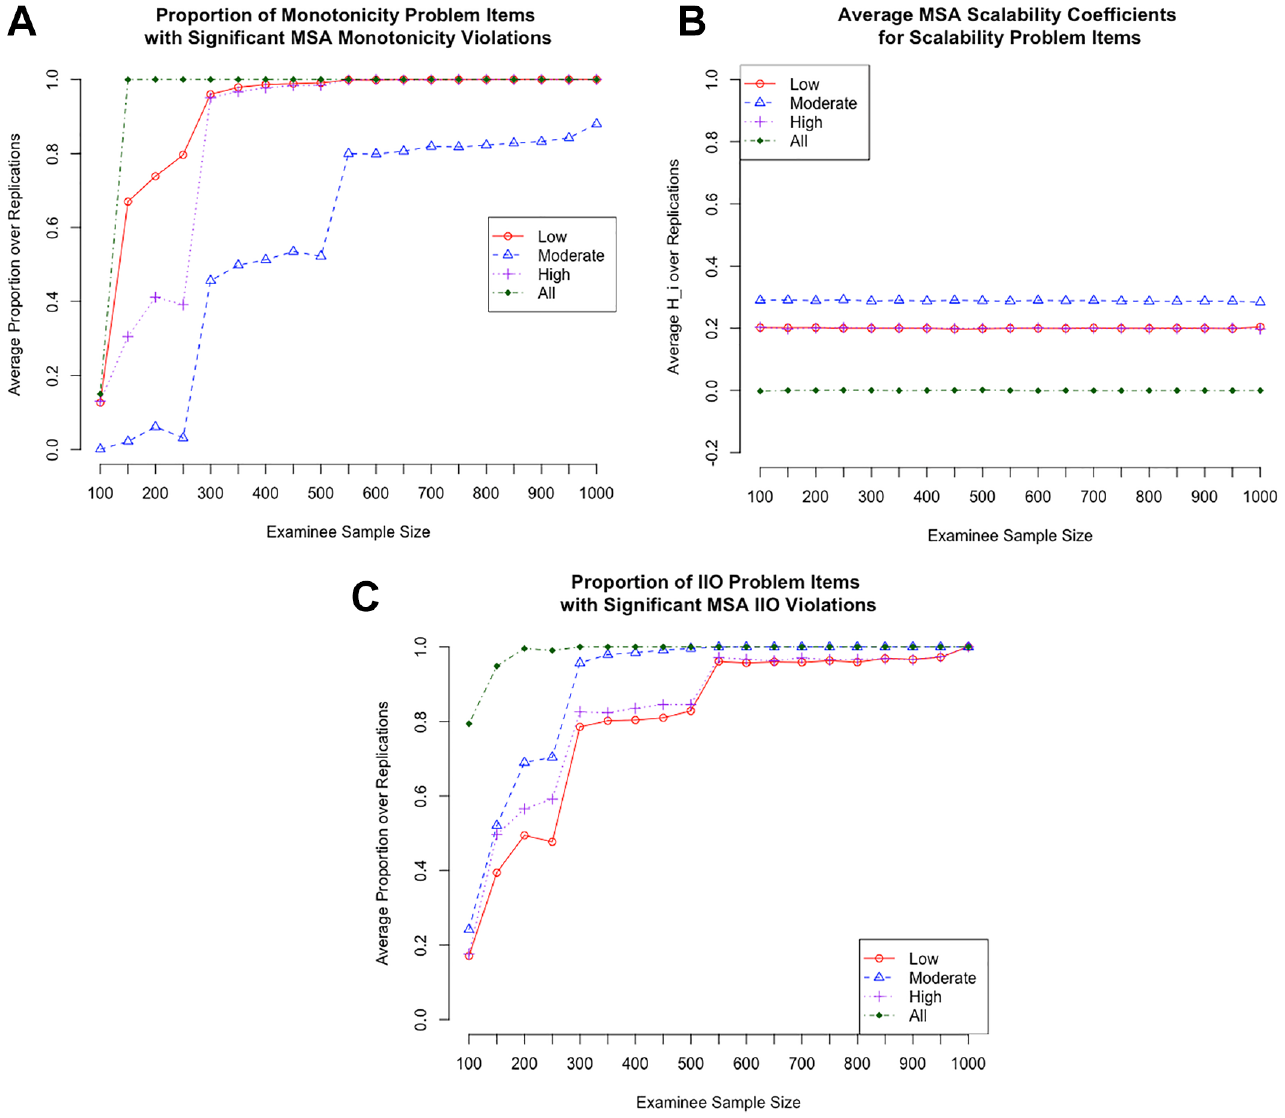
Mokken scale analysis results for: (A) monotonicity violation items, (B) low scalability items, and (C) IIO violation items.
Violations of Monotonicity
Figure 2A shows the sensitivity of MSA monotonicity tests in each of the monotonicity violation conditions. When monotonicity violations were simulated for all examinees, only around 18% of the monotonicity problem items were detected, on average, with the smallest examinee sample size (N = 100). However, this detection rate increased to 100% for all larger sample sizes (N ≥ 200) in the conditions where monotonicity violations were simulated for all examinees. Within the latent-variable location subsets, monotonicity violations were more readily detected when they occurred for examinees with low or high locations compared to moderate examinee locations. On average, a minimum sample size of around 300 participants was necessary to detect at least 95% of the item-level monotonicity violations within these extreme examinee locations. However, even with a sample of 1,000 examinees, monotonicity violations that occurred among moderate-location examinees were only detected with about 88% accuracy, on average.
Despite the somewhat limited sensitivity of the monotonicity test for these items, the average item-level scalability coefficients were lower than Mokken’s (1971) minimum critical value for scalability (Hi ≤ 0.30) in all conditions (see Supplemental Appendix). This result suggests that even though the items were not flagged for statistically significant violations of monotonicity in the small sample size conditions, they still exhibited problematic item characteristics from the perspective of scalability.
Low Scalability
Figure 2B shows the average scalability coefficients in each of the low scalability conditions. When low scalability was simulated for all examinees, the average item-level scalability coefficients were around Hi = 0 for all examinee sample sizes. Within the examinee location subsets, the average item-level scalability coefficients were relatively low (mean Hi around 0.20) in the low and high examinee location conditions, and slightly higher (mean Hi around 0.29) in the moderate examinee location conditions. This pattern persisted across all examinee sample sizes. Using Mokken’s (1971) criteria for evaluating item scalability, these values would be flagged as evidence of weak scalability (Hi ≤ 0.30).
Violations of IIO
Figure 2C shows the sensitivity of MSA tests for IIO in each of the IIO violation conditions. On average, the proportion of items with statistically significant IIO violations increased as examinee sample size increased; this result was true for all examinee location conditions. Across sample sizes, IIO violations were more readily detected when they occurred for the complete sample of examinees and among examinees with moderate locations compared to low or high examinee locations. As in the monotonicity problem item conditions, the average item-level scalability coefficients were lower than Mokken’s (1971) minimum critical value for scalability (Hi < 0.30) in all conditions (see Supplemental Appendix). This result suggests that even though the items were not flagged for statistically significant violations of IIO in the small sample size conditions, they still exhibited problematic item characteristics from the perspective of scalability.
Discussion
This research note explored the use of MSA to identify problematic item characteristics related to monotonicity, scalability, and IIO with relatively small sample sizes. Unsurprisingly, item-level indices of monotonicity, scalability, and IIO were most sensitive to problematic characteristics when they occurred for the complete sample and with larger sample sizes. However, scalability indicators were quite sensitive to all three types of problematic item characteristics when they occurred within examinee subsets. These results suggest that scalability analyses may be useful for identifying items that exhibit monotonicity violations, low scalability, and violations of IIO with small examinee sample sizes.
Altogether, the current results are in line with Straat et al. (2014) and Watson et al. (2018): The sensitivity of MSA indices improves with increases in sample size, and a minimum sample of N = 250 is generally sufficient to identify problematic item characteristics with adequate accuracy. However, whereas previous studies explored the accuracy of item scale assignment and scalability coefficients, the current study focused on item-level characteristics, including monotonicity, scalability, and IIO. Moreover, the current study considered the sensitivity of MSA indices when problematic item characteristics occurred within subsets of examinees. The current results suggest that MSA can detect subgroup-specific problematic item characteristics with small sample sizes (N ≤ 250) if researchers evaluate item quality using multiple indicators.
The major practical takeaway is that when small sample sizes are necessary, it is important to use several item-level indicators of measurement quality, rather than relying on single indicators, to identify items with problematic characteristics that may occur for subsets of examinees or for a complete sample. These results suggest that researchers who work with small samples can use MSA to identify items that may have compromised interpretations for some or all examinees. Small samples are often unavoidable in social science research, and MSA offers a variety of indicators that researchers can use to evaluate their items from the perspective of invariant measurement when other methods (e.g., parametric IRT) may not be appropriate, given sample size requirements.
Limitations and Directions for Future Research
Researchers should consider the conditions included in the current analysis before generalizing the current results to other measurement contexts. In particular, the simulation study conditions included a variety of problematic item characteristics, but these characteristics were simulated one at a time. Different items may exhibit different problematic characteristics, or the same items may exhibit multiple problematic characteristics. In addition, the simulation study did not focus on dimensionality considerations and the correct assignment of items to the appropriate latent variable. In future studies, researchers could consider these issues alongside the item characteristics included in the current analysis.
Supplemental Material
sj-docx-1-epm-10.1177_00131644211045347 – Supplemental material for Identifying Problematic Item Characteristics With Small Samples Using Mokken Scale Analysis
Supplemental material, sj-docx-1-epm-10.1177_00131644211045347 for Identifying Problematic Item Characteristics With Small Samples Using Mokken Scale Analysis by Stefanie A. Wind in Educational and Psychological Measurement
Footnotes
Declaration of Conflicting Interests
The author declared no potential conflicts of interest with respect to the research, authorship, and/or publication of this article.
Funding
The author received no financial support for the research, authorship, and/or publication of this article.
Supplemental Material
Supplemental material for this article is available online.
References
Supplementary Material
Please find the following supplemental material available below.
For Open Access articles published under a Creative Commons License, all supplemental material carries the same license as the article it is associated with.
For non-Open Access articles published, all supplemental material carries a non-exclusive license, and permission requests for re-use of supplemental material or any part of supplemental material shall be sent directly to the copyright owner as specified in the copyright notice associated with the article.