
Abstract
Adoption of new instructional standards in science demands high-quality information about classroom practice. Teacher portfolios can be used to assess instructional practice and support teacher self-reflection anchored in authentic evidence from classrooms. This study investigated a new type of electronic portfolio tool that allows efficient capture of classroom artifacts in multimedia formats using mobile devices. We assess the psychometric properties of measures of quality instruction in middle school science classrooms derived from the contents of portfolios collected using this novel tool—with instruction operationalized through dimensions aligned to the Next Generation Science Standards. Results reflect low rater error and adequate reliability for several dimensions, a dominant underlying factor, and significant relations to some relevant concurrent indicators. Although no relation was found to student standardized test scores or course grades, portfolio ratings did relate to student self-efficacy perceptions and enjoyment of science. We examine factors influencing measurement error, and consider the broader implications of the results for assessing the validity of portfolio score interpretations, and the feasibility and potential value of this type of tool for summative and formative uses, in the context of large-scale instructional improvement efforts.
Keywords
A wealth of research shows that instructional practices in the classroom are a better predictor of student achievement than teacher experience or degrees, and that improvements to teacher practice can have a considerable impact on students compared with other interventions (Kane & Staiger, 2012; Rockoff, 2004; Seidel & Shavelson, 2007; for recent challenges to this perspective, see, for example, Podolsky et al., 2019). A growing focus in studying the mechanisms relating teaching and learning within classrooms has renewed interest in the development of tools and instruments to systematically study instruction. From a measurement perspective, the construct instruction presents unique challenges as it requires examining how different types of knowledge and skill interact in context with various student, classroom, and social factors to influence the types, variety, and quality of the educational experiences offered to students in classrooms (Gitomer, 2009; Grossman & McDonald, 2008; Zeichner, 2012). A range of measurement tools have been used to derive indicators of instruction, including among the most notable teacher and student surveys, observation protocols, and teaching portfolios (Correnti & Martinez, 2012; Raudenbush & Sadoff, 2008). Building on our prior work, we developed a new type of electronic portfolio tool which can support efficient collection of multimedia evidence of classroom instruction through mobile devices. We report the results of a pilot validation study that examined first, the psychometric properties (i.e., reliability and validity) of indicators of quality instruction in middle school science classrooms derived from evidence in these portfolios, and second, the broader feasibility and potential of the portfolio tool to support summative and formative assessment of instruction.
Measuring Instruction using Teacher Portfolios
The properties and relative strengths of different methods and instruments for measuring instruction have been a persistent presence in the literature dating back more than half a century (Medley & Mitzel, 1963). The perceived gold standard is expert ratings based on standardized classroom observation rubrics (Cohen & Goldhaber, 2016), but used at scale, these present difficult choices between volume and quality of evidence, timeliness, depth, and scope of feedback (Knapp, 1997). Teacher and student surveys have gained popularity as a cost-effective alternative for collecting data about a broad range of aspects of instruction at scale from key actors (Desimone & LeFloch, 2004; Schweig, 2014). But survey self-reports are also subject to a variety of sources of measurement error, bias, and strong social-desirability effects, and are not well suited for capturing richer, qualitative aspects of instruction (Mayer, 1999). Various other methods attempt to balance depth and breadth of coverage, reliability, validity, bias, and cost-efficiency. For example, teacher logs (short surveys administered repeatedly) can improve reliability and address social desirability to better capture instruction over time (Rowan & Correnti, 2009). Instructional vignettes elicit situated descriptions and explanations of practice in realistic classroom scenarios (Stecher et al., 2006). Finally, tests of teacher pedagogical content knowledge (PCK) can be used to assess constructs closely related to instructional practices (Kennedy, 1999; see also Kersting, 2014, for more recent efforts to measure applied PCK using video prompts.)
Teacher portfolios have long been used for teacher induction and certification, and there is growing interest in using them to monitor and improve instruction at scale. Indeed, the two best known teaching portfolios in the United States (the National Board, and edTPA) are used to assess thousands of beginning and experienced k-12 teachers each year (see, for example, National Board for Professional Teaching Standards [NBPTS], 2019; Stanford Center for Assessment, Learning, and Equity [SCALE], 2018). As measurement tool, portfolios can provide a rich evidentiary basis to monitor instruction in context, offering richer information than surveys, at lower cost and with better coverage than observations (Authors, 2012; Ball & Forzani, 2009). Evidence from our own prior work and that of others suggests that portfolio instruments can support judgments about complex features of mathematics and science instruction with reliability comparable to that of classroom observations, and significant relation with classroom observation scores and student achievement (Authors, 2012; Borko et al., 2006; Matsumura et al., 2008).
Traditional teacher portfolios are not without significant drawbacks, however, ranging from the burden of collecting and annotating classroom artifacts, to logistical challenges for large-scale collection, handling, and review of portfolios, and psychometric challenges in deriving reliable and valid portfolio scores. A final and critical substantive limitation of paper-based portfolios has been the inability to reflect evidence of key aspects of live instruction, classroom interactions, and discourse. Modern computer technology is helping address some of these challenges; in particular, electronic portfolios are being increasingly used to compile multimedia evidence of instruction that can include not only documents but also images, audio, and video of live instruction (Strudler & Wetzel, 2011). In practice, the broad term e-portfolio comprises a range of tools and instruments with varying structures, underlying assumptions, and intended uses. Importantly, however, e-portfolios have been traditionally conceived as performance assessments: involving instructional projects that teachers develop, prepare, implement, and analyze over a span of months, anchored on a small number of critical pieces of evidence (e.g., a unit plan, test, and video of a lesson). This type of portfolio assessment requires extensive engagement from teachers over long periods, and has thus been limited to one-off use for certification or distinction (e.g., the Educative Teacher Performance Assessment, or NBPTS portfolios).
Continuing prior work with paper/pencil and electronic portfolios, for this study, we developed a new type of e-portfolio tool enabling middle school science teachers to efficiently collect rich multimedia evidence of instruction in their classrooms (i.e., documents, images, and video) using a tablet computer or other mobile devices. This tool is based on an alternative model that conceptualizes portfolios not as (optimal) performance assessments, but as detailed documentary records of authentic (typical) instruction (Shulman, 1998). Instead of completing extended essays explaining and reflecting materials and video from a specially prepared lesson, this model of portfolio asks teachers to collect a variety of classroom artifacts frequently and in site, trying to reflect instruction as experienced by students during an instructional unit or series of lessons. Implemented through modern mobile technology, the tool addresses important shortcomings of paper and pencil and other traditional electronic portfolios. First, teachers can capture rich evidence of live instruction and classroom dialogue typically out of reach in traditional paper portfolios. Second, compiling evidence in the portfolio is substantially more efficient, exploiting the capabilities of modern mobile technology to enable teachers to contextualize classroom artifacts using on screen survey prompts (or voice-to-text transcription for short-answer open-ended prompts). Third, portfolio collection and the measures of instruction derived have better coverage, may be more useful and informative (and thus support more valid inferences), as they relate to bodies of evidence covering an entire unit of instruction, or other realistic instructional period of interest. Finally, the process of systematically documenting and reflecting on day-to-day classroom practice over a period of time could hold particular value for supporting professional learning, compared with traditional portfolio performance assessments (Kloser, 2021).
We also developed a set of scoring rubrics to systematically assess the evidence contained in these e-portfolios against a model of instruction aligned to the Next Generation Science Standards (NGSS; National Research Council, 2012). The NGSS aim to address the excessive focus on contents, facts, and procedural manipulation in science education (Krajcik et al., 2014), offering exposure to realistic scientific experiences (Scruggs et al., 2013), and social discourse and literacy practices key to scientific knowledge (Latour, 1986; Lemke, 1990). Importantly, assessing the degree to which different features of this rich model of science instruction are present in a given classroom ideally requires considering evidence from different sources. Figure 1 maps evidence from multimedia artifacts captured in this novel portfolio tool to key features of classroom instruction and assessment in the NGSS.
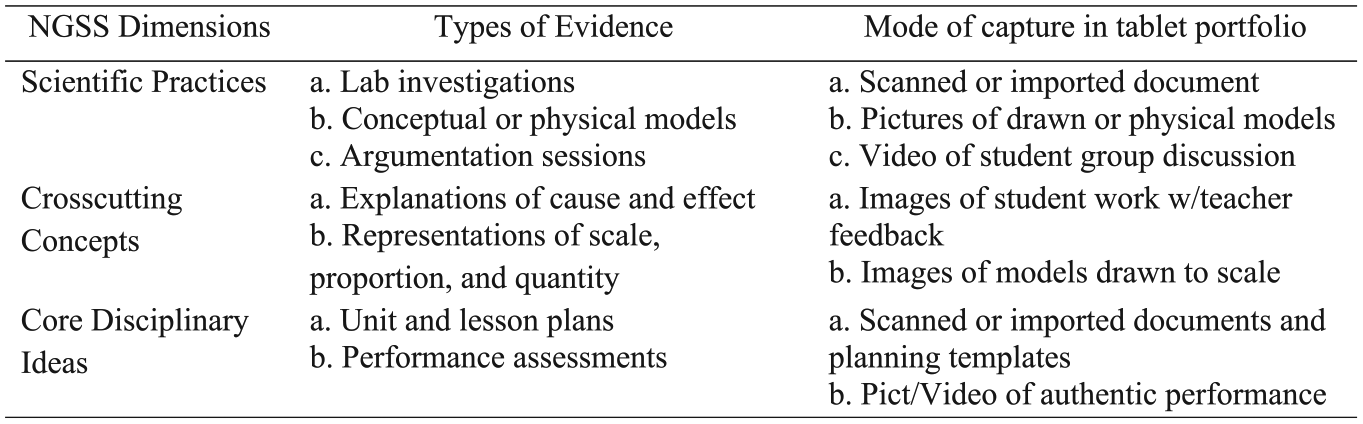
NGSS Instruction and Types of Evidence Captured by the Portfolio App.
We conducted a pilot validation study to examine the reliability and validity of scores derived from the evidence contained in portfolios collected by a sample of middle school science teachers. As with other measures that rely on human judgments of complex behavior, portfolio-based measures of instruction can be affected by significant measurement error from inconsistencies across judges (i.e., portfolio raters)—or in the contents of the portfolios themselves. Specifically, we investigated the following research questions:
In the closing section, we consider the psychometric findings in the context of a broader validation argument (Kane, 2006) that considers the accuracy of judgments about the quality of instruction, their relation to concurrent indicators, and predictive power on student outcomes, along with the potential formative value of the tool for supporting professional learning, and it feasibility for supporting efficient use on a large-scale by individuals and groups.
Method
Participants and Procedures
Sample
In total, 31 eighth grade science teachers in a large urban school district in southwestern United States participated in the study. Half of the placement schools served predominantly Latino students (85%–99%), and the remaining schools served mixed student populations. About 70% of participating teachers were females, half held bachelor’s degree, and half a master’s degree or more. On average, teachers had 11 years teaching experience and 9 years teaching science. Most teachers taught on a regular schedule (only six taught block schedules). In addition to participant teachers who collected portfolios, we recruited five experienced middle school science teachers who were trained and served as portfolio raters.
Portfolio Software
We developed a new type of e-portfolio tool based on a general purpose open-source software platform for distributed data collection in mobile devices (Tangmunarunkit et al., 2015). The e-QIS portfolio app (Quality Instruction in Science) enables teachers to efficiently capture multimedia artifacts as evidence of planning, instructional delivery, and assessment in their classroom using an Android or iOS phone or tablet (University of California, Los Angeles, 2018). Teachers use the app installed in their phone or tablet device to upload artifacts reflecting important aspects of instruction they want to reflect in their portfolio. These can include a variety of documents, and files, images, and short video clips stored in their device or online (e.g., google drive, box), each contextualized upon capture using a combination of multiple choice, and open-ended questions completed via the screen, keyboard, or voice recognition/transcription. Because the app is often used in classrooms during instruction, teachers are able to temporarily store artifacts in a parking lot, to complete the annotation prompts and upload at a later time. A companion web-based portal allows storing, organizing, and editing the contents of electronic portfolios—other authorized users (e.g., portfolio raters, teacher educators) are also able to review and input comments and feedback for teachers. Figures 1 to 3 in the supplemental appendix present screen captures of the portfolio app dashboard, sample prompts used to annotate artifacts for upload, and the web portal—interested readers can refer to the online documentation or the researchers for further detail and to download the app (see University of California, Los Angeles, 2018).
Portfolio Collection
Portfolios were structured around a 10-day sequence of lessons (a typical science unit) as the conceptual unit of collection and analysis of evidence of instruction. Teachers used the app to document two instructional units from the eighth grade California Science Standards, each comprising approximately 10 days of instruction (or equivalent in block schedules) in physics or chemistry in fall and spring. 1 Portfolio collection guidelines required that teachers collect (a) initial reflections and artifacts to offer context about their class, their students, and the science unit covered in the portfolio, (b) at least one instructional artifact and one assessment artifact for 10 consecutive days of instruction, or 6 days for block schedules, and (c) concluding reflections and artifacts at the end of the unit. We defined instructional artifact as any document, image, or video clip with relevant evidence of instructional planning, content, or delivery, whereas assessment artifacts were samples of student work (also in any format) used to gauge student learning or progress.
Portfolio Scoring
Training for raters spanned 2 days; on the first day, they became familiar with the portfolio app and web portal, the dimensions of science instruction, and the evidence in the portfolios in relation to each dimension. Raters also discussed and scored a first training portfolio in pairs, and reviewed the evidence for their ratings against master ratings with the research team. On the second day of training, raters independently scored two teacher’s portfolios, and discussed their ratings for all dimensions in relation to the evidence in the portfolio and master ratings provided by researchers. In our study, each rater scored a total of 24 portfolios (on average 12 teacher portfolios from physics units and 12 from chemistry units), and each teacher received ratings from two or three raters, organized in an incomplete crossed (or matrix) design depicted in Table 1. Raters were able to review and score the contents of the portfolios remotely from their computers, using the web portfolio portal. Portfolios took on average 90 to 100 minutes to score, with raters spending an average total of 36 hours scoring, spread over 3 to 4 weeks.
Scoring Design. Raters Randomly Assigned to Physics and Chemistry Portfolios.

Measures
Portfolio Scores
Alongside the software tools described earlier, we developed a detailed conceptual model comprising four domains and 11 dimensions of instruction aligned to the NGSS framework, with input from a national advisory group of educators and science education experts. For each dimension, we also developed scoring rubrics mapping portfolio contents to instructional practices of different levels of quality or rigor on a 5-point scale (1 = Not Realized to 5 = Fully Realized). Figure 4 in the supplemental appendix presents the complete set dimensions as defined in the scoring rubrics. 2 We also developed detailed training materials and examples relating the varying images of instruction depicted in the rubrics to different types of multimedia evidence contained in a portfolio—for example, assessing the extent to which students develop and investigate their own scientific questions might bring together evidence from a lesson plan, worksheets, pictures of physical models constructed by students, and a short video of a group discussion tied to a lab or investigation.
A total of N = 31 teacher portfolios were scored by multiple trained raters on all 11 dimensions and a summary rating reflecting overall quality of instruction aligned to the NGSS model. A subset of 25 teacher portfolios additionally received consensus master scores from the research team for comparison to trained rater scores. Raters also kept detailed record of the evidence they used to assign scores—for example, a rater may find evidence relevant to assess Dimension 4 (Engaging Students in Productive Talk) from artifacts collected on Days 1 to 4, 6, 9, and 10. These records were then systematically quantified and coded to reflect the volume and types of evidence raters reviewed in assigning scores to each dimension.
Teacher Self-Efficacy
Each participant teacher completed a survey inquiring about a range of teacher background characteristics, education, experience, and attitudes, as well as the types of instructional models and practices they use in their science classrooms. The survey also measured teacher perceptions of self-efficacy on the same 11 dimensions of science instruction in the model above. The indicators derived from this survey were used to assess the concurrent relationship of portfolio scores to constructs of pedagogical practice, and self-concept, which an extensive literature shows are related to quality of instruction (for a review, see Zee & Koomen, 2016).
Assessing Teacher Learning About Science Teaching (ATLAST) Scores
Participant teachers completed two assessments of PCK in physics and chemistry before completing portfolios in each subject. The ATLAST test was developed to capture domains of teacher knowledge theoretically closely related to instructional practice (Smith, 2010). We derived number-correct scores in each test as concurrent criterion indicators hypothesized to relate to portfolio ratings of quality instruction.
Student Outcomes
To more thoroughly assess the claim that indicators of instruction derived from portfolios can predict valued student outcomes, we collected three different types of variables as criterion measures. First, the district provided scores on the eighth grade state science test, and seventh grade mathematics scores the previous year as covariates; whereas common in the literature, standardized test scores are typically not aligned to curriculum or very sensitive to instruction (Ing, 2018). As a complementary criterion measure, we also collected course grades assigned by teachers at the end of the school year, which are often suspect on reliability grounds, but can be predictive of broader achievement, especially for some groups of students (Pollio & Hochbein, 2015). Finally, students in participating classrooms completed a survey inquiring about their instructional experiences in the class, as well as their attitudes and perceptions of self-efficacy in science learning, and enjoyment of science which have been widely shown to be important mediating outcomes for science achievement (see, for example, Schunk, 1989). In total, we collected survey data from 768 students in 30 classrooms.
Debriefing Interviews
We conducted structured debriefing interviews with participant teachers after completing each portfolio to gather information about the process of artifact collection, relative ease or burden, clarity of the annotation prompts, missing information to be collected, among others, along with user feedback to help enhance the software tools. In addition, the interviews asked teachers to reflect on the potential value of the portfolio collection process for informing their professional self-reflection and improvement. Finally, we also conducted exit interviews with participant raters to collect evidence about the process of portfolio review and scoring, the clarity and consistency of the scoring rubrics, and the cognitive load of specific types of artifacts in relation to these rubrics.
Analytic Approach
We used a set of complementary psychometric and statistical analysis techniques to assess the measurement properties of indicators of science instruction derived from the electronic portfolio tool. In a validity argument framework, these are claims that portfolios can be scored to make reliable distinctions among teachers, measure common dimensions of instruction, and correlate or predict other concurrent indicators and outcomes as expected.
We used a series of generalizability models to understand the sources of measurement error influencing portfolio scores, and the reliability of aggregate scores assigned by raters. We estimated inter-rater agreement indices and error variance components in portfolio scores using MINQUE estimation in SPSS Version 24 (Shavelson & Webb, 1991). These G-studies follow a two-facet design with teachers as object of measurement and raters and topics as the facets of measurement (sources of error). The design (denoted p x r x t) isolates true score (teacher) variance, error variance across raters and topics (
Correlational analyses investigated concurrent and predictive validity of portfolio ratings. Measures included master consensus scores assigned to portfolios by the research team, teacher scores in the ATLAST test of PCK, and indicators of instruction and self-efficacy derived from teacher surveys. Multilevel models investigated how portfolio ratings related to three different student outcomes: state science test scores, course grades, and survey indicators of self-efficacy and interest in science. Models were estimated in the HLM software Version 7.0 (Raudenbush & Bryk, 2002) to take into account the clustered structure of the data. Finally, we undertook qualitative analyses of portfolio contents and interviews with participant teachers and raters to investigate the feasibility and perceived value of the portfolio tool.
Results
Table 2 presents descriptive analysis for portfolio ratings of the 11 dimensions of science instruction—the 12th dimension is an overall holistic assessment of the degree to which the evidence in the portfolio reflects instruction consistent with our NGSS-aligned model. Ratings were highest for Dimension 4 (accuracy), and lowest for Dimension 10 (feedback); these two dimensions have very skewed distributions and low variation, suggesting strong floor and ceiling effects. Overall, ratings were slightly higher (3.1) for physics than for chemistry (2.79); both ratings were slightly higher than simple average scores across the 11 dimensions (2.95 and 2.61, respectively). Reviewing scores by subtopic shows variation associated to the match between science content and certain dimensions—for example, portfolios covering topics related to atoms and periodic tables received lowest scores in Dimensions 6 and 7, likely reflecting the difficulty of implementing instruction that emphasizes student-driven experimentation and data analysis in those topics. The arithmetic average of the 11 dimensions is slightly lower than the overall quality rating (D12), suggesting that raters did not equally weigh evidence from all dimensions for assigning a holistic rating—this gap widens if Dimensions 4 and 10 are eliminated.
Descriptive Statistics of Portfolio Ratings by Topic (Across Teachers and Raters).

Reliability/Generalizability
Table 3 presents agreement indices (exact and within-1) for each of the 11 dimensions in the model of instruction. Exact agreement ranges from a low of 28% (D11: Using Information) to 78.4% (D4: Accuracy). Agreement indices within 1 point in this 5-point scale are naturally much higher—in the 70% to 90% range. The table also presents the results of generalizability studies of portfolio scores of each dimension. Because of differences across topics noted above, these models treat topics as a fixed rather than random facet. The table shows variance components for teachers, raters, and error—averaging together results from the physics and chemistry portfolios. Across dimensions, systematic differences in rater stringency (
Generalizability Study Results by Dimension (Topic as a Fixed Facet).

Dimensionality
We found robust correlations in the .3 to .8 range between ratings of the 11 dimensions of instruction. However, an EFA of all portfolio ratings showed that a unidimensional solution was relatively weak fit (RMSEA = 0.21, χ2 = 103.5, p < .000). 3 Fit improved after removing accuracy and feedback, the two dimensions with lowest variance and reliability in Table 3 (RMSEA = 0.12, χ2 = 74.9, p < .05). Average item-factor correlations observed in this solution were .57, with 42% of the total variance accounted by the first factor. Two- and three-factor solutions, while a marginally better fit to the data, show a considerable amount of cross loadings, and they are difficult to reconcile with expected patterns of relationship among domains of instruction.
Concurrent and Predictive Relation With Other Measures
Table 4 presents correlations for scores assigned to a subset of portfolios (N = 25) by trained raters and consensus master scores assigned by the research team. The average scores are similar for most dimensions, and the correlations generally show substantial convergence among rater and master scores with the exception of accuracy and feedback—the two dimensions with limited variation discussed previously. The table finally shows a moderate to high correlation between the portfolio ratings and the number of pieces of evidence recorded by the raters across the 10 days of collection, suggesting that the volume of evidence collected was a significant driver of rater scores.
Descriptive Statistics and Correlations for Raters and Master Scores.

Table 5 shows limited convergence of portfolio ratings with teacher scores in the ATLAST test of PCK; only Dimensions 1 (Eliciting initial student thinking) and 11 (Using information to improve teaching) showed significant correlations with ATLAST scores in physics, and no significant correlations were observed with chemistry portfolio ratings. Portfolio ratings for Initial Thinking (D1), Productive Talk (D3), Scientific Investigations (D6), and Overall (D12) were significantly associated to teacher reports of self-efficacy for teaching students with different levels of achievement, learning disabilities, and limited English proficiency. A number of additional correlations in the same direction were not significant, which may reflect in part low reliability of some portfolio ratings, and limited statistical power of the final sample of portfolios included in the analyses (n = 27–30). Interestingly, negative correlations were observed for portfolio ratings of Support of Diverse Leaners (Dimension 2) and all indicators of teacher self-efficacy. Although not statistically significant, the consistent direction of these coefficients across the board could suggest that teachers working the hardest to serve their diverse students also perceive the highest barriers to effective teaching and learning.
Correlation Between Portfolio Ratings, ATLAST Scores, and Teacher Self-Efficacy Reports.

Note. ATLAST = Assessing Teacher Learning About Science Teaching; NGSS = Next Generation Science Standards.
Average scores across both subject portfolios and raters. bAverage scores for physics portfolio across raters. cAverage scores for chemistry portfolio across raters. *p < 0.05.
Table 6 shows a number of significant correlations between portfolio ratings of two dimensions (Ways of Knowing and Scientific Investigations) as well Overall portfolio ratings, and aggregate student survey reports of instructional practices. Specifically, higher portfolio ratings consistently relate to students reporting more frequent engagement with a range of NGSS-aligned practices, including discussing scientific ideas in groups, planning experiments, real world modeling/design, explaining scientific claims, among others. This pattern of convergence is observed across 12 NGSS-aligned instructional practice items, and is reinforced by nonsignificant correlations with items that capture divergent instructional practices (e.g., memorizing vocabulary, teacher lecturing, carrying out experiments planned by the teacher).
Correlation Between Portfolio Ratings and Student Survey Reports of Instruction.
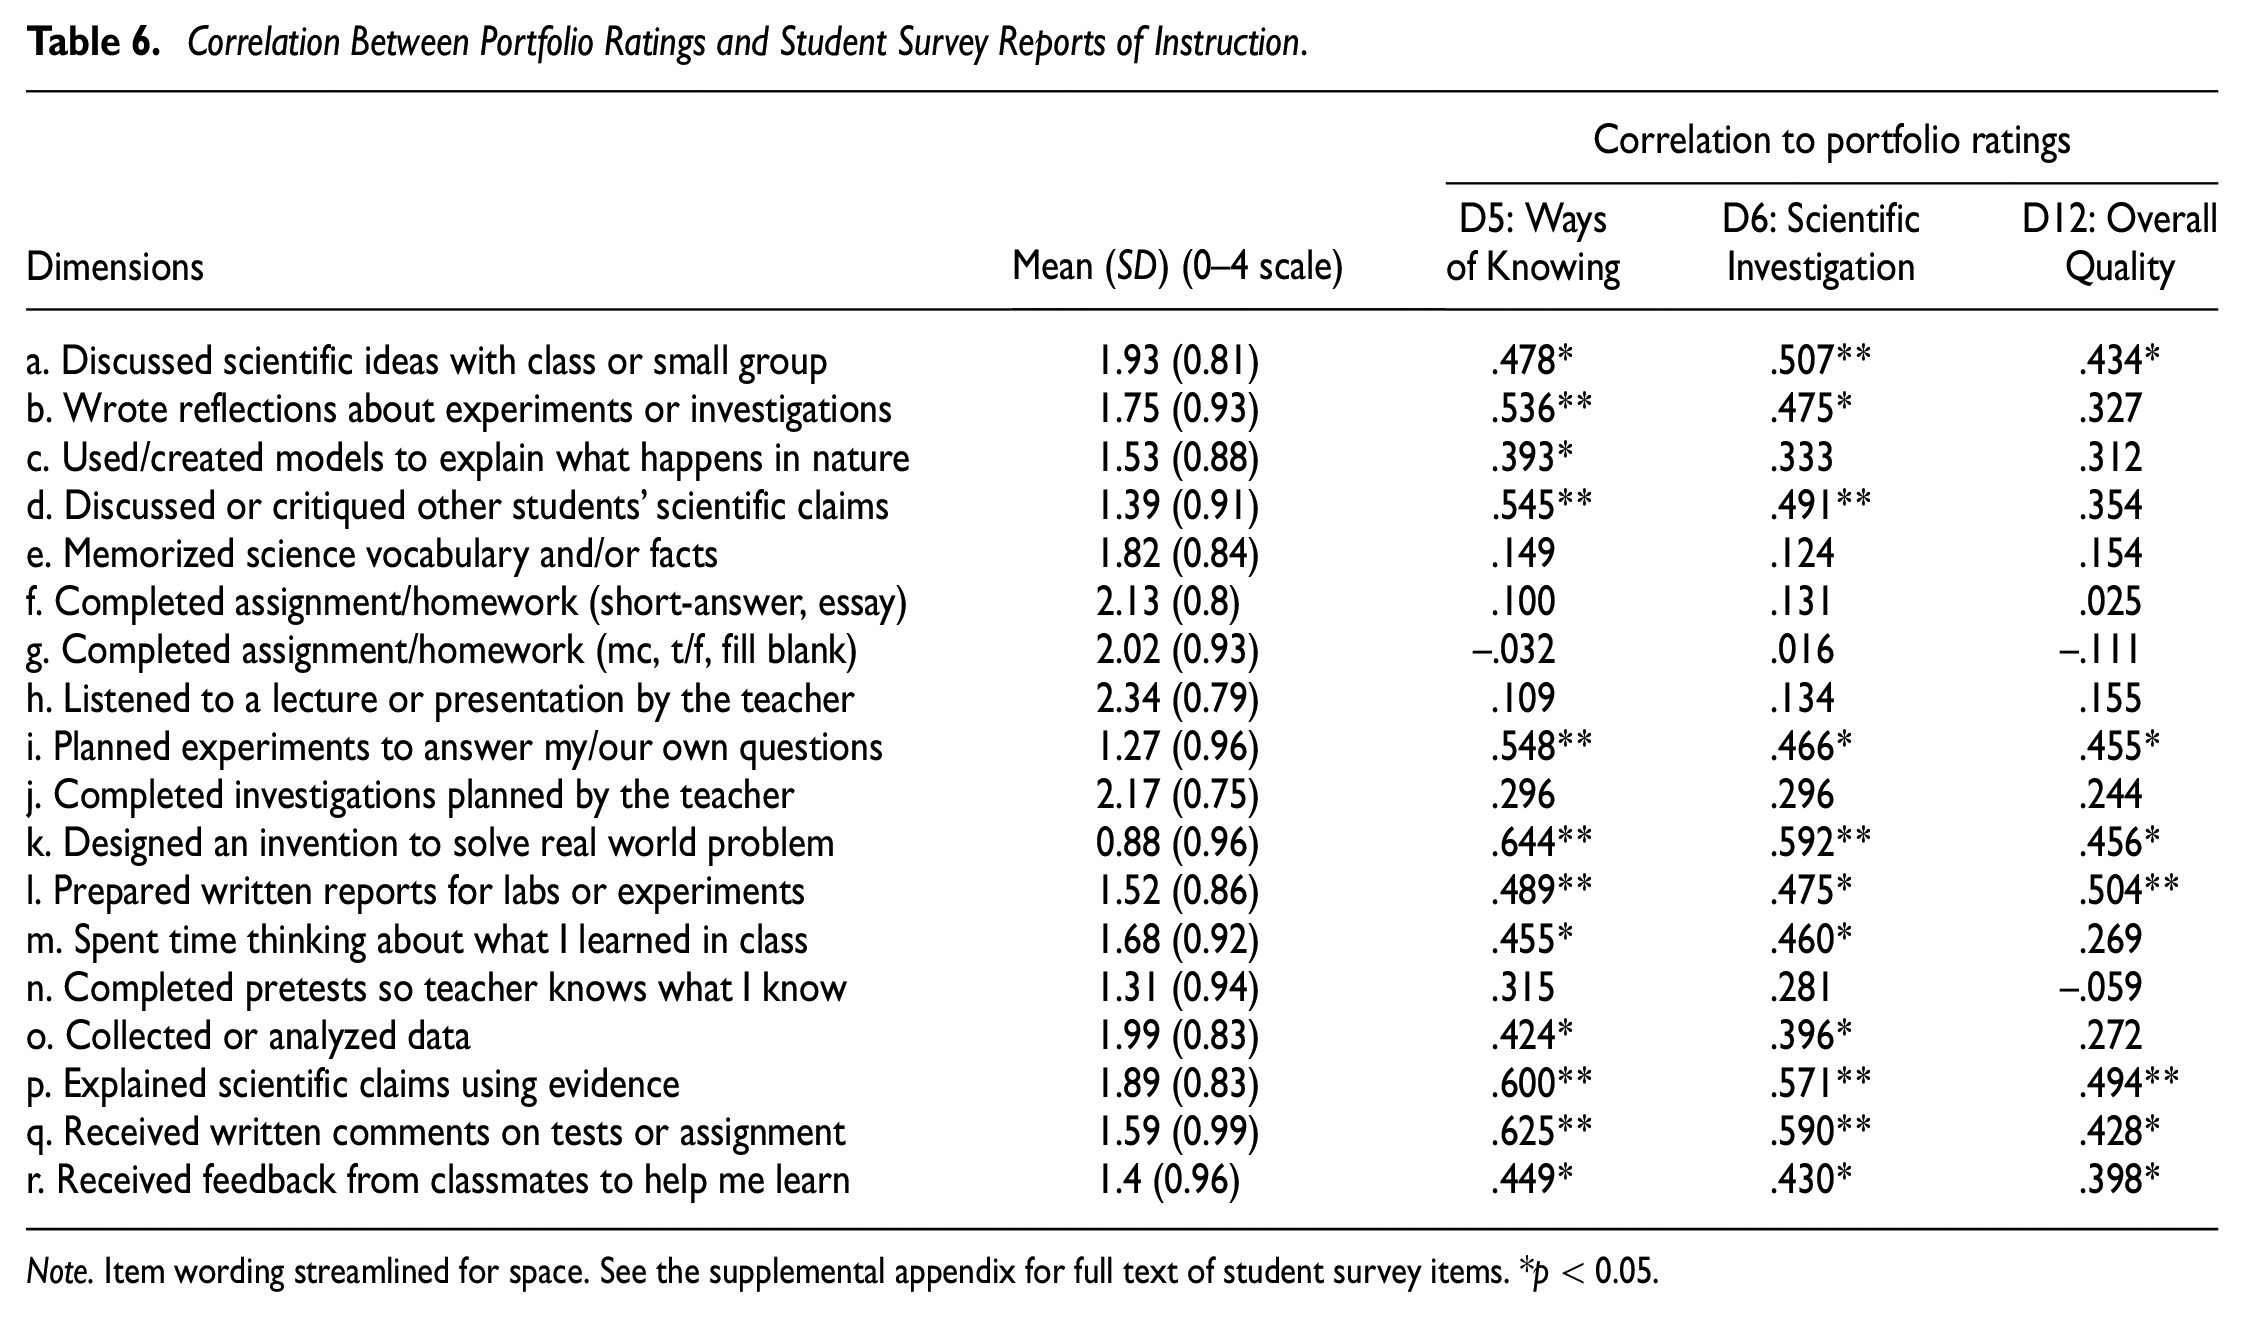
Note. Item wording streamlined for space. See the supplemental appendix for full text of student survey items. *p < 0.05.
Table 7 presents the results of multilevel linear models investigating the relationship between portfolio ratings of science instruction and three types of student outcomes. The results in the table showed no relationship between portfolio ratings of any of the 11 dimensions of instruction (or Overall Quality ratings), and either student scores in the state’s eighth grade standardized science test, or course grades assigned by the teacher at the end of the year—to adjust for preexisting differences in student achievement across classrooms, the models include student scores in the seventh grade state mathematics test as covariates (there is no state science test in seventh grade). Interestingly, portfolio ratings of two closely related dimensions (Scientific Investigations and Data Analysis) were positively associated to a composite indicator of student self-efficacy and enjoyment of science. This is consistent with growing evidence of positive effects of student-driven scientific investigation on student engagement in science (see, for example, Hushman & Marley, 2015).
Hierarchical Linear Models Relating Portfolio Ratings to Three Student Outcomes a .

Separate models estimated for each dimension, models summarized in one table for purposes of space.
A final set of analyses investigated the quality of evidence collected by teachers in portfolios as the basis for portfolio scoring. We asked portfolio raters to tally the number of pieces of evidence in a portfolio relevant for scoring each dimension of instruction. Based on these tallies, a typical portfolio had 12 pieces of evidence related to Multiple Ways of Knowing (D5), and seven pieces for Providing Feedback (D11), but less than two pieces of evidence relevant for Eliciting Student Initial Thinking (D1), and no evidence at all for Accurate Content Knowledge (D4). However, the volume of evidence collected was only weakly related to the reliability of the scores—a correlation of .29 and .19, respectively, for the physics and chemistry portfolios. Moreover, rater notes and debriefing interviews indicate that for some dimensions (e.g., Multiple Ways of Knowing, Data Analysis) raters found artifacts with relevant evidence on most or all days covered in the portfolio, whereas for other dimensions (e.g., Initial Thinking, Accurate Content Knowledge) evidence was much more sparse. Rating reliability was moderately related to the percentage of days with evidence (.33–.45 across dimensions) suggesting that this, more than the total number of artifacts, was important for informing reliable ratings.
Discussion
For this study, we developed an electronic portfolio app for mobile devices that enables teachers to compile, review, and store high quality, context-rich evidence of instruction in science classrooms. This overcomes key limitations of traditional portfolios and contributes to research in the measurement of instructional practices in several important ways. First, multimedia capabilities allow the portfolios to compile evidence of critical live and interactive aspects of instruction like eliciting and building on student thinking (e.g., Windschitl et al., 2012) and facilitating argumentative discourse (e.g., Kuhn, 2010). Second, interactively collecting and annotating evidence in site, in a familiar handheld device using screen survey prompts and voice-to-text reduces the burden of portfolio collection for teachers, and can improve the quality and granularity of evidence collected. Third, the app and accompanying web portal can substantially reduce the logistical challenges of large-scale portfolio collection, management, and storage. Finally, on the substantive side, this project contributes a formalized tool and set of rubrics for measuring instruction aligned to the three-dimensional framework set forth by the NGSS.
As a measurement instrument, the portfolio app is intended to support reliable and valid inferences about the quality of instruction in middle school science classrooms, and this study aimed to provide initial evidence to support a validity argument for the measures derived. We hypothesized that trained raters using detailed portfolio scoring rubrics would be able to produce scores that reliably reflect important aspects of quality instruction in science aligned to the NGSS, and relate to expert ratings of the same portfolios, to other measures of instructional practice, and to variation in student outcomes. The study produced mixed but promising results. For a number of dimensions (and Overall Quality judgments), generalizability coefficients were adequate or strong, indicating that portfolio ratings may be able to reliably differentiate instruction of varying levels of quality. However, for several other dimensions, reliability was low and decidedly outside range for high-stakes (and even low-stakes) uses. For two dimensions (accuracy and feedback), low levels of reliability did not arise from rater error, but instead low score variance reflecting uniformly high or low scores. Upon closer inspection, this revealed misalignment between the rubrics and the contents of the portfolio—the rubrics aimed too low for one dimension, and little to no evidence was collected in portfolio for the other. These results highlight challenges faced by teachers in documenting certain kinds of practices (e.g., most portfolios contained little to no evidence of verbal feedback) and by extension the importance of offering detailed guidelines and expectations for fidelity of collection to teachers for compiling evidence into their portfolios. The results overall also suggest that effectively documenting some key aspects of instruction require consistent and detailed collection of classroom artifacts, and certain types of artifacts in particular. For example, teachers may be instructed to collect pictures of assignments or assessments to capture written feedback, and short video artifacts that specifically reflect verbal feedback.
Examining the daily evidence raters considered in assigning scores to portfolios offers an interesting look into the process of evaluating portfolio evidence in relation to scoring rubrics. Rater logs and exit interviews suggest trained raters did not systematically tally, but instead mentally compiled or aggregated the entirety and variety of multimedia evidence captured in a portfolio over 2 weeks, which was then weighed to assign high inference scores to portfolios. This approach to scoring represents a substantial cognitive challenge, and is susceptible to inconsistency and thus measurement error, as some pieces of evidence will inevitably be weighted differently by different raters, in relation to some dimensions and scoring rubrics. On the contrary, a different approach using lower-inference daily scores would present their own challenges and sources of inconsistency, as it would force raters to consider artifacts in isolation from the broader context reflected in the portfolio. The advantages and disadvantages of these approaches to handle multiday evidence from artifacts require much additional research. In a project currently under way, we are investigating the reliability of ratings of portfolios configured to cover units of different lengths (for another example, see Meyer et al., 2011).
Our findings point to a unidimensional structure underlying portfolio ratings (excluding the two dimensions with extremely very low variance). This is of course not surprising considering the deep conceptual connections between the dimensions of instruction in our NGSS model, and their close interdependency when enacted in practice in classrooms. In terms of convergence with other measures, we found strong correlations between portfolio scores assigned by raters and expert master scores, but limited convergence with other measures of instruction collected from teachers, including ATLAST PCK scores, and teacher self-efficacy, and reports of instruction. However, we found substantial convergence between student reports of NGSS-aligned instruction and portfolio ratings of two key dimensions in our model (Ways of Knowing and Scientific Investigations) as well as the Overall Quality portfolio rating. Divergent correlations are not significant for a number of non-NGSS practices, providing further evidence that this is not a case of a single strong correlation and a halo effect. Finally, we also found significant relationship between these portfolio ratings, and higher student enjoyment of and better attitudes about science and science learning.
There was no relation between portfolio ratings, student test scores, and course grades. This could reflect a small sample size, but also likely restriction of range in instructional practices (teachers were a select group of volunteers from one district), and of the criterion measures themselves—lack of alignment and sensitivity for test scores, reliability and endogeneity for course grades. Additional work is needed to adjudicate these shortcomings to issues of portfolio design, structure, and guidelines for consistent evidence collection, rubric design, and rater training. Subsequent study using refined instruments and a larger sample of teachers more experienced with both portfolios and NGSS instruction would help clarify these results.
This study contributes to our understanding of key issues in the burgeoning subfield of measurement that focuses on the development of reliable and valid indicators of instruction for purposes of instructional improvement and accountability in science and other areas in k-12 and higher education (see, for example, Ing, 2017; Polikoff et al., 2020; William T. Grant Foundation et al., 2015). Our findings add to a growing body of evidence that support a validity argument for portfolio use that rests on evidence that these instruments can offer a robust evidentiary basis to support reliable judgments about the quality of instructional practices in STEM subjects, and that they relate to other measures of instruction, and some valued student outcomes. Much more research is needed to investigate specific validity arguments for these scores, for specific uses and contexts. Of particular interest are differences in the requirements for high-stakes summative inferences and uses (e.g., certification or evaluation), compared with lower-stakes formative uses (see, for example, Ing et al., 2020).
A final set of considerations relates to the feasibility and practical value of using this type of tool in practice. On one hand, thoroughly compiled and annotated evidence of instruction is needed for portfolios to be scored reliably. On the other hand, the burden that portfolio collection imposes on teachers can be substantial—debriefing interviews indicate that participant teachers invested 10 to 20 hours collecting a complete portfolio. Importantly, though still significant, this is a qualitatively different type of time commitment relative to well-known portfolio performance assessments used for teacher certification. By comparison, the NBPTS portfolio can require hundreds of hours and extend over months (and sometimes years), and the edTPA portfolio still requires dozens of hours and potentially months to complete.
Portfolio assessments such as those are simply too onerous for frequent real-world usage, and thus commonly limited to major barrier reviews like teacher certification (edTPA) or professional distinction (NBPTS). Importantly, however, portfolios can be alternatively conceived as documentary records reflecting authentic classroom practice over a period of time (Shulman, 1998), and used formatively outside of high-stakes professional evaluation structures. In this model, portfolios are crucially not passive data collection instruments, or exhaustive teaching performance assessments, but powerful platforms for sustained teacher intellectual engagement and fruitful professional reflection around instruction (Stefani et al., 2007).
Indeed, qualitative analyses of participant teacher and rater interviews suggest that portfolio collection (and portfolio scoring too) are cognitively rich and demanding tasks that required both groups to reflect on their own instructional practices, and ultimately led to shifts in perceptions of self-efficacy. Interestingly, in subsequent work with teachers using the portfolio platform, participants also highlighted the value of joint discussion around artifacts and portfolios in the context of professional learning communities (Kloser). Thus, a more nimble and efficient type of portfolio tool could enable realistic implementation of systems of professional reflection and development organized around classroom artifacts. In this context, the time spent compiling and annotating evidence in a portfolio is not merely a data collection burden, but instead the main avenue for engagement in professional reflection, discussion, and learning (Darling-Hammond et al., 2017).
Thus, while the psychometric properties of portfolio scores reported here would not support their use for high-stakes summative assessment of instructional practice, the preliminary evidence of reliability and validity presented in this study suggests that the tool could hold promise for formative assessment of classroom instruction and teacher practice. From a measurement perspective, the development of more efficient portfolio tools can address a critical need in education systems, enabling efforts to systematically monitor and improve instructional practice, and use consistent evidence to inform the professional development of teachers. One way to assess the cost-benefit of this type of tool is to consider the amount of time that would be required for an outside observer to collect a volume of evidence comparable with that of a portfolio—and to note that the body of evidence collected would likely be less nuanced and revealing than that compiled by the teacher in this portfolio model. More broadly, efficient portfolios that yield granular, richly contextualized indicators of instruction could also help educators build the knowledge base correlating student learning outcomes and instructional practices and strategies teachers implement in the classroom (Correnti & Martinez, 2012). Beyond measurement considerations, an extensive body of research suggests that teachers need time and support to align their instruction to the NGSS, and that this process requires extensive analysis and reflection based on multiple sources of information and evidence of instruction (Allen & Penuel, 2015). Evidence from this and other studies suggests that electronic portfolios can support reflection around classroom artifacts for individual teachers and professional learning communities (Kloser, 2021). Much research is still needed to investigate the potential uses and value of this type of modern electronic portfolio tool in this context.
Supplemental Material
sj-pdf-1-epm-10.1177_00131644211064923 – Supplemental material for Developing Situated Measures of Science Instruction Through an Innovative Electronic Portfolio App for Mobile Devices: Reliability, Validity, and Feasibility
Supplemental material, sj-pdf-1-epm-10.1177_00131644211064923 for Developing Situated Measures of Science Instruction Through an Innovative Electronic Portfolio App for Mobile Devices: Reliability, Validity, and Feasibility by José Felipe Martínez, Matt Kloser, Jayashri Srinivasan, Brian Stecher and Amanda Edelman in Educational and Psychological Measurement
Footnotes
Declaration of Conflicting Interests
The authors declared no potential conflicts of interest with respect to the research, authorship, and/or publication of this article.
Funding
The authors disclosed receipt of the following financial support for the research, authorship, and/or publication of this article: Support for this project was provided by the National Science Foundation (DRL-REAL 1420252).
Supplemental Material
Supplemental material for this article is available online.
Notes
References
Supplementary Material
Please find the following supplemental material available below.
For Open Access articles published under a Creative Commons License, all supplemental material carries the same license as the article it is associated with.
For non-Open Access articles published, all supplemental material carries a non-exclusive license, and permission requests for re-use of supplemental material or any part of supplemental material shall be sent directly to the copyright owner as specified in the copyright notice associated with the article.