
Abstract
Differential item functioning (DIF) is often used to examine validity evidence of alternate form test accommodations. Unfortunately, traditional approaches for evaluating DIF are prone to selection bias. This article proposes a novel DIF framework that capitalizes on regression discontinuity design analysis to control for selection bias. A simulation study was performed to compare the new framework with traditional logistic regression, with respect to Type I error and power rates of the uniform DIF test statistics and bias and root mean square error of the corresponding effect size estimators. The new framework better controlled the Type I error rate and demonstrated minimal bias but suffered from low power and lack of precision. Implications for practice are discussed.
Keywords
Access to unbiased, equitable testing in education is critical to maximizing outcomes for all students (U.S. Department of Education, 2007). In modern educational models (e.g., response-to-intervention), testing is used to screen students who may be at risk of academic difficulties, select appropriate instructional activities, monitor student progress and responsiveness to instruction, evaluate eligibility for special education or other services (e.g., English learner services), and evaluate program effectiveness, among other purposes. Using test scores that are not adequately supported by reliability and validity evidence may have serious consequences, such as students not receiving federally mandated services for which they are eligible, or misallocation of resources away from students with the most significant educational need. Conversely, appropriate testing practices can promote inclusive educational environments and equity, and diversity in the classroom. Evaluating assessment practices to ensure they operate as intended and yield fair, unbiased outcomes is thus paramount.
Validity Evidence to Support Use of Alternate Form Test Accommodations
Assessment accommodations facilitate access to testing for diverse children with unique educational needs. According to Salvia et al. (2017), assessment accommodations can alter the way test materials are presented, the way students respond to the test, the setting in which the test takes place, and the timing of the test. One particularly common assessment accommodation is the use of alternate test forms (e.g., oral tests for children with visual impairments, translated tests for English learners). In establishing validity evidence to support the use of these alternative forms, a necessary (albeit, insufficient) step is to evaluate whether the items function in the same way (measure the same construct and are on the same scale) as the original items. Evidence to the contrary reflects differential item functioning (DIF).
Evaluating DIF is critical to supporting the use of alternate form test accommodations. For example, analyses of DIF can be performed to evaluate whether translated items function similarly to the original items (e.g., Petersen et al., 2003). However, traditional approaches for evaluating DIF are confounded by the threat of selection bias—differences between groups on variables other than the test form that was administered. An alternate form item may be more difficult, not because there is an issue with the accommodation but because the two groups differ on construct relevant (e.g., exposure to the content being tested) or irrelevant (e.g., socioeconomic status [SES]) variables. Failure to control for selection bias when evaluating DIF could result in discarding well-functioning items that are costly to develop and replace or retaining poorly functioning items that introduce bias into the testing process.
Assignment to alternate test forms is often not random. Instead, students are typically assigned based on need. For example, all students who may qualify for services as English learners must receive an English language proficiency assessment at the beginning of the school year (Lhamon & Gupta, 2015). Although there are no federally mandated standards related to assessment for English learners, best practice promotes the use of accommodations to minimize the likelihood that limited English proficiency influences performance on the assessment. One such “direct accommodation” is to provide the assessment in students’ home language (Pitoniak et al., 2009).
In educational practice, schools and districts should rely on more information than a single screener for determining accommodations. However, Aikens et al. (2020) highlight the challenges that large-scale research studies face when determining need for accommodations as research project personnel typically do not have detailed knowledge of individual children for determining their assessment needs, and many children must be assessed within a short period of time. Consequently, the use of a single cut score, although not ideal, often represents the most feasible approach to determining accommodations in the context of large-scale research studies. Indeed, the practice of using an English language proficiency screener to determine assignment to assessment language has been used in large, federally funded survey studies, including the Early Childhood Longitudinal Study, Kindergarten Class of 1998–1999 (ECLS-K; Rock & Pollack, 2002), Kindergarten Class of 2010–2011 (ECLS-K:2011; Najarian et al., 2018), and Birth Cohort (Najarian et al., 2010). Specific information on data collection procedures for the Kindergarten Class of 2023–2024 (ECLS-K:2024) are not available, but current plans include the use of an English language screener, presumably to route multilingual children to the English or Spanish version of the assessments, as necessary (U.S. Department of Education, 2021). Other large-scale research studies that have used single indicators of English proficiency for routing children through alternate language assessments include the Head Start Family and Child Experiences Survey (FACES) and the Universal Preschool Child Outcomes Study (UPCOS; Aikens et al., 2020; Bandel et al., 2012).
The aforementioned large-scale research testing contexts naturally lend themselves to regression discontinuity design (RDD) analysis, a rigorous quasi-experimental approach for controlling selection bias when nonrandom, cut point–based assignment is used. However, with the exception of a recent application (Goodrich et al., 2021), the use of RDDs to evaluate DIF has not been considered. Given this gap in the literature, the objective of this article is twofold. First, we develop and describe two approaches for evaluating DIF within an RDD framework. Second, we use Monte Carlo simulation methods to compare the performance of these new approaches with traditional logistic regression (LR).
Methods for Investigating DIF
An item is said to exhibit DIF if the probability of a correct response for the focal group differs from that of the reference group, conditioning on the underlying latent trait (Holland & Wainer, 1993). That is, an item exhibits DIF if the group-specific item response functions (IRFs) are not perfectly overlapping. Uniform DIF reflects a group difference in difficulty or scaling, whereas nonuniform DIF reflects a group difference in discrimination (i.e., the degree to which the item differentiates among test-takers with different ability levels; Mellenberg, 1982).
Multiple approaches have been proposed for investigating DIF, including item response theory (IRT; Lord, 1980), structural equation modeling (SEM; Meredith, 1993), LR (Swaminathan & Rogers, 1990), the Mantel–Haenszel (MH) Test (Holland & Thayer, 1988), the Simultaneous Item Bias Test (SIBTEST; Shealy & Stout, 1993), and variations thereof. Broadly, these approaches differ in how they operationalize the latent trait (as a latent variable versus observed score versus corrected observed score), whether they rely on parametric assumptions, whether they allow multiple items to be tested simultaneously, and their sensitivity to nonuniform DIF. For this study, we focus on LR, as it does not require as large of a sample size as latent variable approaches, does not require coarse stratification of the matching variable, and is sensitive to both uniform and nonuniform DIF (Fidalgo et al., 2014).
Testing DIF Using LR
LR is a parametric approach for investigating DIF, specified as
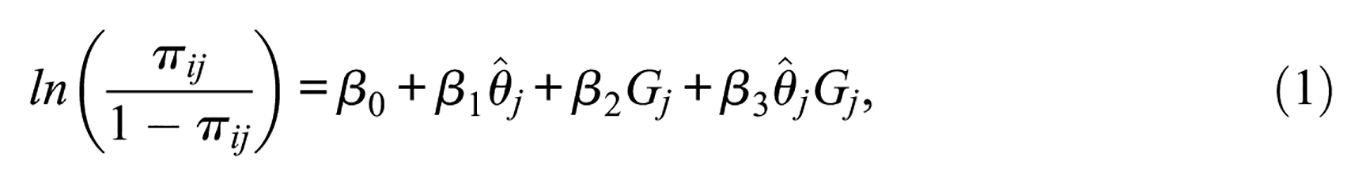
where
Two limitations of LR and related parametric observed score approaches are often cited in the DIF literature. First,
Another limitation of LR is that inferences are prone to selection bias. If groups differ on variables other than the grouping mechanism and underlying latent trait, then it is unclear whether DIF is due to the grouping mechanism or some other construct relevant or irrelevant variable. Similarly, true DIF may be masked by selection bias (Wu et al., 2017).
Existing DIF Frameworks for Controlling Selection Bias
Past research has acknowledged the importance of considering selection bias in evaluations of DIF. One strategy for eliminating the threat of selection bias is to randomly assign test-takers to groups. Unfortunately, this strategy has limited utility in education, as typically the grouping mechanism either cannot be manipulated or is based on need. Two alternative strategies are to include covariates in Equation 1 (in addition to ability level; for example, Clauser et al., 1996) or apply propensity score analysis (PSA) methods (e.g., Chen et al., 2020; Liu et al., 2019). Including additional covariates is a relatively straightforward approach but assumes that all relevant covariates are measured and included in the model, and that the relationship between the covariates and item response is correctly parameterized. In the absence of random assignment, there may be numerous confounding variables that can lead to a highly parameterized model that in turn limits statistical power to detect true DIF. PSA is a diverse collection of methods that involves (a) reducing a large number of covariates into a single variable, or propensity score (i.e., balancing score), which represents the probability of being assigned to the “treatment” group (hereafter we use the term treatment to refer broadly to any grouping mechanism), given the vector of covariates, and (b) conditioning the treatment effect on the propensity score (Rosenbaum & Rubin, 1983). PSA mitigates some of the concerns with the simple covariate approach by separating the propensity score model from the treatment model and reducing the dimensionality of the covariates. Nevertheless, PSA can be complex and time-consuming and still suffers from limitations, such as the potential to overlook important covariates, a reduction in sample size and power, and sensitivity of the treatment effect to misspecification of the propensity score model. PSA does not permit inferences as strong as those of other quasi-experimental approaches, in particular RDD (Shadish & Steiner, 2010).
Testing DIF Within an RDD Framework
RDD is a quasi-experimental approach that applies when a “running” variable (
Two alternative RDD frameworks have been developed to support causal inferences (Bloom, 2012; Cattaneo et al., 2020a, 2020b; D. S. Lee & Lemieux, 2010). The standard continuity-based framework relies on the assumption that the conditional expectations of the potential outcomes, given
RDD treatment effects can be estimated using graphical, parametric, or nonparametric methods. In our proposed framework, we focus on nonparametric methods, based on the recommendations of Cattaneo et al. (2020b) who advise against parametric methods. We first propose using local linear regression within an RDD continuity-based framework (hereafter abbreviated as LLn-RDD) to test for DIF. This approach entails fitting the following weighted least-squares regression:

where the target parameter is given by
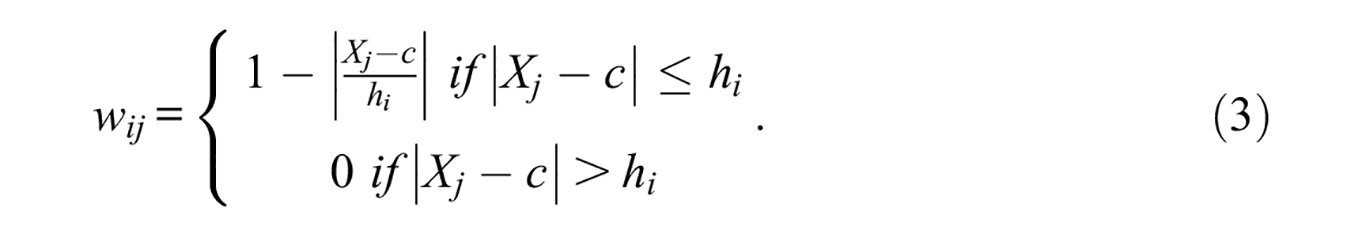
Equation 3 highlights the fact that only participants with
Local linear regression is often used on categorical outcomes as it does not require that
A linear approximation is likely to be supported across a broader range of the outcome when applied to the logit scale, thereby permitting broader bandwidths and larger sample sizes. This could result in greater precision. For example, outside of the RDD and DIF contexts, Frölich (2006) found that local logit estimators had greater precision than local linear estimators for dichotomous outcomes with many regressors. On the contrary, outside of the DIF context, Xu (2017) observed limitations with the ASME optimal bandwidth and noted that standard errors were large, suggesting that power may suffer.
There are several noteworthy differences between the traditional and proposed approaches for testing DIF. First, LR permits tests of uniform and nonuniform DIF, whereas LLn-RDD and LLg-RDD as defined above are limited to tests of uniform DIF. Testing whether the item’s discrimination varies between groups would require either imposing parametric assumptions (thereby increasing susceptibility to bias) or subsetting the analyses along discrete levels of
Taken as a whole, the RDD approaches have both advantages and disadvantages when compared with LR for detecting DIF. Their advantages are that they control for selection bias, use nonparametric methods which require fewer assumptions and are more robust to outliers and idiosyncrasies in the data that are far from
The Current Study
Although the RDD approaches have some theoretical advantages for evaluating uniform DIF, it is unclear how these approaches perform in practice when sample conditions are less than ideal. Empirical evidence is needed to support their use. The purpose of this Monte Carlo simulation study was to compare the performance of LR, LLn-RDD, and LLg-RDD in detecting the absence, presence, and magnitude of uniform DIF across varying sample conditions, including different magnitudes of group impact, magnitudes of selection bias, sample sizes, test lengths, and item properties. Four research questions were posed as follows:
Based on prior research, we hypothesized that the LR DIF test statistic would demonstrate inflated Type I error rates and the effect size estimator would be biased when the magnitude of impact was large and the test was short, and in the presence of selection bias, particularly when sample size was large and the target item was strongly discriminating (DeMars, 2009, 2010; Y. Li et al., 2012; Liu et al., 2019; Rogers & Swaminathan, 1993; Shih et al., 2014). We expected the corresponding LLn-RDD and LLg-RDD test statistics and effect size estimators would be robust to selection bias, group impact, and test length. Controlling for differences in the Type I error rate and bias, we hypothesized that the LR approach would be more powerful and precise than the RDD approaches, and that the LLg-RDD approach would be more precise than the LLn-RDD approach (Frölich, 2006).
This study focuses on uniform DIF because it is a natural starting point for evaluating the RDD approaches. These approaches are not designed to detect interactions with continuous variables (in this case, the proficiency by group interaction reflecting nonuniform DIF). If they do not perform well for detecting uniform DIF then they are even less likely to perform well for detecting nonuniform DIF. We acknowledge in the “Discussion” section, however, that investigating nonuniform DIF is an important future direction.
Method
Design
Five simulation factors were fully crossed for a total of 216 conditions: (a) Group impact (three levels), (b) Selection bias (three levels), (c) Sample size (three levels), (d) Test length (two levels), and (e) Item properties (four levels). R = 1,050 replications were generated for each combination of impact, selection bias, sample size, and test length for a total of 56,700 replications. Item properties were varied within replications (i.e., each simulated test contained all combinations of items). Within each condition, only the first 1,000 replications for which all three analyses’ approaches converged were used to evaluate the test statistics and effect size estimators.
Group Impact
The levels of group difference in true proficiency were 0 SD, .5 SD, and 1 SD, representing no mean impact, moderate impact, and large impact, respectively. This range mirrors levels considered in prior research (e.g., DeMars, 2009; Hidalgo et al., 2014; Y. Li et al., 2012; Narayanan & Swaminathan, 1996).
Selection Bias
For the target items, the probability of a correct response was generated to be a function of the traditional 3PL IRT item and person properties, in addition to a person-level confounding variable, the RDD running variable. This variable was generated to account for no, minimal, or moderate variability in the item responses (see “Data Generation” section).
Sample Size
Three sample sizes were considered: nr = nf = 150 (N = 300), nr = nf = 300 (N = 600), and nr = nf = 1,000 (N = 2,000). Whereas unequal sample sizes are more likely to be observed in practice, we imposed the simplifying assumption of equal sample sizes to prevent confounding variability (variability between sample size conditions due to factors other than sample size) that could potentially arise from generating unequal sample sizes. 1 We acknowledge this limitation in the “Discussion” section. The smallest sample size condition falls below ETS’ minimum recommended total sample size of 500 and group sample size of 200 during the test assembly phase (Zwick, 2012), but represents a plausible sample size when considering special populations such as English language learners or students with disabilities. For example, only 150 students enrolled in the ECLS-K:2011 completed the Spanish spring kindergarten mathematics assessment (Najarian et al., 2018). The middle sample size condition meets minimum guidelines but is still relatively small, whereas the largest sample size represents an ideal scenario and is similar to the largest condition considered in prior research (e.g., Jodoin & Gierl, 2001; Y. Li et al., 2012). Practitioners may not have access to a sample size of 1,000, particularly for the focal group, when DIF analyses are not planned/powered a priori. We include this largest condition to help inform sample size planning for DIF analyses when sample size is under the control of the practitioner.
Test Length
Short (20 items) and long (80 items) tests were generated. Twenty items has been recommended as a lower bound for investigating DIF (Zumbo, 1999). Although short, 20-item tests are used in practice (e.g., the ECLS-K:2011 kindergarten science achievement test; Najarian et al., 2018). Past simulation research has considered 80 items to represent a long test, and similar test lengths are used in practice (e.g., the ECLS-K:2011 kindergarten reading and mathematics achievement tests; Najarian et al., 2018).
Item Properties
Four combinations of item discriminations and difficulties were considered for the target items: (a) high discrimination (a = 1.6), low difficulty (b = −1.5); (b) low discrimination (a = 0.6), moderate difficulty (b = 0.0); (c) high discrimination (a = 1.6), moderate difficulty (b = 0.0); and (d) high discrimination (a = 1.6), high difficulty (b = 1.5). These combinations of items have been investigated in prior DIF research (Narayanan & Swaminathan, 1996; Rogers & Swaminathan, 1993) and were chosen for this study because they contribute varying information and target different locations across the latent trait continuum.
Data Generation
To help with interpretation, we use the applied example of Goodrich et al. (2021) to describe the simulated testing context. That is, we consider a scenario in which Spanish-speaking kindergarteners are administered a mathematics assessment and the language of administration is determined based on their performance on an English language screener. Following a sharp RDD design, all students who pass the English proficiency cutoff are administered the mathematics assessment in English (reference group) and all students who do not pass are administered the assessment in Spanish (focal group).
Item responses were generated in base R Version 3.6.1 (R Core Team, 2019) according to a modified 3PL IRT model:
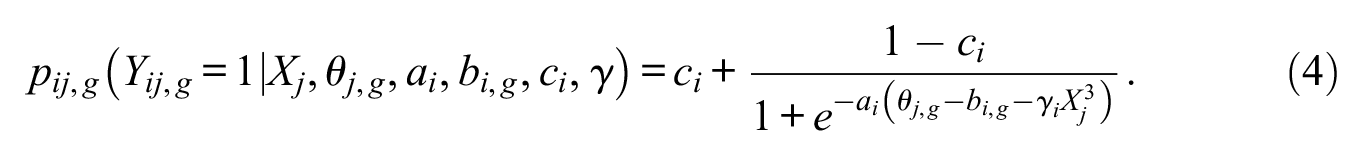
Notation is as follows:
Impact was simulated by generating
For both test length conditions, eight items (four non-DIF and four uniform DIF) were targeted for investigation (see Table 1). The properties of the four non-DIF items match those described in the “Item Properties” section. The discrimination parameters of the four DIF items were the same as those of the non-DIF items, whereas the difficulty parameters were chosen, such that the area between the IRFs of the two groups was equal to .6 (reflecting a moderate level of DIF; Swaminathan & Rogers, 1990) and the group-specific difficulty parameters were equidistant from the target difficulty parameter. Given these constraints, the item difficulties were derived by solving the following equation that quantifies the area between two response functions under the assumption that
Generating IRT Properties and Observed Classical Test Theory Properties of Target Items

Note. IRT = item response theory;

DIF was generated to be unidirectional, so DIF items were always easier for the reference group.
The target items accounted for 40% of the 20-item test. To ensure similar item properties and maintain a constant proportion (.20; see Gierl et al., 2004) of DIF items across test lengths, the eight target items were replicated 4 times for the 80-item test. Properties of the remaining 60% of items (i.e., the remaining 12 items of the 20-item test and 48 items of the 80-item test) were randomly generated for each replication under the following constraints:
To simulate selection bias, it was necessary to generate a variable besides the mathematics ability variable that was related to both group membership (mathematics assessment language) and item response. The English language screener, by definition under the RDD, predicted group membership. As noted above, the 3PL IRT model was modified so that the English language screener also predicted response to the target items. The relationship between the screener and outcome was chosen to be nonlinear to ensure that a narrower bandwidth would be necessary under the RDD approaches. Three magnitudes of effects were considered:
Note that generating
Data Analysis
LR, LLn-RDD, and LLg-RDD were used to investigate DIF. The LR approach, specified according to Equation 1 but without the ability by group term, was carried out in Mplus Version 8.5 (Muthén & Muthén, 1998–2020), using maximum likelihood estimation. An item was flagged as DIF if the Wald test for the group effect was significantly different from 0 (p < .05). The LLn-RDD approach was implemented within the rdrobust package in R (Calonico et al., 2021) according to Equation 2. Bandwidths were empirically derived based on a triangular kernel function and MSE-optimal bandwidth selector. Estimation was carried out using OLS but with robust bias-corrected standard errors. An item was flagged for DIF if p < .05 for the group difference. LLg-RDD was implemented within the rd.categorical package in R (Xu, 2017). Bandwidths were derived from the AMSE-optimal bandwidth selector with a uniform kernel function.
Monahan et al. (2007) describe several effect sizes appropriate for quantifying the magnitude of uniform DIF. For this study, effect size was measured as the group difference in the predicted proportion of respondents with a correct response (
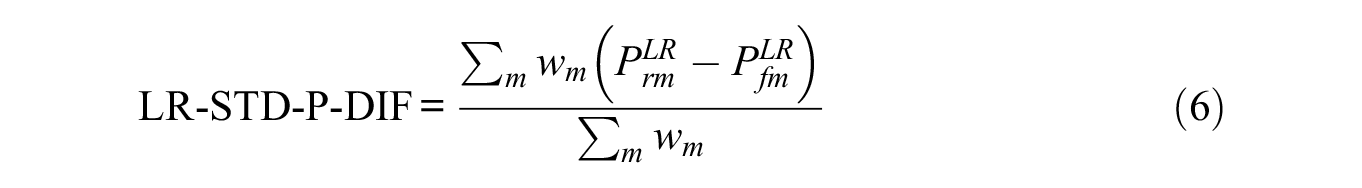
where
For LR, a purification procedure was performed in which the mathematics score used as the matching criterion was calculated as the sum of only the responses to the non-DIF items plus the item under investigation (Zieky, 1993). Because this procedure was not under investigation, purification was based on truth (DIF items were treated as known) as opposed to carried out using an estimative iterative procedure. This approach thus presents a best-case scenario.
Outcomes
The proportion of converged replications (out of 1,050) was documented for the three approaches. For each of the four target non-DIF items, the Monte Carlo estimated Type I error rate was calculated as the proportion of the first 1,000 converged replications that the item was incorrectly flagged as DIF. Using a normal approximation to the binomial, it is expected with 99% confidence that a test statistic with a true Type I error rate of .05 will have an estimated error rate between .032 and .068. Similarly, for each of the four target DIF items, power was calculated as the proportion of the first 1,000 converged replications that the item was correctly flagged as DIF. Power was only interpreted when the corresponding Type I error rate did not fall outside the 99% confidence bounds.
For all target items, bias of the effect size estimator was calculated as the average of effect size estimates across the first 1,000 converged replications minus the true effect size:
Given the large number of conditions, an analysis of variance (ANOVA) was performed on the aggregated Type I error and bias data to identify which simulation factors accounted for a meaningful proportion of variability in the outcomes. Interpretation was limited to effects with η2≥ .02 (Cohen’s, 1988, cutoff for a small effect). Visual inspection was performed for the power and RMSE outcomes in lieu of ANOVA due to data missing not at random (power and RMSE data were omitted if the corresponding Type I error rate and bias were unacceptable).
Results
The primary results are organized below by outcome. We first summarize key characteristics of the data generation and analysis conditions to contextualize the primary results.
Classical test theory properties of the target items, averaged across replications and conditions, are shown in Table 1. As expected, the proportion of correct responses was highest for the low difficulty items (
The percentage of converged replications was 100% across all conditions for LR and LLn-RDD. For LLg-RDD, convergence was less than 100% (ranging from 97.3% to 99.9% with a median of 99.6%) for 19 of the 54 conditions. Among these conditions, greater rates of nonconvergence were observed for the large impact and small sample size conditions. The effective sample size ranged from 47% to 54% of the total sample size for LLn-RDD and 57% to 83% for LLg-RDD. LR analyses were based on data from the full sample.
Type I Error
The Monte Carlo estimated Type I error rates are illustrated in Figure 1 and complete numerical results are available in Table S1. In the figure, Type I error rate is indicated by the x-axis with dashed vertical lines, indicating 99% confidence bounds for a true Type I error rate of .05; sample size and impact conditions are represented by columns, test length, and selection bias; item property conditions are represented by rows; and DIF approach is indicated by different symbols (plus = LR, circle = LLn-RDD, triangle = LLg-RDD).
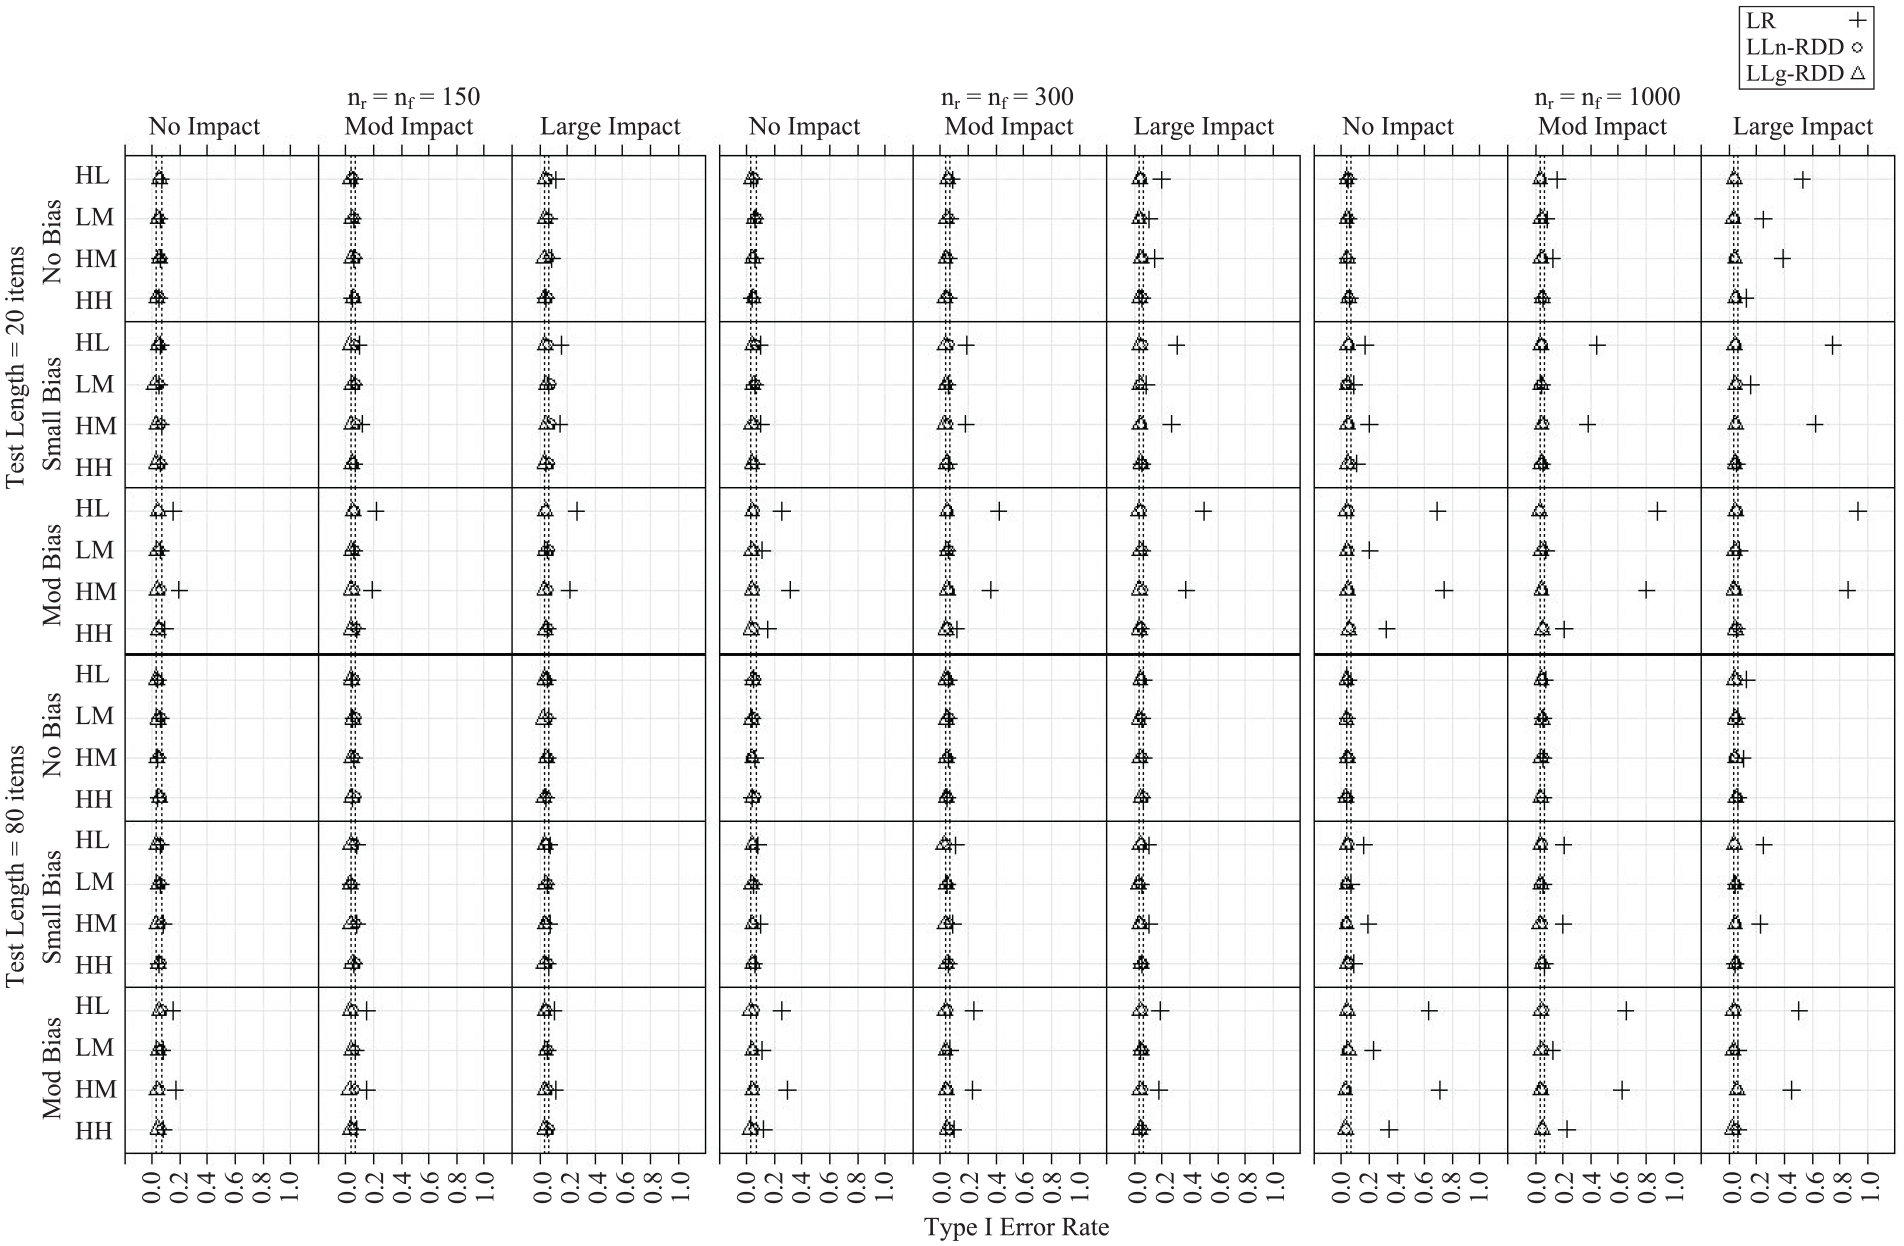
Monte Carlo Estimated Type I Error Rate
The observed Type I error rates were more variable across conditions, and more inflated on average, under the LR approach (M = .15, range = .04–.93) than the LLn-RDD (M = .06, range = .04–.09) and LLg-RDD (M = .04, range = .02–.06) approaches. Results from an ANOVA identified a four-way interaction, selection bias by DIF method by sample size by item (η2 = .02), that accounted for a meaningful proportion of variability in Type I error rates. Impact and test length did not account for a meaningful proportion of variability. The LR Type I error rate was more inflated when selection bias was present, and this pattern was more pronounced when sample size was large and for the two items with high item-ability correlations (the high discrimination, low difficulty and high discrimination, moderate difficulty items). The LLn-RDD and LLg-RDD Type I error rates were not sensitive to selection bias, sample size, or item properties.
Power
The Monte Carlo estimated power rates are shown in Figure 2 for the conditions in which the corresponding estimated Type I error rate did not exceed the 99% confidence bounds for a true Type I error rate of .05. Numerical results are provided in Table S2. The figure follows the same structure as before but with power on the x-axis. Power to detect DIF was consistently higher for the LR approach than the LLn-RDD and LLg approaches, with an average difference in power of .56 (range = .06–.80) and .54 (range = .09–.85), respectively. Power was slightly higher on average for LLn-RDD than LLg-RDD (MDiff = .05, range = −.03–.20). Even under the largest sample size condition, power of the LLn-RDD and LLg-RDD test statistics did not reach .80. In contrast, power of the LR test statistic exceeded .80 under the smallest sample size condition for the two items with high item-ability correlation. For all three approaches, power was higher for the two items with high item-ability correlations and when sample size was large.
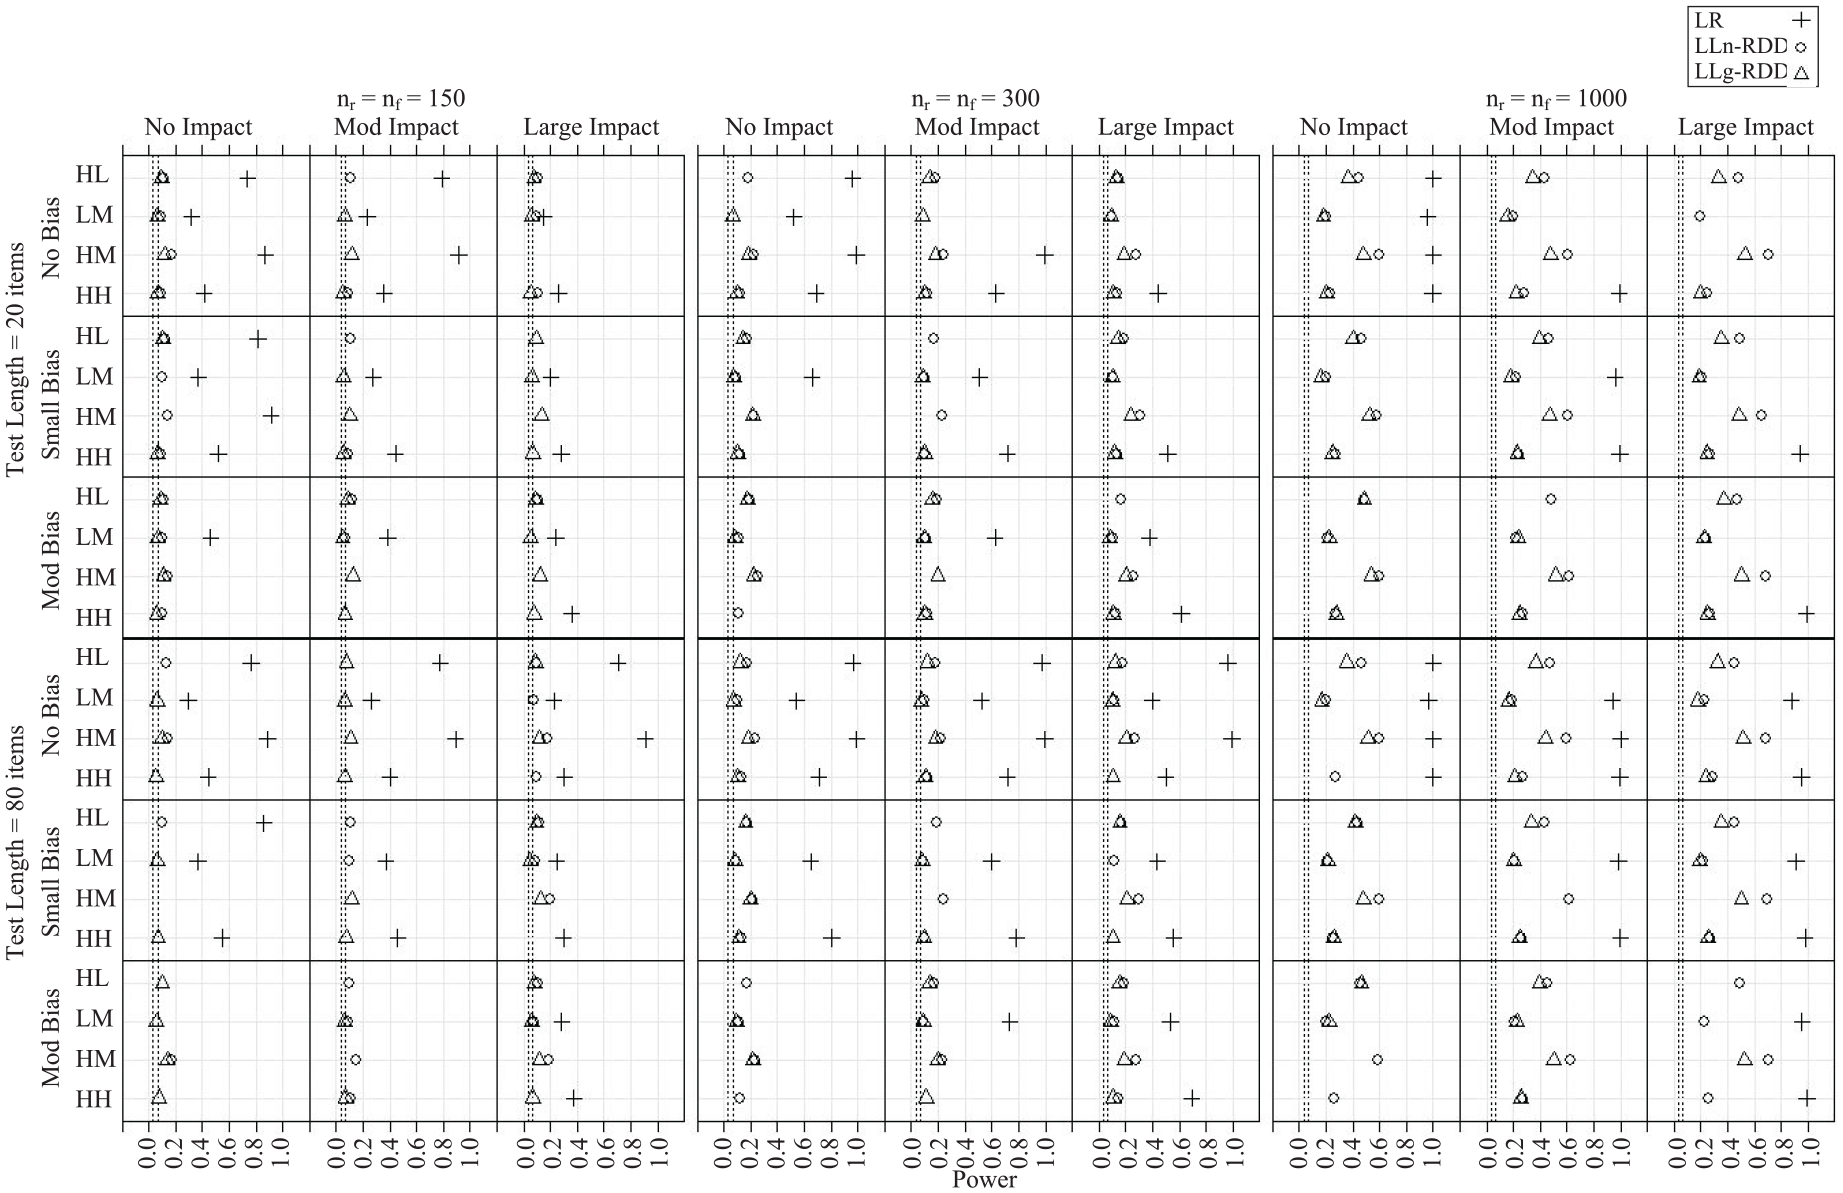
Monte Carlo Estimated Power
Bias
Monte Carlo estimated bias of
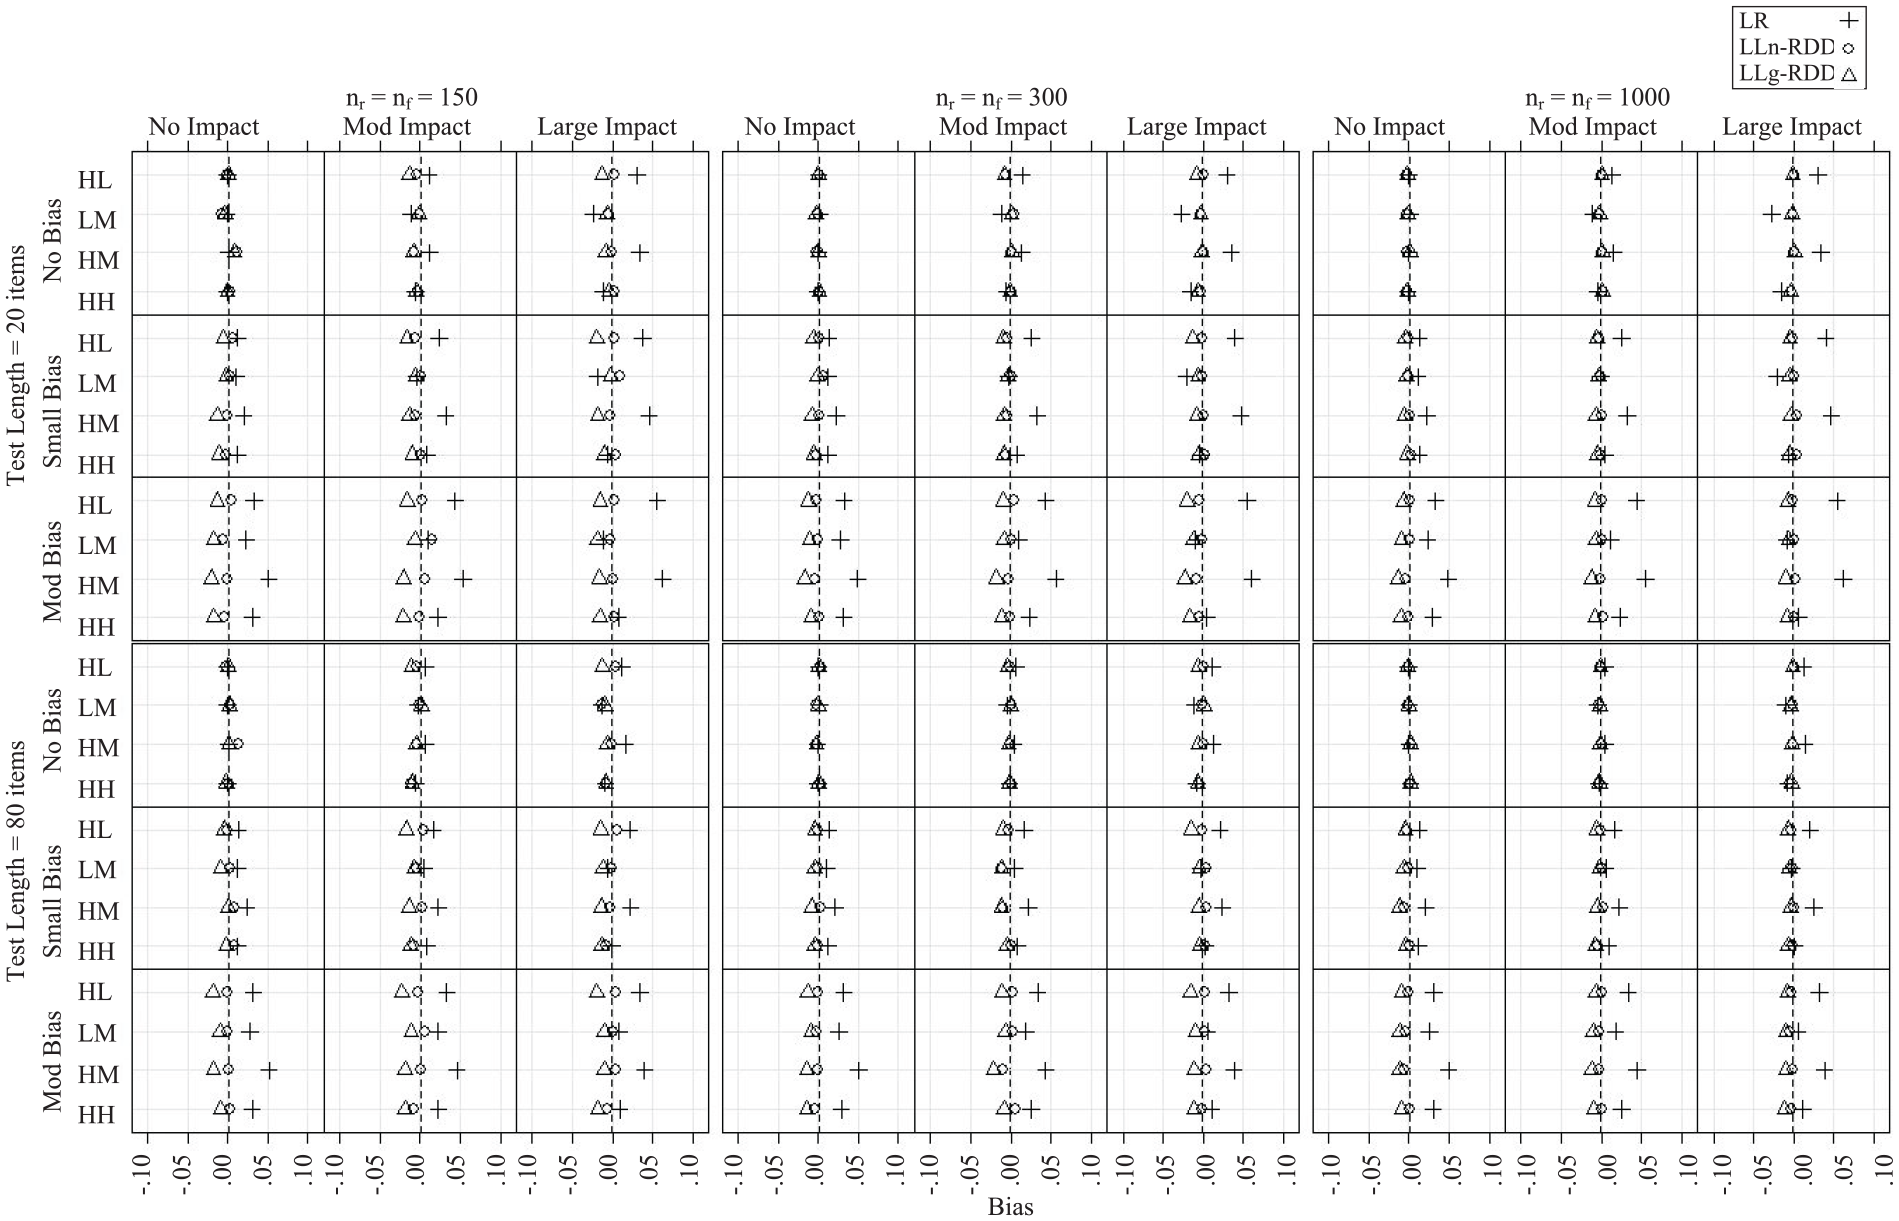
Monte Carlo Estimated Bias of

Monte Carlo Estimated Bias of
Results from the two ANOVAs revealed similar patterns across the non-DIF and DIF items. The method by impact by item interaction accounted for a meaningful proportion of variability in bias (η2 = .05 and .06 for the non-DIF and DIF items, respectively). When impact was small, the LR
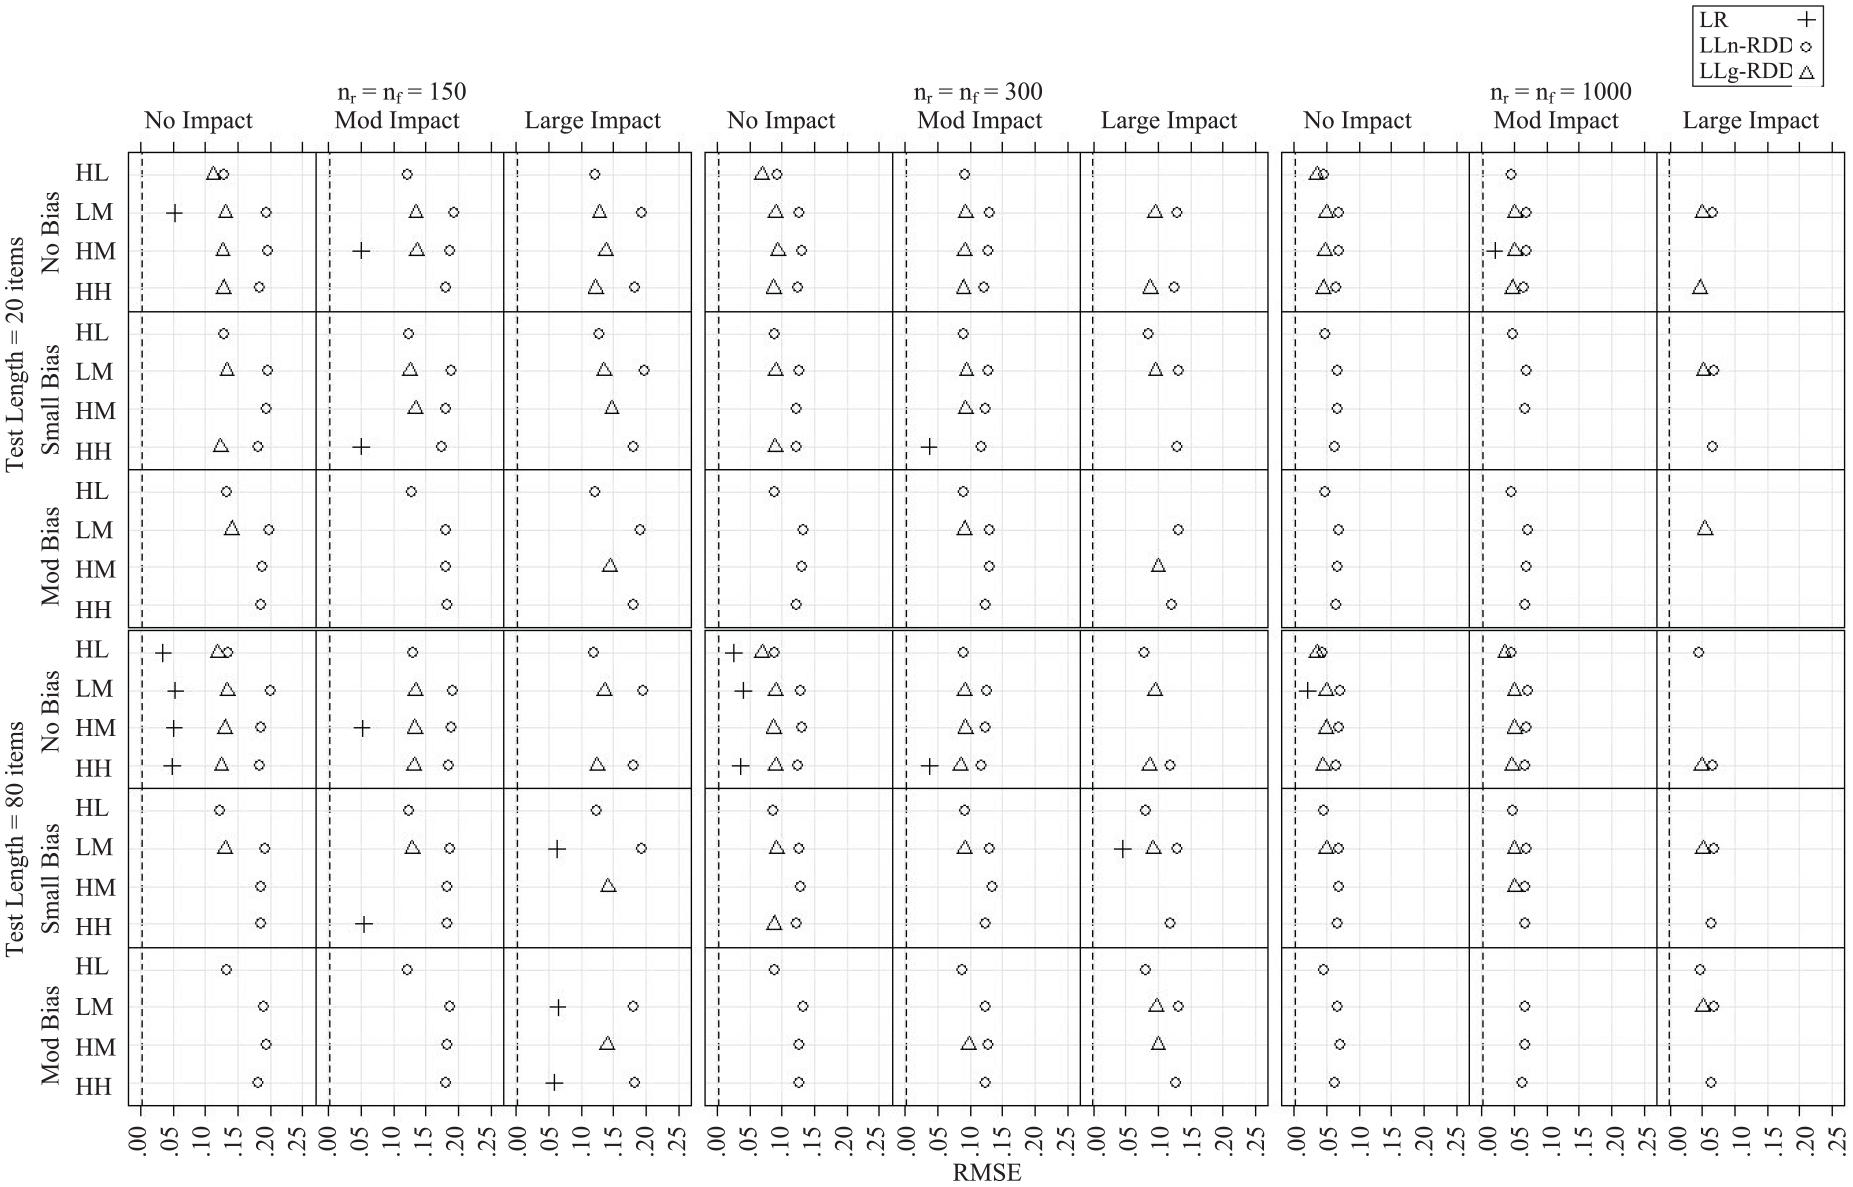
Root Mean Square Error
Monte Carlo estimated RMSE of
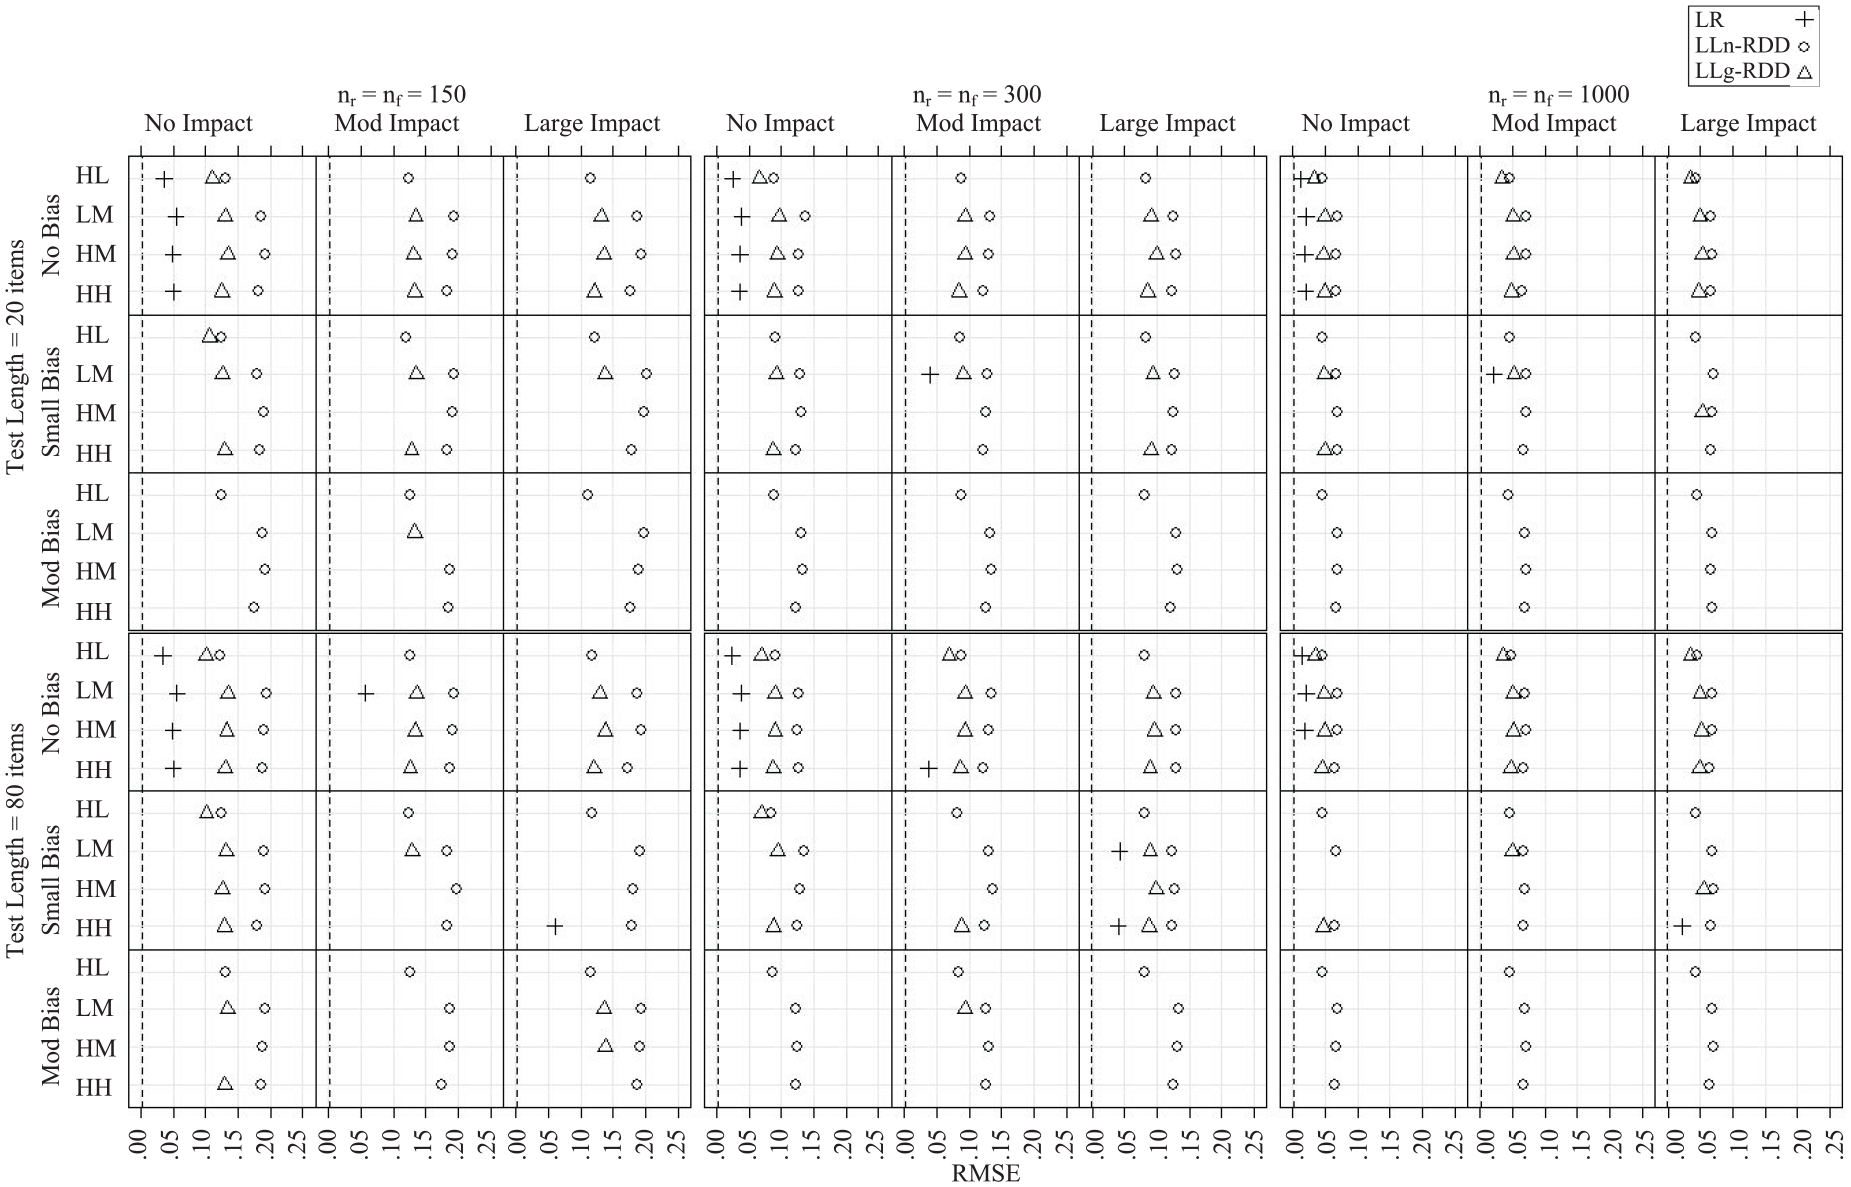
Monte Carlo Estimated RMSE of
Monte Carlo Estimated RMSE of
Discussion
Our objectives in this article were to develop and describe two approaches for evaluating DIF within an RDD framework and compare these novel approaches with traditional LR. We achieved our first objective by proposing the use of nonparametric local linear regression and local logit estimation within an RDD continuity-based framework (LLn-RDD and LLg-RDD, respectively) to evaluate uniform DIF. We achieved our second objective by performing a Monte Carlo simulation study that compared the Type I error and power rates of the LR, LLn-RDD, and LLg-RDD uniform DIF test statistics, and bias and RMSE of the LR, LLn-RDD, and LLg-RDD uniform DIF effect size estimators.
Comparison of LR, LLn-RDD, and LLg-RDD for Evaluating DIF
As hypothesized, the LLn-RDD and LLg-RDD uniform DIF test statistics had less inflated Type I error rates (never exceeding .09 and .06, respectively) than the corresponding LR test statistic (reaching as high as .93). The LLn-RDD and LLg-RDD statistics were relatively stable across conditions, although the LLg-RDD statistic was overly conservative (Type I error rate < .03) at times, consistent with Xu’s (2017) findings that the local logit standard errors were inflated. In line with prior research the LR statistic was sensitive to selection bias (Liu et al., 2019), sample size (Y. DeMars, 2009, 2010; Li et al., 2012; Shih et al., 2014), and the strength of the association between the item and underlying latent trait (DeMars, 2010; Rogers & Swaminathan, 1993). The finding that the LR statistic was more sensitive to selection bias when the item was strongly discriminating is unsurprising based on Equation 4 in which the selection bias parameter is multiplied by the discrimination parameter. Assuming a testing context that mirrors our simulation study, if there is a moderate level of selection bias, sample size is large, and the item has a high item-ability correlation, the probability of flagging the item for uniform DIF, when in fact the item does not exhibit DIF, is greater than .50. Such a high false positive rate has serious implications for the test construction phase in which unnecessary time and money may be devoted to reviewing the flagged items, and well-functioning items that take time and money to develop and replace may be errantly thrown out.
Contrary to our hypothesis, group impact and test length did not account for a meaningful proportion of variability in Type I error rates. However, focusing on the conditions with no selection bias, the pattern of results shown in Figure 1 is consistent with prior research, indicating that LR Type I error rates are inflated when the matching score is unreliable (when the test is short) and group impact is large, particularly when sample size is large (DeMars, 2009, 2010).
As expected, considering only those conditions in which the Type I error rate of the uniform DIF test statistic did not exceed the 99% confidence bounds for a true Type I error rate of .05, the LR statistic was considerably more powerful than the corresponding LLn-RDD and LLg-RDD statistics (by .56 and .54, on average, respectively). LLn-RDD demonstrated slightly greater power than LLg-RDD, despite smaller effective sample sizes. Even under the largest sample size condition, power of the LLn-RDD and LLg-RDD statistics to detect a moderate level of uniform DIF never reached .80 and was less than .30 for the two items with low item-ability correlations. While false positives are costly, failing to detect DIF when an item truly does function differently across groups (a false negative) is doubtlessly more problematic in educational contexts in which the end goal is to achieve unbiased and equitable testing. Consistent with prior research, across approaches power was highest when sample size was large and the item was strongly correlated with the underlying latent trait (e.g., Z. Li, 2014).
Consistent with our hypothesis, the LLn-RDD and LLg-RDD effect size estimators were less biased than the LR estimator in the presence of selection bias and when impact was large for the two items with high item-ability correlations. However, when considering the p metric classification system presented in Monahan et al. (2007) that distinguishes among |p| ≤ .05, .05 < |p| ≤ .10, and |p| > .10, the level of bias was relatively minor for all three approaches across most conditions. Bias was at or below .05 for 94% of the conditions under the LR approach and below .05 for all conditions under the LLn-RDD and LLg-RDD approaches. These results suggest that, in expectation, the estimated magnitude of
Finally, only considering the conditions in which the effect size estimators were unbiased, the LR estimator was notably more precise than the LLn-RDD and LLg-RDD estimators (by .09–.11 and .05–.06 on average, respectively). RMSE of the LLn-RDD estimator averaged .12 across conditions and reached as high as .20 when sample size was small. That is, for any given sample, under these same conditions, the LLn-RDD estimated magnitude of
Taken together, these results corroborate prior research demonstrating limitations of the LR DIF test statistic, specifically its high rate of false positives under certain conditions. Whereas the novel LLn-RDD and LLg-RDD DIF approaches posed theoretical advantages for addressing these limitations, they suffered from low statistical power and lack of precision.
Recommendations for Practice
Our first recommendation in choosing a DIF framework is to reflect on the testing context. Does the testing context lend itself to an RDD analysis (i.e., was group membership determined on the basis of a pretreatment running variable and preestablished cut point)? If not, then LLn-RDD and LLg-RDD cannot be applied. As we note in the Introduction, this framework, in its current form, lends itself most directly to large-scale research testing contexts in which a single cut score is used to determine accommodations, in contrast to educational practice in which typically multiple sources of information are used. What is the research question—Is estimating the average treatment effect at the cut point even appropriate/desired? For example, if the aim is to test whether items function differently for students who are proficient versus not proficient in English, then evaluating DIF across language forms at the English language proficiency cut point is clearly inappropriate. What are the relative costs of a Type I versus Type II error? If Type I errors are not particularly costly, then LLn-RDD and LLg-RDD do not offer a distinct advantage. What are the testing conditions (e.g., sample size, item properties)? Group sizes need to exceed 1,000 to have sufficient power (> .80) to detect a moderate degree of uniform DIF. DIF items that are only weakly discriminating are unlikely to be flagged. (It could be argued, however, that weakly discriminating items are likely to be discarded early in the test construction process, making this point moot.)
In line with the advice of Hambleton (2006), our second recommendation is to use multiple approaches and multiple types of information (statistical significance, effect size) to evaluate DIF. LLn-RDD and LLg-RDD were found to have low power and precision, but may still be useful as a means for exploring the presence of, and sensitivity of inferences to, selection bias. RD plots provide a graphical depiction of (dis)continuity in outcomes or pretreatment covariates at the cut point by plotting the test-taker’s score on the target variable (y-axis) in relation to the test-taker’s value on the running variable (x-axis). A clear discontinuity in the probability of a correct response at the running variable cut point for an item under investigation for DIF suggests the presence of uniform DIF that can be attributed to the different test forms. On the contrary, a positive or negative association between the running variable and item response that is continuous (does not jump) at the running variable cut point suggests that inferences based on traditional approaches for evaluating DIF may be confounded by selection bias. Overall, LLn-RDD and LLg-RDD performed similarly, but the LLg-RDD effect size estimator was slightly more precise and thus we recommend its use over LLn-RDD for quantifying the magnitude of DIF.
Our third recommendation is that items flagged for DIF should be carefully reviewed by content experts, regardless of DIF approach. Although the proposed RDD framework supports causal inferences (e.g., that DIF is due to differences in the alternate language forms rather than differences in the test-takers assigned to the different forms), it does not provide an indication of the specific source of DIF (e.g., a problem with the translation of a particular word).
Limitations
Our simulation included many conditions, but certain factors were not considered that may influence the performance of the LR and RDD approaches. Most notably, we did not consider nonuniform DIF. The RDD approaches are unlikely to be sensitive to nonuniform DIF, in contrast to the LR approach that can detect both types of DIF. In addition, we held constant the magnitude and direction of DIF, proportion of DIF items, and generating model, and we made the simplifying assumption of equal group sizes. The RDD approaches had low power and a lack of precision for detecting a moderate level of DIF under the ideal scenario of equal group sizes; they are expected to perform even worse for detecting smaller magnitudes of DIF and when group sizes are unequal. In contrast to large-scale research studies, more complex testing contexts in which multiple factors determine assignment to form are typical of educational practice and our simulation is not able to inform such contexts. We also generated the data so that all assumptions underlying the RDD approaches were met. In practice, these assumptions must be tested and are not always met. For example, it may be possible for test-takers or test administrators to manipulate scores on the running variable to influence group assignment. In this case, test-takers just below and above the cut point may not be similar on all pretreatment covariates. It is also possible, and indeed likely, that the running variable is measured with error.
Another limitation is that we considered only one type of effect size, the group difference in the predicted proportion of a correct response (p metric). While the p metric is easy to interpret, it is not constant across items with different difficulty levels and it is not a natural effect size estimator for the LR approach (in contrast to the conditional odds ratio).
Future Directions
In addition to evaluating other simulation conditions described in the “Limitations” section, our proposed framework for detecting DIF can be expanded and improved upon in multiple ways. It is particularly imperative to extend the framework to support investigations of nonuniform DIF and to improve power and precision. To this end, a parametric RDD approach may be considered, which would be comparable to the covariate approach for controlling selection bias that was described in the Introduction. Another possible extension is to generalize inferences about DIF beyond the running variable cut point (e.g., by utilizing multiple cut points). Other future directions include extending the framework to support multiple running variables and fuzzy RDDs in which the running variable cut point is not deterministic (Bloom, 2012) and using alternative rules to flag items for DIF that take into account both statistical significance and effect size (cf. Hidalgo et al., 2014; Jodoin & Gierl, 2001). Finally, other DIF frameworks for controlling selection bias, beyond RDD, should be considered.
Conclusion
The findings of our simulation study highlight the importance of considering selection bias when evaluating items for DIF. Due to low power and lack of precision, we do not recommend relying exclusively on the newly proposed framework (at least not in its current form) when the testing context mirrors the conditions evaluated in our study. False negatives have significant implications for equity in educational assessment as failure to account for problematic items could result in the use of a test accommodation that unfairly advantages one group of students over another (e.g., if items displaying DIF are systematically easier for one group). However, we do advocate its use as an exploratory tool that can help evaluate the sensitivity of traditional methods for testing DIF, given clear evidence of selection bias in real-world testing scenarios in which alternate form assessment accommodations are used (see Goodrich et al., 2021). Additional methodological research is needed to improve the proposed framework.
Supplemental Material
sj-docx-1-epm-10.1177_00131644211068440 – Supplemental material for A Regression Discontinuity Design Framework for Controlling Selection Bias in Evaluations of Differential Item Functioning
Supplemental material, sj-docx-1-epm-10.1177_00131644211068440 for A Regression Discontinuity Design Framework for Controlling Selection Bias in Evaluations of Differential Item Functioning by Natalie A. Koziol, J. Marc Goodrich and HyeonJin Yoon in Educational and Psychological Measurement
Footnotes
Declaration of Conflicting Interests
The authors declared no potential conflicts of interest with respect to the research, authorship, and/or publication of this article.
Funding
The authors disclosed receipt of the following financial support for the research, authorship, and/or publication of this article: This research was supported by a grant from the American Educational Research Association (AERA), which receives funds for its “AERA Grants Program” from the National Science Foundation (NSF) under NSF award NSF-DRL No. 1749275. Opinions reflect those of the authors and do not necessarily reflect those of AERA or NSF.
Supplemental Material
Supplemental material for this article is available online.
Notes
References
Supplementary Material
Please find the following supplemental material available below.
For Open Access articles published under a Creative Commons License, all supplemental material carries the same license as the article it is associated with.
For non-Open Access articles published, all supplemental material carries a non-exclusive license, and permission requests for re-use of supplemental material or any part of supplemental material shall be sent directly to the copyright owner as specified in the copyright notice associated with the article.