



Abstract
The aim of this study was to compare the walkability of neighborhood environments of older adults (65 years and above) living in the general community and retirement village settings, and to describe associations between walkability and the physical activity of participants. The study was conducted in a coastal region of Australia largely characterized by urban sprawl. In 2011-2012, 292 participant neighborhoods (400 m radius around each home) were audited using the Irvine-Minnesota Inventory. Having validated a local adaptation of this tool, we compared neighborhood environments in the two settings. We found no association between walkability of the built environment and walking behavior of participants. Although retirement village residents lived in more highly walkable environments, they did not walk more and their overall levels of physical activity were lower than those of community residents.
Introduction
Physically active lifestyles can protect against cardiovascular and other chronic diseases, improve quality of life, and enhance the psychological well-being of adults aged 65 years and above (Chaudhury, Mahmood, Michael, Campo, & Hay, 2012; Strath et al., 2012). These benefits have also been shown to reduce the demands on health and aged care services (Australian Institute of Health and Welfare [AIHW], 2013; Nathan, Wood, & Giles-Corti, 2014). Yet in many high-income countries, overweight and obesity are epidemic, and total physical activity levels are well below the national recommendations for health benefits (Carlson et al., 2012; Chaudhury et al., 2012; Giles-Corti et al., 2013; Gomes et al., 2011; Strath et al., 2012; Van Holle et al., 2014). Outdoor walking is a convenient form of physical activity for all age groups, including older adults, with benefits gained from physical activity, social interaction, and contact with nature (Gomes et al., 2011; Sugiyama & Thompson, 2005). More recently, research attention has turned to potential associations between the built or neighborhood environment and physical activity (Adams et al., 2012; Carlson et al., 2012; Chaudhury, Campo, Michael, & Mahmood, 2016; Giles-Corti et al., 2013; King et al., 2011; Nathan et al., 2014; Shimura, Sugiyama, Winkler, & Owen, 2012; Strath et al., 2012). Understanding the characteristics that increase the walkability of neighborhoods is an important step toward creating communities that encourage walking.
Definitions
Walkability reflects the built environment’s convenience for walking (Leslie et al., 2007; Van Holle et al., 2014). Walkable environments are generally characterized by increased street connectivity (direct, easy access to destinations), higher residential density (natural surveillance and sense of personal safety), and greater land use mix (Brownson, Hoehner, Day, Forsyth, & Sallis, 2009; Gebel, Bauman, Sugiyama, & Owen, 2011; Giles-Corti, Timperio, Bull, & Pikora, 2005; Nathan et al., 2012; Owen et al., 2007). Our study captures the concept of walkability through the physical domains of Accessibility, Land Use Mix, Safety From Traffic, Safety From Crime, and Pleasantness (Day, Boarnet, Alfonzo, & Forsyth, 2006; Hoehner, Brennan Ramirez, Elliott, Handy, & Brownson, 2005). Neighborhood can be defined in various ways; for example, as a static zone of a given radius around a participant’s home, as a set study area such as street or road network distances from a person’s home, as census collector districts or statistical sectors, or as other administrative areas (Arvidsson, Kawakami, Ohlsson, & Sundquist, 2012; Frank, Kerr, Rosenberg, & King, 2010; Hoehner et al., 2005; McMillan, Cubbin, Parmenter, Medina, & Lee, 2010; Sallis et al., 2011; Van Holle et al., 2014). The neighborhood scale that best captures physical activity among older adults is unknown (Frank et al., 2010; Kerr et al., 2014). In this study, we define neighborhood as a static zone of 400 m radius around each participant’s home.
Neighborhood Walkability and the Older Adult
A number of research studies have examined the relationship between neighborhood environment characteristics and physical activity, mostly among middle to older aged adults but a small number have focused on older adults (Adams et al., 2012; Carlson et al., 2012; Chaudhury et al., 2016; Chaudhury et al., 2012; Keast, Carlson, Chapman, & Michael, 2010; King et al., 2011; Li, Fisher, Brownson, & Bosworth, 2005; Nagel, Carlson, Bosworth, & Michael, 2008; Nathan et al., 2014; Nyunt et al., 2015; Owen et al., 2007; Shimura et al., 2012; Strath et al., 2012; Van Holle et al., 2014; Weiss, Maantay, & Fahs, 2010). Of studies with older people, the majority have targeted those living independently in the community or retirement village settings and have been conducted in high-income countries, particularly in the United States, Australia, and the United Kingdom (Gomes et al., 2011).
A 2011 literature review reported inconsistencies in study results for older adults (Van Cauwenberg et al., 2011). For example, U.S. and Australian studies of similar design found no association between walkability and recreational walking in older adults, whereas walkability was positively related to recreational walking in Belgium. Other studies report that walkable neighborhoods, particularly higher density environments, are associated with transport walking in older adults (Adams et al., 2012; Nyunt et al., 2015; Van Holle et al., 2014) but not recreational walking. It appears that while built environment features could encourage more vigorous activity among moderately active older adults, they might not play a significant role in whether older adults walked (Adams et al., 2012; Nagel et al., 2008). Van Cauwenberg’s review (2011) concluded that most studies on environmental characteristics reported them not to be related to physical activity in older adults.
A recent study conducted in Adelaide, Australia, reported a significant decline in transport and recreational walking over a 4-year period in adults aged 50 to 65 years (Shimura, Winkler, & Owen, 2014). However, those walking for transport in high walkable neighborhoods showed a smaller reduction in time spent walking than those in low walkable neighborhoods. The authors suggested that high walkable neighborhoods may help mitigate the decline in transport walking among adults as they age. Interestingly, there appear to be no studies on older adults that examine the relationship between walkability and light-intensity physical activity (defined as >1 and <3 metabolic equivalent task hours) such as easy walking (<3 miles per hour [1 mile = 1.61 km]). Yet, light-intensity activities can confer health benefits and are a common form of physical activity for older adults (Buman et al., 2010; Van Holle et al., 2014).
Researchers have raised the question of whether the relationship between neighborhood environment and physical activity is mediated by network buffer size or physical activity type. One study reported that neighborhood walkability was associated with increased walking among both older men and women at the buffer sizes of 100 m, 500 m, and 1,000 m, representing potential distances traveled by older people (Berke, Koepsell, Moudon, Hoskins, & Larson, 2007). In contrast, Kerr and colleagues (2014) found no association between walkability and women’s moderate to vigorous physical activity or total physical activity at half mile (800 m), 1 mile (1.6 km), or 3 mile (4.8 km) network buffers. Frank and colleagues (2010) proposed that walkability within 1 km of a person’s home may not be related to older Americans meeting physical activity guidelines. Their study indicated that older people may have to drive to suitable venues to access age-appropriate physical activities. Taken together, these findings suggest that older people may prefer more structured and supervised group activities away from traffic and perceived hazards for more intense activity (Frank et al., 2010; Kerr et al., 2014).
Higher residential density offers older people the ability to walk to amenities and facilities located at accessible, shorter distances from home (Chaudhury et al., 2012). However, Nathan and colleagues (2014) found that retirement villages rich in amenities and facilities, located near to home, were related to less walking in residents. They suggested that locating retirement villages within amenity-rich neighborhoods may increase walking more than incorporating services and facilities within the village itself.
Central Coast Retirement Health and Lifestyle Study (RHLS)
Improving the health of older adults is an Australian national research priority (Australian Institute of Health and Welfare [AIHW], 2013). In Australia, the proportion of older adults is predicted to increase from 13% of the population in 2001 to around 18% by 2020 and 29% by 2051 (Sims et al., 2006). Yet, in 2011-2012, only 38% of Australian adults aged 65 to 74 years, and 25% of those aged 75 years and above, undertook sufficient physical activity to achieve health benefits (Australian Bureau of Statistics, 2013). Walking is the most common form of moderate-intensity physical activity among older Australians, with 54% of people aged 65 to 74 years and 36% of people aged 75 years and above walking for exercise (Health Statistics NSW, 2015; Owen et al., 2007).
The Central Coast region of New South Wales (NSW, Australia) comprises mostly rural and residential areas with some commercial and industrial land use. Rapid growth has seen the area marked by urban sprawl and typically low-density housing. Changes in population age structure between 2006 and 2011 indicate a recent increase in the number of “empty nesters” and retirees (60-69 years), and older workers and pre-retirees (50-59 years; Regional Development Australia, n.d.). In 2011, 19% of the Central Coast population (312,184 people) were aged 65 years and above, compared with 14.7% for NSW (Australian Bureau of Statistics, 2011). Retirees are attracted to the area due to its ready access to waterways, beaches, and other coastal attractions and location only an hour’s drive north of Sydney. The retirement village industry is flourishing in this region, reflecting the expanding accommodation needs of an aging population and changing attitudes toward retirement living.
The RHLS is a cross-sectional observational study comparing the health and lifestyle of older adults living independently in retirement villages or within the general community of the Central Coast. An important aim of the RHLS is to identify built or neighborhood environments that may influence walking and other regular physical activities of older adults living in both community and retirement village settings. This study compares the walkability of 292 neighborhood environments of older adults living in the general community and retirement villages, and associations with the physical activity of residents. Understanding the mechanism by which the built environment affects health will contribute to the design of interventions to reduce negative health effects and promote positive health-related behaviors.
Selection of the Environmental Assessment Tool
Literature searches for built (neighborhood) environment assessment tools that could capture built environment characteristics associated with physical activity, particularly walking, were conducted in 2008 and 2010. Expert advice was also provided by URBIS, a consulting firm in urban planning, design, and research, and an industry partner of the RHLS. A number of key analytical, research-based environmental tools were reviewed. These included the Systematic Pedestrian and Cycling Environmental Scan (SPACES), Pedestrian Environment Data Scan (PEDS), the Senior Walking Environmental Assessment Tool (SWEAT), Irvine-Minnesota Inventory (IMI), and the St. Louis Environment and Physical Activity Instrument (Active Living Research, 2016; Boarnet, Day, Alfonzo, Forsyth, & Oakes, 2006; Brownson et al., 2004; Clifton, Smith, & Rodriguez, 2007; Day et al., 2006; Keast et al., 2010; Pikora et al., 2002). At the time, SWEAT was the only tool identified that captured environmental features associated with walking and physical activity in older adults. However, SWEAT was newer than the IMI and not quite as developed. In addition, the collection of many items relevant to senior living was resource intensive, such as physical measurements of buffer widths, curb heights, and length of crosswalk.
After an evaluation of the time required to complete each assessment tool, associated costs, and robustness of each method in terms of the comprehensiveness of built environment features captured, the IMI was considered to be the most feasible instrument for this study. The IMI offers a comprehensive approach to the collection of data on physical environmental features potentially linked to physical activity, especially walking (Boarnet et al., 2006; Boarnet, Forsyth, Day, & Oakes, 2011; Day et al., 2006). It is an analytical, research-based instrument with demonstrated interrater reliability (Boarnet et al., 2006). Researchers are able to select domains or items to suit their purposes, allowing flexibility in application (Forsyth, Jacobson, & Thering, 2008).
In this study, we adapted the 162-item IMI for use in our regional area to compare the walkability of the built environment in two settings. Our tool was validated at domain level to ensure that the adapted version could distinguish between these two settings.
Method
Study Participants and Study Design
Using a computer-aided telephone interviewing technique, the Hunter Valley Research Foundation (HVRF) recruited adults aged 65 years and above who lived in the Central Coast area. Community individuals were randomly selected from extracts of the Australian Commonwealth Electoral Roll. Individuals from 12 participating retirement villages located in the same electorates were randomly selected from retirement village lists. Participants were eligible for the RHLS if they were ≥65 years of age, their primary residence was located within the Wyong or Gosford local government areas, and they had been living at their current address for ≥12 months. People were ineligible for the RHLS if they were not independently living or were residing in a communal setting other than a retirement village, had been living in the area for less than 12 months, and/or were in the process of relocating. Individuals were also ineligible if their listed address was not their primary residence or another member of their household was taking part in the study. People with language and/or other communication difficulties, or who were cognitively impaired and/or unable to provide informed consent, were also excluded.
A total of 831 participants were recruited for the RHLS: 419 community and 412 retirement village residents. Each participant was assigned a unique identification code. Those with odd number identification codes, 400 participants, were assigned to the neighborhood environment IMI audit selection group from which a random sample of 300 participants was drawn for inclusion in the IMI audit. This sample was stratified by community and retirement village, and each stratum randomly sampled by computer, to achieve the required number of participants. Audits using the 162-item IMI were conducted for 292 participants with 150 living in the community and 142 living independently in retirement villages. These participants form the study population for this article.
Ethics Approval
All participants provided written informed consent, and ethics approval for the study was obtained from the University of Newcastle Human Research Ethics Committee (Reference No. H-2008-0431) and the Northern Sydney Central Coast Human Research Ethics Committee (Reference No. 1001-031M).
The Neighborhood Environment Data
The IMI
The IMI audits of participant neighborhoods commenced in October 2011 and were completed by June 2012. Each IMI neighborhood audit was undertaken within 3 months of the participant entering the study.
The neighborhood was defined as an area within a 400 m radius of each participant’s home. According to McMillan and colleagues, an area within the boundaries of a circle is likely to capture most areas to which a resident may be exposed on a daily basis. Also, the straight line distance allows for capture of distance traveled on footpaths and short cuts (McMillan et al., 2010). A distance of 400 m radius between destinations is generally accepted as a comfortable walking distance for most older people (Pikora et al., 2002).
There are two versions of the IMI: one for linear settings, that is, made up of a network of streets or the equivalent of streets such as pedestrian streets, and the other for nonlinear settings such as university campuses that are not readily organized into streets or regularly intersected by street networks (Day, Boarnet, & Alfonzo, 2005). We opted to use the linear version and adhered to the IMI codebooks (Day et al., 2005) noting any modifications in a “Supplementary Codebook,” including changes to use in retirement village settings that may be nonlinear in structure.
Training
A classroom training session and field practice based on a training program provided by the IMI authors (Day et al., 2005) were conducted by URBIS. A pilot audit of 16 segments in a community setting, and the area within one retirement village, helped the auditors to become familiar with the IMI tool and to identify any technical issues with the Microsoft ACCESS database available online (Day et al., 2005).
Data collection—General
Printed maps for neighborhoods within a 400 m radius of each participant’s primary address were provided by URBIS. All audits were conducted by the same two Public Health research staff working together (henceforth referred to as the auditors), as these were mostly conducted by car with one driving (mostly the same person) and the other conducting the audit. This was found to be an efficient approach with distances to travel to and from sites and time restrictions, as well as giving the ability to discuss and resolve audit issues on-site.
The two auditors were asked to keep a diary of their impressions of item variability across segments and item importance in terms of encouraging walking or other physical activities. Subjective items were discussed and agreement reached on how these were assessed (Online Supplement 1 [S1], Appendix A). Field data were entered directly into a modified IMI ACCESS database loaded onto an HP EliteBook 2530p notebook computer. Participants were identified by ID code number only. All data were checked on at least two occasions by the same auditor.
Data collection—Community and retirement village settings
In this study, data were collected using the “adaptive sampling” strategy (Day et al., 2006) in accordance with the instructions provided in the comprehensive IMI codebooks (Day et al., 2005). Using this approach, streets were divided into segments defined as a section of street or road (both sides) generally bounded by intersections or its equivalent, for example, a pedestrian pathway (Day et al., 2005; Pikora et al., n.d.). Up to three adjacent segments could be skipped if these did not differ from the preceding segment. However, the fourth segment was audited regardless of whether it was the same as the others. This “1 in 4” approach is based on differences according to four key environmental features: land uses, sidewalk network, barriers, or a “nice place to walk” (Day et al., 2005). While most audits were conducted by car, some segments in each neighborhood were walked to get a feel for the area and to record important street features missing or differing from the printed maps. The Central Coast is characterized by urban sprawl with areas of low-density housing and long homogeneous streets of single detached homes. Neighborhoods vary in street patterns such as grid or nongrid patterns or a mix of both (Online Supplement 2 [S2] Maps; see Images A-C). In consultation with URBIS, it was agreed that streets with no significant variation along the length could be classified as one segment regardless of the number of intersections. The decision was made with care for the “1 in 4” approach. The random selection of retirement village residents for neighborhood audits captured 11 of the 12 retirement villages included in the RHLS. Retirement villages ranged from small villages that were wholly contained within a 400 m radius to villages akin to “suburbs within suburbs” with their own private streets (Online S2 Maps; see Images D-E).
Development of a locally relevant inventory
At the completion of the data collection phase, discussions held by the research team regarding the auditors’ impressions for item variability, and/or importance or relevance, shaped the development of a locally relevant inventory. In accordance with suggestions from the IMI authors to utilize domains and/or items of interest (Boarnet et al., 2006; Day et al., 2006), the original IMI was adapted to best capture the neighborhood environment of older adults living on the Central Coast, Australia. Eighty IMI items were excluded from the IMI–RHLS tool. Reasons for exclusion are provided in Online S1 Appendix B, together with the 162-item IMI line numbers for each excluded item. The remaining 82 IMI items were selected for inclusion in a first-round locally relevant scale. Two of these items (IMI Line No. 71 and 89) were combined to create a single item (ocean/beach). Four non-IMI items, the presence of flats/apartments ≥3 storys, day care centers, refuge islands, and bus stops without seating, were added to create an 85-item IMI–RHLS inventory. The 85 items were grouped by category under five domains identified by the study team, which proved similar to those used by the IMI authors: Accessibility, Land Use Mix (measuring variety more than density), Safety From Traffic, Safety From Crime, and Pleasantness (refer to Online S1, Appendix C). The key issues and challenges encountered when using the IMI in an Australian regional setting are provided in Online S1 Appendix D along with potential solutions.
Domain scoring
The IMI does not come with a scoring method, and researchers need to develop their own scales from the raw data. All categories were scored using “1” or “0” to indicate the presence or absence of items listed within the category, with the exception of categories assessed at both ends of a segment (crossings, crosswalk markings, signals). These categories were scored as “2,” “1,” or “0” to indicate the presence of the category item(s) at both ends, one end, or neither end of the segment, respectively. Complete domain construction and scoring methods are available upon request. The 162-item IMI audit was conducted on 2,610 segments (1,136 segments in the community sample, 1,474 in the retirement village sample), giving an average of nine segments per participant. A segment’s domain score was calculated by summing the scores for the categories within the domain (Online S1, Appendix C). A participant’s IMI domain scores were calculated as the mean of the segment IMI scores across all segments measured within a 400 m radius of the participant’s dwelling. A higher domain score indicates higher walkability.
Other neighborhood data
Self-report data were collected using a custom-designed map-based survey to find out whether participants had a main walking route within a 400 m radius from their home, how often they walked this route, and the destinations they walked to. For the purpose of this article, the map-based survey was used to confirm whether the participant had a regular walking route or not. Of the 292 IMI participants, 285 (97.6%) completed the map-based survey, and 214 (75.1%) indicated that they had a main walking route.
Health and Physical Activity Data
All RHLS participants were asked to take part in an interviewer-administered questionnaire (IAQ), providing information on sociodemographics and levels of physical activity. In particular, total time and occasions of walking and walking in the participant’s neighborhood were assessed. The physical activity items relevant to the current analyses were adapted from the Active Australia Survey (Australian Institute of Health and Welfare [AIHW], 2003) and the RESIDE Study (Giles-Corti et al., 2006). Defining questions and calculations for sufficient physical activity, time spent walking, time spent walking locally, and occasions of walking are provided in Online S1 Appendix E.
Physical component summary (PCS) scores
The SF-12v2 provides a self-report PCS score—a measure of physical health (Medical Outcomes Trust, 2006). This score could be calculated for 270 participants (143 community, 127 retirement village).
Statistical Analysis
The databases were processed with the SAS 9.3 and Enterprise Guide 6.1. Statistical significance was set at p < .05. All tests for association were nonparametric.
Results
Snapshot of Participant Characteristics by Setting
The mean age for the 292 participants was 75.6 years for those living in the community and 79.5 years for retirement village residents. There were more females than males in both the community (51%) and retirement village (62%) groups. Considerably more community participants reported being married (61%) than retirement village participants (27%) with more retirement village participants being widowed (53%) than community participants (30%).
Participants from the community and retirement villages generally reported their health as “good” (36% and 38%, respectively) or “very good” (33% and 32%). More retirement village participants reported their health as “fair” (17%) than those in the community (14%). They were also more likely to report being “very satisfied” with their physical ability to “do what they want to do” than community participants (36% and 29%, respectively). More retirement village residents were also “completely dissatisfied” with their physical ability to “do what they want to do” than community participants (14% and 1%, respectively). PCS scores from the SF-12v2 for the community and retirement village groups were not statistically significantly different (Z = 1.80, two-sided Pr > |Z| = 0.07). Overall, 67.7% of participants considered themselves sufficiently physically active to achieve health benefits (Online S1, Appendix E). There was no statistically significant difference in this measure across the two settings, χ2 (1, N = 289) = .02, p = .89. Overall, only 7.5% of people nominated a better or safer walking environment as something that would assist them in becoming more physically active (Online S1, Appendix E). There was no statistically significant difference in this across the two settings, χ2 (1, N =291) = .02, p = .89.
Neighborhood Environment Data
Snapshot of Central Coast neighborhood environmental characteristics
On average, a segment took 15 to 20 min to audit. The Central Coast was characterized by low-density residential housing (95.2% of segments) with 15.7% of segments containing commercial or civic amenities, and 7.3% with retail activity. Most segments did not have vertical mixed use. More than half of segments provided greenbelts/trails or paths other than footpaths (sidewalks). This included cut-through or access points between streets other than alleys (Online Supplement 3 [S3] Photos; see Images A-C). Public spaces (plaza, square, park, playground, open space, playing fields, gardens) were seen in more than one third of segments (34%; Online S3 Photos; see Images D-F), gathering places in 26.9%, and recreational spaces in 16.2% of segments. Most segments did not have dedicated crossings (85.0%), and comprised one-lane (76.1%) or two-lane (16.0%) roads. Segments were mostly scored as adequately maintained (94.3%), while some (21.0%) had graffiti. Natural surveillance in 58.7% of segments was lessened by somewhat visible or prominent garages. However, 85.6% of segments contained homes with some or “a lot” of porches, a safety feature promoting natural surveillance. Footpaths (sidewalks) were on one (35%) or both (9%) sides of segments, and 38% of footpaths were complete. Most segments (84%) provided some footpath shade from trees along the nature strip or large trees in the front yard of homes. Sixty-seven percent of segments had no benches, 17.1% had some, and 15.7% had “a lot” of benches. More than half (52%) of the segments had an open view with most views considered attractive.
IMI domain scores by segments for two settings
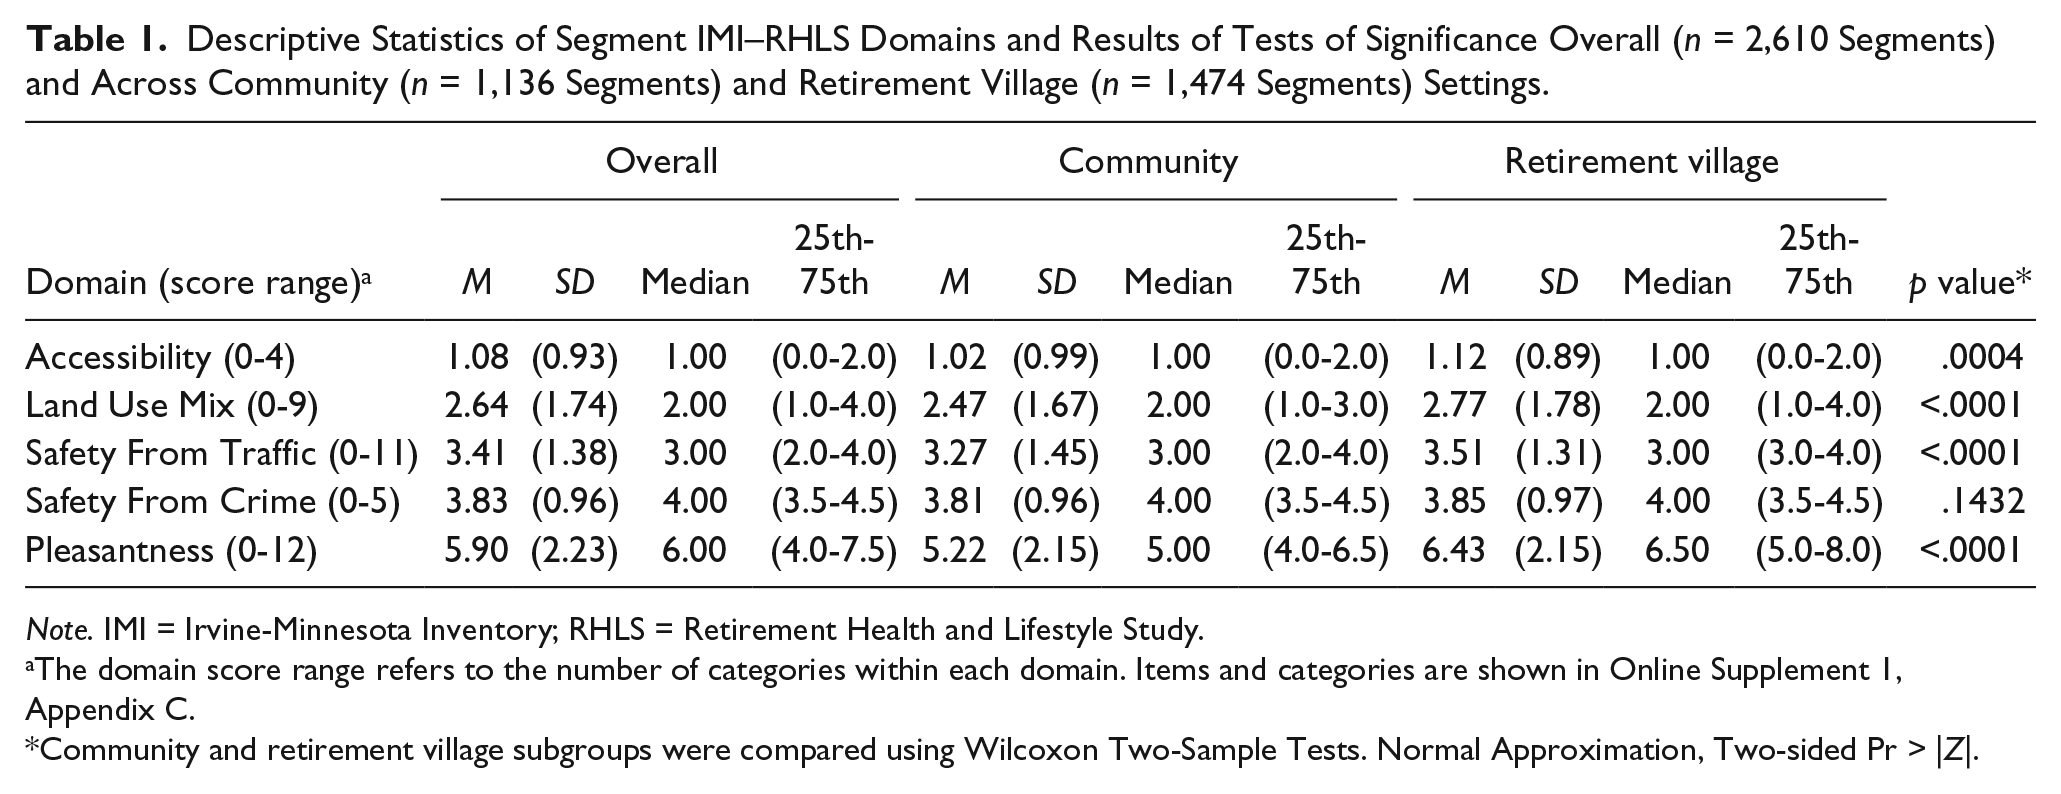
Tests for differences in segment IMI domain scores and participant IMI domain scores across the community and retirement village settings are presented in Tables 1 and 2, respectively. All segment IMI domain scores and participant IMI domain scores were higher in the retirement village setting than in the community setting, indicating higher walkability, except for Safety from Crime, which showed no statistically significant difference in either analysis.
Descriptive Statistics of Segment IMI–RHLS Domains and Results of Tests of Significance Overall (n = 2,610 Segments) and Across Community (n = 1,136 Segments) and Retirement Village (n = 1,474 Segments) Settings.
Note. IMI = Irvine-Minnesota Inventory; RHLS = Retirement Health and Lifestyle Study.
The domain score range refers to the number of categories within each domain. Items and categories are shown in Online Supplement 1, Appendix C.
Community and retirement village subgroups were compared using Wilcoxon Two-Sample Tests. Normal Approximation, Two-sided Pr > |Z|.
Descriptive Statistics of Participant IMI–RHLS Domains and Results of Tests of Significance Overall (n = 292) and Across Community (Comm, n = 150) and Retirement Village (RV, n = 142) Settings.

Note. IMI = Irvine-Minnesota Inventory; RHLS = Retirement Health and Lifestyle Study.
The domain score range refers to the number of categories within each domain. Items and categories are shown in Online Supplement 1, Appendix C.
Community and retirement village subgroups were compared using Wilcoxon Two-Sample Tests, Normal Approximation, Two-sided Pr > |Z|.
Physical Activity Data Analysis
Forty-nine percent of participants reported sufficient physical activity. One hundred twenty participants (41.7%) reported having not walked locally for more than 10 mins in the last week. Of those who did walk, 76.6% reported that all their walking time was spent locally, 67.8% reported walking continuously for at least 10 mins on one or more occasions in the last week, and 75.3% reported doing all their occasions of walking locally. Other physical activity measures for all participants are summarized in Table 3.
Descriptive Statistics for Overall Time and Occasions of Physical Activity and Walking.

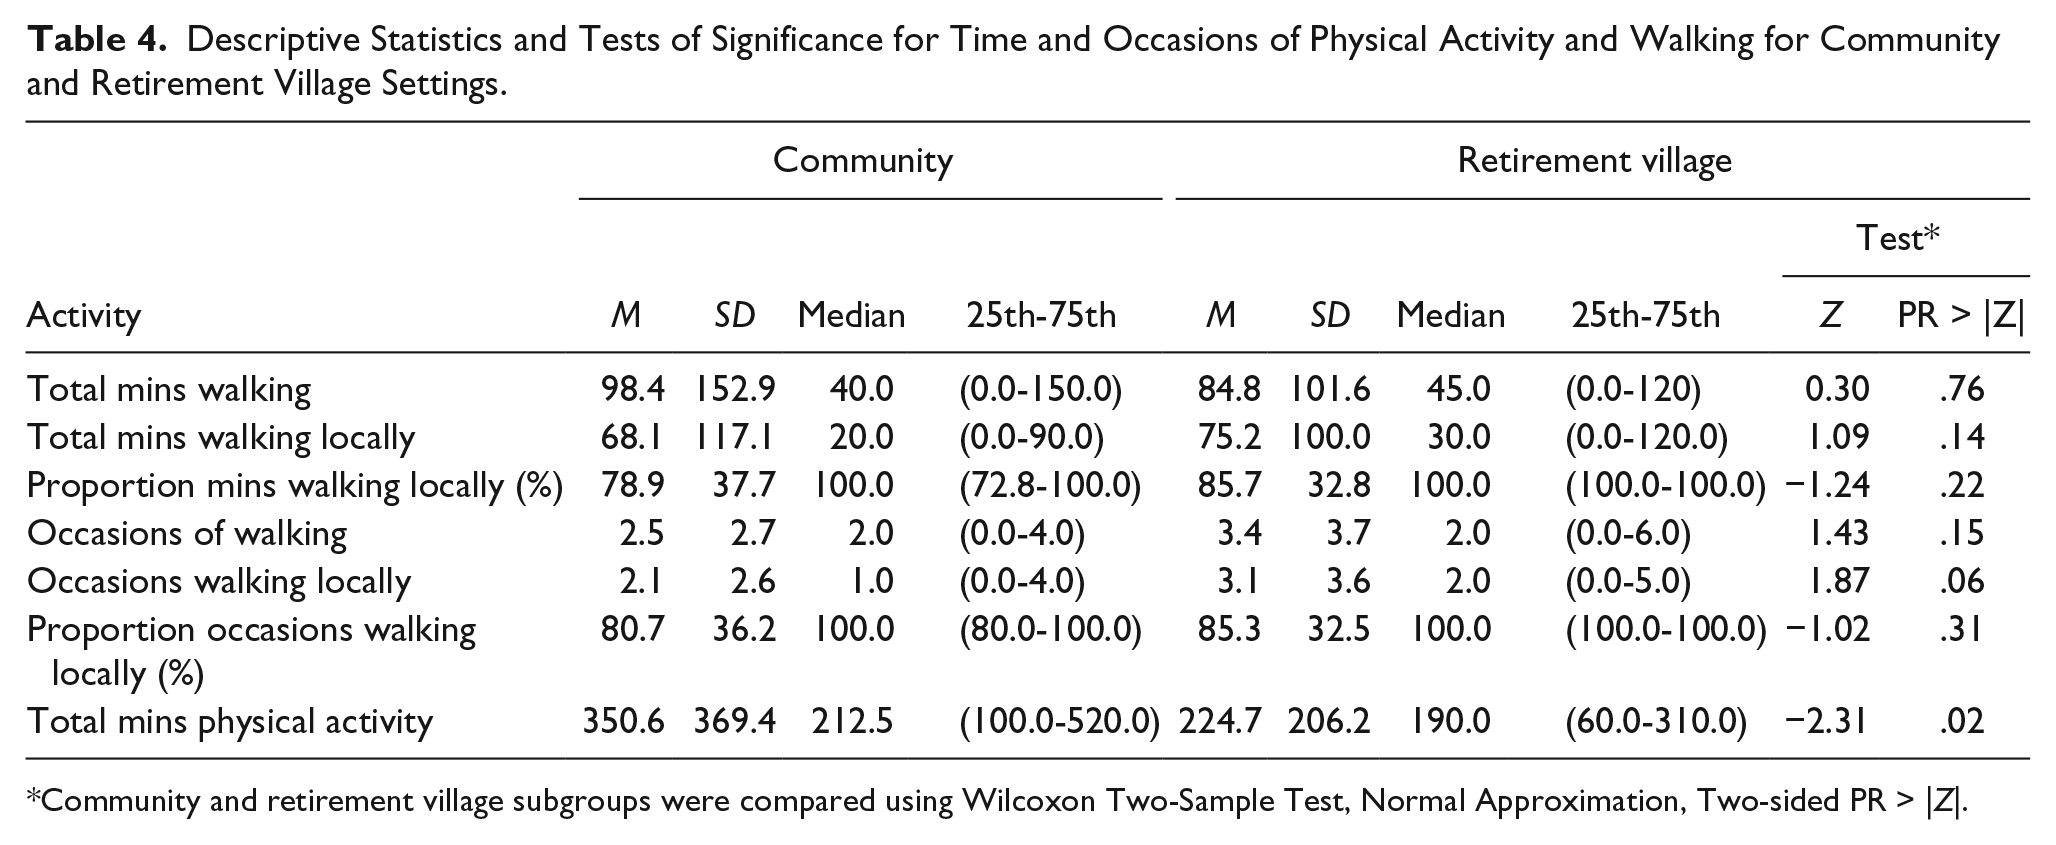
A higher proportion of community participants (54%) reported sufficient physical activity than retirement village participants (43.9%), but the difference failed to reach statistical significance, χ2 (1, N = 289) = 2.95, p = .09. Descriptive statistics for measures of physical activity by setting (community/retirement village) are presented in Table 4, with tests for differences across settings. There were no statistically significant differences across settings for time spent walking, time spent walking locally, the proportion of time spent walking locally, occasions of walking, occasions of walking locally, or the proportion of occasions spent walking locally. Community participants reported more minutes of total physical activity in the last week than those living in retirement villages.
Descriptive Statistics and Tests of Significance for Time and Occasions of Physical Activity and Walking for Community and Retirement Village Settings.
Community and retirement village subgroups were compared using Wilcoxon Two-Sample Test, Normal Approximation, Two-sided PR > |Z|.
Relationship Between Physical Activity and Domain Scores
Associations between the IMI–RHLS domains and measures of walking are presented in Online S1 Appendix F, Tables F1 to F5. There was no association overall between the five IMI–RHLS domains and total minutes of walking (Table F1). There was no association between the domains and total minutes of walking by setting apart from the domain of Pleasantness. This showed that in the community setting (low walkability), high levels of Pleasantness were associated with high levels of total walking time, whereas in the retirement village setting (high walkability), high levels of Pleasantness were associated with low levels of walking time.
There was no association overall between the five IMI–RHLS domains and minutes spent walking locally (Table F2). Tables F3 and F4 lend support, with no association between the domains and total occasions of walking and occasions of walking locally, nor was there an association between the domains and occasions of walking by setting or occasions of walking locally by setting. Likewise, there was no association found between the five domains and total minutes of activity overall or by setting (Table F5). Table 4 shows a difference between the total minutes of physical activity between the two settings (the mean being higher in the community). However, when this was broken down into domains (Table F5), we found no difference between the two settings.
Domain Scores and Sufficient Physical Activity
IMI–RHLS domain scores were compared between participants reporting sufficient and participants reporting insufficient physical activity. The results for all participants, and for community and retirement village participants, are presented in Online S1 Appendix G, Tables G1 to G3. Overall, sufficient physical activity was associated with lower scores in the domains of Accessibility, Land Use Mix, and Pleasantness (Table G1). No associations were detected between sufficient physical activity and the domains of Safety From Crime or Safety From Traffic (Table G1). There were no associations found between sufficient physical activity across the IMI–RHLS domain scores in the community setting (Table G2). However, an association between sufficient physical activity and the domain of Pleasantness was evident in the retirement village setting (Table G3).
Discussion
Participating retirement village residents were 4 to 5 years older than their community counterparts. While they rated their health a little less favorably than community participants, they generally felt more satisfied with their physical ability to do what they want.
Our study showed that the domain scores calculated from our 85-item IMI–RHLS can detect environmental differences between two settings, in this instance, the community and retirement village settings. This difference can be taken to represent a more walkable environment in retirement villages. Our findings indicate that the built environment, as assessed by this tool, was not associated with physical activity or walking in adults aged 65 years and above for any of the measures assessed, except total physical activity where lower walkable environments were associated with higher total physical activity. This study was unable to detect substantive links between the neighborhood environment and physical activity among older adults. Perhaps factors such as living in well-maintained and pleasant surroundings, rich in facilities near to homes, have a reverse effect on the walking that public health seeks.
Validating the 85-Item IMI at the Domain Level
Data from more than two and a half thousand segments were reviewed and formed the basis for this study. The 85 IMI–RHLS items were considered relevant to the setting and sufficiently variable for inclusion in domains. While the shapes of the IMI–RHLS domain score distributions required the use of nonparametric methods, the utility of the scoring tool was supported by its ability to distinguish between community and retirement village geographies on the basis of these tests.
For this study, we elected to use the original 162-item linear version of the IMI to ensure that we had a complete dataset from which to determine the items most effective for use in an Australian context. While shorter IMI tools have since been developed by Boarnet and colleagues (2011, p. 737), such tools are considered to be more useful for the characterization of the overall “goodness” of the walking environment rather than for identifying the specific features of a built environment associated with physical activity or walking. Restricting items in data collection may also limit the generalizability of a tool to other settings (Schopflocher, VanSpronsen, & Nykiforuk, 2014).
Our 85-item IMI–RHLS is similar to the IMI short version proposed by Boarnet and colleagues (2011). Interestingly, the same 31 items identified in Boarnet’s U.S. study as having little or no variation across segments due to scarcity were also found to have little or no variation in this study. However, despite their low variability, we retained 14 of the 31 items, such as traffic safety features or destinations (e.g., shopping malls, libraries, beach), in the final 85-item RHLS inventory as they were considered likely to encourage walking in older adults. Other items of no or low variability or perceived low importance to this study were excluded, for example, bars on windows, fountain or reflecting pool, and street vendors.
There were few issues with the application of the IMI apart from it being time and resource intensive. As with Gasevic and colleagues, challenges included the lack of ability to note seasonality (impacts on use and perception of the environment), presence of large trees in front yards (providing good shade across footpaths and streets), adequacy of street lighting (adequacy does not equate with good lighting), and for auditors to discern steep from moderate slope (Gasevic et al., 2011). To add to the exchange of ideas concerning the use or refinement of the IMI in different settings, S1 Appendix D (online) offers specific local challenges and potential solutions.
Our customized scoring tool was based on the least contentious option of recording items as either present or absent. In a study of 42 Canadian communities, Gasevic et al. (2011) also found the IMI response categories of “many,” “few,” and “none” problematic, preferring to dichotomize variables.
We allocated items to five RHLS-designed domains of Accessibility, Land Use Mix, Safety From Traffic, Safety From Crime, and Pleasantness. The 40-item domain of Land Use Mix comprised 13 items from the Pleasurability and 27 items from the Accessibility domains of the original IMI. Other RHLS domains were similar to the original IMI with differences generally due to items that could be assigned to multiple domains. For example, “vertical mixed use” can apply to Land Use Mix, Accessibility, or Safety From Crime (improving natural surveillance). The results presented in Tables 1 and 2 show that the IMI–RHLS scoring tool was able to discriminate between community and retirement village settings across all domains except Safety from Crime.
Neighborhood Environment and Sufficient Physical Activity
Retirement villages scored higher than the community for walkability on all domains except Safety From Crime. If neighborhood walkability makes an important contribution to the amount of physical activity in which its residents engage, we would expect to find higher levels of physical activity, particularly local walking, in the retirement village setting. However, only one of the physical activity measures showed a difference across settings, with total minutes of physical activity among community residents scoring higher than retirement village residents.
Differences in study design and outcome measures
Reporting at the domain level could mask potentially important items or environmental features associated with walking or other physical activities. Drilling down to item-level features, that is, focusing on specific environmental features such as presence of a park, complete footpaths, or intersection density may be more effective in revealing important associations between the neighborhood environment and physical activity and walking. For example, one study found no association between the built environment and the odds of walking or not (Nagel et al., 2008). However, for those who did walk, the average time spent walking was associated with automobile traffic and commercial establishment density. Another study found that only high levels of walkability (measured by land use mix, residential density, street connectivity), where destinations were nearby, were associated with walking in the above 65 years age group (Frank et al., 2010).
Differences in study designs, survey tools, and outcome measures may also account for inconsistencies in the findings between studies. Furthermore, studies on older adults are increasing but remain relatively scarce, and more research is required to better understand the links between the neighborhood environment and physical activity in the older adult (Hoehner et al., 2005; Li et al., 2005; Nagel et al., 2008; Weiss et al., 2010).
Outdoor walking behavior in older adults
In this study, the built environment was not associated with physical activity or walking in adults aged 65 years and over. The only difference across the two settings was total minutes of physical activity with community residents scoring higher than retirement village residents. While our retirement villages offered more walkable environments, residents may only be engaging in incidental walking over short distances such as walking to the post boxes or their rubbish bins or to amenities and facilities located close to home (Chaudhury et al., 2012). As noted earlier, retirement villages rich in amenities and facilities located a short distance from home could potentially reduce time spent walking by residents (Nathan et al., 2014). This may affect total physical activity time.
One measure of walkability is Pleasantness leading us to expect a positive association between Pleasantness and high levels of total walking time. However, this was only found in the community setting, the effect being reversed in the retirement village setting. That is, in a less pleasant environment (community), Pleasantness was positively associated with walking time. However in a comparatively highly pleasant environment (retirement village), Pleasantness was negatively associated with walking time. There may be a subtle balance between pleasantness and walking time where “too much of a good thing” acts as a tipping point into less walking time. Perhaps retirement village residents are content to enjoy their pleasant environment passively.
In the current study, the measure of total physical activity included gardening, household chores, activities that make people huff and puff, and walking. We raise the question “Are community residents generally more active because of the nature of their home and neighborhood?” Community residents are more likely to have larger houses, larger yards (more household chores, higher intensity gardening), and facilities located further from their home, potentially resulting in more physical activity among community residents than retirement village counterparts. There may exist a delicate balance between the number and proximity of amenities and facilities and time spent walking (Berke et al., 2007).
Buffer zones, physical activity, and walking
Researchers have raised the question of whether walkability is related to the size of the buffer zone. In our study, taking the setting as a proxy for “walkability” (the IMI–RHLS domain scores indicate that retirement villages were generally more walkable), we were unable to find an association between walkability and physical activity at the 400 m buffer zone. These findings are in keeping with studies that show neighborhood walkability may not be related to sufficient physical activity in older adults (Nagel et al., 2008).
A potential confounding factor is the size of the participating retirement villages, which varied from large “suburbs within suburbs” villages to small villages (Online S2 Maps; see images D-E). In the former, it was common for a resident’s 400 m neighborhood to be fully encompassed within the boundaries of the retirement village, whereas in smaller villages resident neighborhoods often included a large proportion of community streets and facilities. Small villages located on the outskirts of urban areas were also potentially confounded by poorer access to facilities, either retirement village or community.
Study Limitations
The current study has a number of limitations. The selection of neighborhood environments depended on the RHLS participant selection protocol rather than a randomized selection of land areas in residential land use. This may have some impact on the amount of variation in built environment features measured by the IMI (Boarnet et al., 2011). Changing the segment definition for long homogeneous streets may have affected items measuring neighborhood identification and street conditions at both ends of a segment. The score for the Accessibility domain may be misleading in some situations. For example, a neighborhood that included a cul-de-sac with pedestrian access and an alley will score 2 of a possible 4 points, whereas a seemingly more accessible neighborhood with numerous paths/greenbelts/other sidewalks will only score 1 point. Some neighborhoods were not in grid form; thus, streets were not necessarily adjacent to each other. In this case, the auditors determined the closest fit by selecting segments in close proximity. Some participant neighborhoods shared segments (i.e., overlapped), so some segments were captured more than once. As previously noted, a number of retirement village residents living in small villages or on the edges of large villages may have had many community segments in their 400 m buffer zone.
Another potential limitation was that the tool used was not specifically designed for seniors, and there was no consultation process with older adults in the design of the tool. This lack of community consultation may be an inherent flaw in observational studies of this kind (Schopflocher et al., 2012). Also, participant perception can be related to whether people walk or not, which is not addressed in this article. In this regard, auditors’ responses to subjective items, for example, those associated with aesthetics, were possibly influenced by their own life experiences and generational likes, dislikes, and other biases.
The IMI provides a validated yet adaptable way of describing the physical environment that captures five broad areas of interest that may provide a window to those groups of features that offer the best opportunity to facilitate behavior change. In focusing our attention on these domains, we offer readers the opportunity to compare their environment with ours, at a higher level than the items that comprise the domain. Once the important domains have been identified, the identification of items associated with physical activity is worthy of investigation but outside the scope of this article.
Conclusion
Although we found the retirement village setting to be more walkable than the general community, we found no association between the walkability of the built environment and walking behavior in those aged 65 and above. The integration of built environment features that most strongly support physical activity is seen as key to the development of strategies for chronic disease prevention. Yet, the evidence for this in the older age groups remains patchy at best. There is still a need to establish just which qualities of the built environment affect various types of physical activities in this age group. Our finding suggesting that a too pleasant environment may be associated with less walking in the elderly is of concern and deserves further investigation.
Footnotes
Acknowledgements
We are grateful to the Australian Research Council (ARC Linkage Project Grant LP0883378), UnitingCare Ageing New South Wales. ACT, Urbis Pty Ltd, Valhalla Village Pty Ltd, and Hunter Valley Research Foundation for funding the initial study, and to the men and women of the Central Coast region who provided the information recorded. The Central Coast Retirement Health and Lifestyle Study (RHLS) Research Group also wish to acknowledge and thank the contribution of Nicole Armstrong, Elizabeth Death, Tina Navin-Cristina, Michelle Micallef, Jenny Marriott, Jacqueline Ohlin, and RHLS and Hunter Valley Research Foundation interviewers.
Authors’ Note
The research on which this article is based was conducted as part of the Retirement Health and Lifestyle Study, The University of Newcastle.
Declaration of Conflicting Interests
The author(s) declared no potential conflicts of interest with respect to the research, authorship, and/or publication of this article.
Funding
The author(s) disclosed receipt of the following financial support for the research, authorship, and/or publication of this article: The Retirement Health and Lifestyle Study was supported by an ARC Linkage Project Grant (LP0883378). The conduct of the Irvine-Minnesota Inventory did not receive funding from participating retirement villages. Staff and resources were provided in-kind by the Central Coast Local Health District, the University of Newcastle and Urbis Pty Ltd.

Author Biographies
References
Supplementary Material
Please find the following supplemental material available below.
For Open Access articles published under a Creative Commons License, all supplemental material carries the same license as the article it is associated with.
For non-Open Access articles published, all supplemental material carries a non-exclusive license, and permission requests for re-use of supplemental material or any part of supplemental material shall be sent directly to the copyright owner as specified in the copyright notice associated with the article.
