
Abstract
Federal policies have aimed to improve access to grade-level curriculum for students with disabilities (SWD). Current conceptualizations of access posit that it is evidenced by students’ academic outcomes. In a meta-analysis of 180 effect sizes from 23 studies, we examined access as outcomes by estimating the size of the gap in reading achievement between students with and without disabilities. Findings indicated that SWDs performed 1.17 standard deviations, or more than 3 years, below typically developing peers. The reading gap varied by disability label but not by other student and assessment characteristics. We discuss implications for access to grade-level curriculum and potential reasons for why the achievement gap is so large despite existing policies.
Since passage of the Education for All Handicapped Children Act of 1975 (EHA; hereafter PL 94-142), parents, researchers, policy makers, and others concerned about the academic outcomes of students with disabilities (SWDs) have argued over what defines educational “access.” Access was initially conceptualized in PL 94-142 as “location,” for example, neighborhood schools or general education classrooms. It is currently understood as access to grade-level curriculum and is measured by students’ academic progress. In other words, students are considered to have access to a curriculum only if they are making progress in that curriculum (L. Fuchs et al., 2015).
This more recent understanding of access, defined in terms of academic outcomes, has drawn attention to the poor academic performance of many SWDs. It is unclear, however, just how poor their performance really is because estimates of the achievement gap between students with and without disabilities are often undermined by imprecise metrics and other considerations. In this article, we describe a meta-analysis of 23 studies to determine the size of the achievement gap in reading between SWDs and their nondisabled peers and explore moderators of the achievement gap. We begin by reviewing the history of access and accountability for SWDs in the United States to explain the importance of examining student outcomes as a measure of access to the general curriculum.
Defining Access in Federal Policy
Access as Location
The authors of PL 94-142 famously claimed that SWDs were traditionally excluded from public schools, that the schools failed to identify children who had disabilities, and that the parents of such children were burdened with finding alternative placements beyond the public school system despite evidence that the schools could meet their children’s needs. PL 94-142 focused on the identification and placement of SWDs in neighborhood schools or general education classrooms, a basic form of access (EHA, 1975). The monitoring requirements of the law reinforced this focus. Schools and states were required to report the number of SWDs identified in each disability category and the school setting in which they spent their days. PL 94-142 gave SWDs the right to have specialized instruction through an individualized education program (IEP), but schools were not held accountable for the students’ academic gains. Access and accountability were defined as identification for services and the physical locations where SWDs were presumably educated.
Access as Participation in Assessments
In the 1990s, states adopted standards-based reform policies in general education. Standards-based reforms intended to improve student outcomes as assessed by standardized assessments. States adopted educational standards and students were tested annually on their knowledge of the academic content and skills aligned with these standards. However, most states excluded SWDs from these assessments, and many did not hold schools accountable for SWDs’ academic outcomes (McDonnell, McLaughlin, & Motison, 1997).
The state-level standards-based reform movement influenced the reauthorization of PL 94-142 in the late 1990s. Whereas PL 94-142 won most SWDs access to schools, its reauthorization as the Individuals With Disabilities Education Act Amendments of 1997 (IDEA) aimed to facilitate access to curriculum standards and participation in high-stakes tests. The 1997 reauthorization expanded the impact of PL 94-142 by expressing the intent and expectation that schools should prepare SWDs for employment and independent living. In short, in contrast to PL 94-142, IDEA expressed the idea that “access” was to be understood as broadly improving student outcomes. This focus was evident in its requirement that states collect data on SWDs’ performance on state and district assessments, dropout rates, and graduation rates. However, the accountability requirements in IDEA were primarily for SWDs’ participation in state assessments rather than for targeting their academic outcomes (e.g., McDonnell et al., 1997).
Access as Outcomes
The reauthorization of the Elementary and Secondary Education Act (ESEA) as the No Child Left Behind Act of 2001 (NCLB; 2002) expanded the standards-based reform movement from state and local levels to the national level. NCLB relied on more ambitious standards and accountability as levers for improving outcomes for all students, and especially for those from traditionally disadvantaged backgrounds. An innovative and important component of NCLB was disaggregating assessment data to highlight gaps in achievement for various student subgroups. These subgroups were categorized by race, economic disadvantage, and disability status. For schools to obtain continued federal funding, 95% of students in each subgroup, including SWDs, were required both to participate in state assessments and to make progress toward closing the achievement gap between them and students not in these subgroups. In contrast to the IDEA requirements, schools were now held accountable by NCLB for both the inclusion of SWDs in testing programs and their academic achievement.
Despite concerns that NCLB accountability requirements conflicted with IDEA and created problems for schools (Eckes & Swando, 2009), the 2004 reauthorization of IDEA reinforced the importance of assessing and reporting SWDs’ outcomes. It retained the obligation that SWDs should be included in state assessments and added another that required states to report the performance of these students in comparison to the performance of all students. Implicit was an understanding that access to the general education curriculum (otherwise known as “inclusion”) required SWDs to be achieving at levels higher than what was previously expected of them. Although the 2004 version of IDEA is long overdue for reauthorization, the newest iteration of ESEA, Every Student Succeeds Act (ESSA; 2015), retains the requirement that schools report the achievement of SWDs as a separate subgroup. Both IDEA and ESSA make explicit that schools understand and demonstrate access in terms of how much SWDs learn. The achievement gap between SWDs and their peers without disabilities appears to be a standard for determining if SWDs are accessing the general education curriculum. Thus, the larger the gap, the more persuasive the argument that SWDs are not accessing the services and supports they need to succeed in school.
Both IDEA and ESSA make explicit that schools understand and demonstrate access in terms of how much SWDs learn.
Measuring the Achievement Gap
Using achievement gaps to highlight achievement disparities is not limited to policy reporting requirements. Many researchers have examined the achievement gap between students with and without disabilities, and most report that it is large (Albus, Lazarus, & Thurlow, 2014; Wagner, Newman, Cameto, Levine, & Garza, 2006). Some have provided estimates using data from state or national assessments (e.g., Albus et al., 2014; U.S. Department of Education, 2017). For example, Wagner et al. (2006) analyzed data from the National Longitudinal Transition Study-2 and found that high school SWDs scored, on average, 1.39 standard deviations below the normative test sample in reading comprehension on the Woodcock-Johnson III. Others have examined the achievement gap in terms of the percentage of students scoring above a proficiency cut point, an approach used frequently by states (Education Week, 2017; U.S. Department of Education, 2017). For example, Albus et al. (2014) reported that the achievement gap between students with and without disabilities at or above a proficiency cut point on state assessments ranged from 5 to 58 points across states. In sum, studies of the achievement gap involving state and national assessments show that many SWDs are not accessing the curriculum as measured by academic outcomes.
Researchers have also estimated achievement gaps to understand SWDs’ specific skill deficits (Cutting & Levine, 2010; Leach, Scarborough, & Rescorla, 2003; Park, Lombardino, & Ritter, 2013) or to learn more about achievement trajectories over time (Morgan, Farkas, & Wu, 2011; Wanzek, Otaiba, & Petscher 2014). For example, Morgan et al. (2011) used nationally representative data to identify how the gap in reading achievement between students with learning disabilities (LD) or speech language impairments (SLI) and their nondisabled peers changed over time. Students with LD or SLI began kindergarten with lower reading achievement than their typically developing peers, and these gaps persisted through fifth grade. Cutting and Levine (2010) compared the performance of students with reading disabilities to students without disabilities on a battery of assessments. Depending on the outcome, students with reading disabilities performed on average 0.45 to 1.05 standard deviations below students without disabilities. Estimates of the achievement gap from norm-referenced tests suggest that SWDs are lagging behind their nondisabled peers in reading achievement.
Limitations in Estimates of the Achievement Gap
The large gaps in achievement between SWDs and their nondisabled peers documented by prior research suggest that numerous SWDs are not accessing the curriculum. However, there are at least five limitations to these existing estimates that complicate interpretations of their importance. The first limitation is that many researchers examined differences between percentages of students with and without disabilities scoring above a proficiency cut point. Proficiency gaps provide information about the number of students meeting a certain criterion; achievement gaps do not. Nevertheless, this approach can result in an underestimation of achievement gaps (Ho, 2008; Yee & Ho, 2015). For example, if a proficiency cut point is set at a perfect score, most students with and without disabilities will fail to reach the cut point. In this scenario, the proficiency gap between students with and without disabilities will be very small. However, mean score differences between the two groups could be large.
A second reason to question the validity of gap estimates is that many studies have grouped SWDs into one category, likely because some disability categories include very few students. This may mask differences in achievement by disability category. For example, among school-age SWDs in the United States, 20% have SLI and 6% have intellectual disabilities (National Center for Education Statistics, 2016). When, for reporting purposes, SWDs are grouped into one category, the higher-performing students with SLI increase the average achievement of SWDs because they make up a larger proportion of the SWD group than students with intellectual disabilities, who are likely to demonstrate lower academic achievement than SWDs in other disability categories (Blackorby et al., 2005). The achievement gap could appear smaller when SWDs are grouped together and larger when disaggregated by disability category.
Third, studies that estimate the reading gap between students with and without disabilities may be misleading if they use a test’s normative sample to determine the achievement of the nondisabled group because the normative average may greatly exceed the mean performance of typically developing students in a given low-performing school district. That is, using the normative population’s performance as a standard might overestimate the difference between students with and without disabilities in districts where most students are performing poorly.
Fourth, estimates of the gap in reading based on researcher-collected data may rely on smaller and less representative samples, resulting in estimates with limited generalizability. For example, Cutting and Levine (2010) recruited students to take part in testing after school hours at a local university. These students might not have been representative of students with reading disabilities who did not respond to the researchers’ recruiting materials. Additionally, researcher estimates of reading achievement may be more accurate than estimates from state assessments because researchers may use individually administered standardized measures that address specific skills, again decreasing the generalizability of the estimates.
Finally, estimates of the achievement gap vary across individual studies. This variation suggests that the estimates are influenced by (a) sample characteristics, such as disability categories, grade levels, and when the data were collected; (b) assessment characteristics, such as the constructs addressed by the assessments; and (c) if assessments were used for accountability purposes. For example, Wagner et al. (2006) documented variation in achievement levels across disability categories, suggesting that there was a larger gap for students with intellectual disabilities and a smaller one for students with SLI. Others have found that SWDs fall further and further behind their peers in school (Wanzek et al., 2014), potentially leading to larger gaps at the secondary level. The increased focus on SWDs’ academic achievement and inclusion in accountability systems could lead to a smaller achievement gap in samples of students collected after passage of NCLB. Estimates of the gap on high-stakes assessments may be smaller because many states permit test accommodations, including test retakes, that could artificially inflate the students’ performance (Jacob, 2007; Lai & Berkeley, 2012; Linn, 2000). A comprehensive discussion of the reading achievement gap must address these areas of potential variation.
Research Questions
The achievement gap between SWDs and their peers without disabilities describes the extent to which SWDs are accessing the curriculum. Despite accountability policies (i.e., IDEA, NCLB) that rely on reporting achievement gaps, existing estimates of the gap between students with and without disabilities provide limited information about access. We cannot make statements about SWDs’ access to the curriculum without accurate estimates of the size of the achievement gap and a better understanding of variables that influence it.
With this in mind, we conducted a meta-analysis of studies exploring the gap in reading achievement between students with and without disabilities. We specifically focused on reading because it is closely tied to school and postschool success (Miller, McCardle, & Hernandez, 2010). By combining data across studies with different student samples and various reading measures, we obtained a broader, more representative, and presumably more accurate estimate of the gap in reading achievement. Our meta-analysis also allowed us to examine associations between student and assessment characteristics and the size of the achievement gap. Our intention was not to assess the causal impact of policies on SWDs’ outcomes but to raise questions for future study regarding the access of SWDs to the general education curriculum.
Based on prior research, we developed a number of hypotheses. These included that the magnitude of the gap would vary as a function of disability category, that the gap would be larger in secondary school than at the elementary level, and that the gap would appear smaller after passage of NCLB. We also expected a smaller achievement gap when it was measured by high-stakes assessments and by a reading composite score. Our specific research questions were as follows:
What is the average size of the reading achievement gap between school-age students with and without disabilities in the United States?
To what extent is the gap moderated by sample characteristics (type of disability, school level, and whether testing occurred before or after NCLB) and assessment characteristics (high- or low-stakes tests and whether “reading” was defined as reading comprehension or as a composite of various reading skills)?
Method
Literature Search
We searched titles and abstracts in 11 ProQuest databases, PsycARTICLES, PsycINFO, and PubMed for terms including special education, the disability categories outlined in IDEA, reading, achievement gaps, grade and school levels, and students without disabilities. We limited these searches to studies in English that were published between January 1, 1997, and April 26, 2016. We used Google Scholar to conduct forward and backward citation searches of each manuscript identified as addressing achievement gaps. We hand-searched the table of contents of Exceptional Children, Remedial and Special Education, and The Journal of Special Education, the three highest-impact-factor journals in special education that are not focused on specific disability categories, from 1997 to 2017. We also searched government reports, reports from disability advocacy and nonprofit organizations, and reports from research and policy firms. We retained manuscripts or reports comparing the achievement of SWDs to their nondisabled peers. A comprehensive set of search terms and procedures are available in Appendix A as an online supplement.
We removed all duplicate items and followed a two-step process to identify studies that met the inclusion criteria. First, we screened each title and abstract and removed irrelevant records. A second researcher screened 30% of abstracts. Exact agreement for inclusion in the full-text review was 96.8%. Disagreements were reconciled through discussion. Second, we reviewed the full text of the remaining studies and eliminated studies that did not meet the inclusion criteria or met the exclusion criteria. A second researcher reviewed each full text; agreement for study inclusion was 93%, and disagreements were reconciled. We contacted study authors for more information if a study did not include information necessary to calculate effect sizes.
Search Criteria
We included studies that examined the gap in reading achievement between students with and without disabilities. Eligible studies for inclusion met these additional criteria: (a) They had a sample of SWDs who were defined as students with an IEP or with a disability specified in IDEA. (b) They had a comparison group of students without disabilities drawn from the same population as the SWDs (e.g., the same school, district, or state). (c) The data were collected after 1997 to ensure the continuity of disability labels under federal law. (d) The sample included students from kindergarten to 12th grade in the United States.
In regard to measures, included studies (a) assessed reading comprehension specifically or reported a reading composite score (i.e., combining performance on subtests of different skills into an overall reading outcome) and (b) reported data for calculating effect sizes (e.g., means, standard deviations, and sample sizes). We excluded studies that (a) created a comparison group of students without disabilities based on propensity score matching or matching on IQ, academic achievement, or language skills; (b) reported outcomes as a percentage of students scoring above proficient; or (c) drew student samples from clinical settings, such as special schools, hospitals, or juvenile detention centers.
Figure 1 summarizes the study selection process. When studies were published versions of dissertations, we used information from the dissertation to code variables excluded from the published paper. When multiple studies used the same data, we included the study that provided the most detailed information about the variables of interest (e.g., multiple studies used the same wave of the Early Childhood Longitudinal Study–Kindergarten Cohort). The 23 studies that met the inclusion criteria included three published reports, eight dissertations, and 12 journal articles. They are marked in the Reference section by asterisks and described in the online supplement Appendix B. We calculated 180 effect sizes from the 23 studies.

Flow chart showing the study selection process.
Coding of Studies
For each study that met our inclusion criteria, we coded study sample and assessment variables to describe the studies and for use in the moderator analyses. Study sample characteristics included (a) the year or years in which the data were collected, (b) disability type, (c) chronological age or grade level, (d) the level at which the data were collected (national, state, district, school, or researcher collected), (e) how student disability was determined, and (f) characteristics of students excluded from analyses. We used the years the data were collected, disability type, and age or grade level as moderators. We recoded student grade or age to school levels, categorizing Grades K–5 as elementary school, Grades 6–8 as middle school, and Grades 9–12 as high school. We created a dummy variable indicating if the study sample was constituted prior to or following implementation of NCLB in 2002.
We also coded features of the reading measures to describe the studies and for use in the moderator analyses, including their names; the constructs they explored (e.g., comprehension); how they were administered (e.g., individually or in a group); whether they were high stakes; the nature of the tasks (e.g., recall or multiple choice questions); whether retests were permitted; and whether test accommodations were given (e.g., extended time or questions read aloud). We used two of these variables as moderators: an indicator for whether a measure assessed reading generally or reading comprehension specifically, and an indicator for whether a measure was high stakes.
We coded variables used to calculate effect sizes (means, standard deviations, sample sizes, regression coefficients, and/or standard errors). We calculated the Hedges’ g effect size measure (Hedges, 1981) for every comparison between SWDs and their peers. A second researcher coded each of the included studies. Exact agreement averaged 89.75% (80%–97.56%). Discrepancies were discussed until we reached consensus.
Quantitative Analyses
We completed the quantitative synthesis using a random-effects meta-analysis (Borenstein, Hedges, Higgins, & Rothstein, 2009). Some studies included more than one comparison between students with and without disabilities, resulting in multiple effect sizes from a single study. We accounted for the dependency between effect sizes by using robust variance estimation (RVE; Hedges, Tipton, & Johnson, 2010). We used τ2 and I2 to examine heterogeneity across effect sizes (Borenstein et al., 2009).
Moderator analyses
We conducted moderator analyses using meta-analyses for each moderator and meta-regression. For example, we completed a meta-analysis of studies conducted before NCLB implementation and a separate meta-analysis of studies conducted after NCLB. This approach resulted in two effect sizes that described the magnitude of the achievement gap for the moderator category and statistically tested if each of the gaps was reliably different from zero. Then, we conducted a meta-regression with each moderator category as the predictor variable to obtain a statistical test of the moderation. For example, the meta-regression tested if there was a statistically significant difference between the “before NCLB” estimate and “after NCLB” estimate of the achievement gap. We evaluated the correlations between moderators before conducting the meta-regressions to identify potential confounds (Lipsey, 2003). We used the study means for each moderator to estimate between study effects of the moderators (Tanner-Smith & Tipton, 2014).
Sensitivity analyses
We conducted sensitivity analyses by reestimating the original meta-analysis, the model excluding moderators, four times. We excluded studies with (a) outlying effect sizes reflecting achievement gaps greater than two standard deviations from the overall mean, (b) estimated variables (e.g., if numbers used to calculate effect sizes were obtained from box plots), (c) regression-adjusted results (e.g., the achievement gap estimate from a study was calculated from a regression coefficient and the model included control variables), and (d) combined effect sizes (e.g., when we combined study results from average-, high-, and low-achieving students from the same disability group). We compared the mean effect sizes across the models that excluded studies with different characteristics.
We conducted additional sensitivity analyses using different values of the correlation between dependent effect sizes (rho). Rho is required for RVE, but it is not typically reported in studies. We ran each model with values of rho ranging from 0.10 to 0.90 with intervals of 0.10. Finally, we conducted an Eggers test (Borenstein et al., 2009) with RVE to test for small study effects. This test examined the dependency between standard errors and effect sizes. A statistically significant association suggests publication bias such that small studies or studies without statistically significant results were less likely to be published and identifiable for inclusion in the present study.
Results
Characteristics of Studies Assessing the Reading Achievement Gap
Sample characteristics from included studies are presented in Table 1. Most studies were conducted with researcher-collected data after NCLB and included elementary and middle school students. Many studies did not provide detailed sample information. Of the 10 longitudinal studies, only three included a description of how the researchers addressed students’ disability labels over time. Morgan et al. (2011) treated disability status as time invariant. They assigned such status based on the disability label study participants were given in kindergarten. Schulte, Stevens, Elliott, Tindal, and Nese (2016) took a similar approach. Hood (2015) included students in a disability group if school records indicated that they had that specific disability for 33.3% or more of testing periods. Seven additional studies with longitudinal designs appeared to assume that disability status was static.
Summary of Sample Information From the Included Studies.
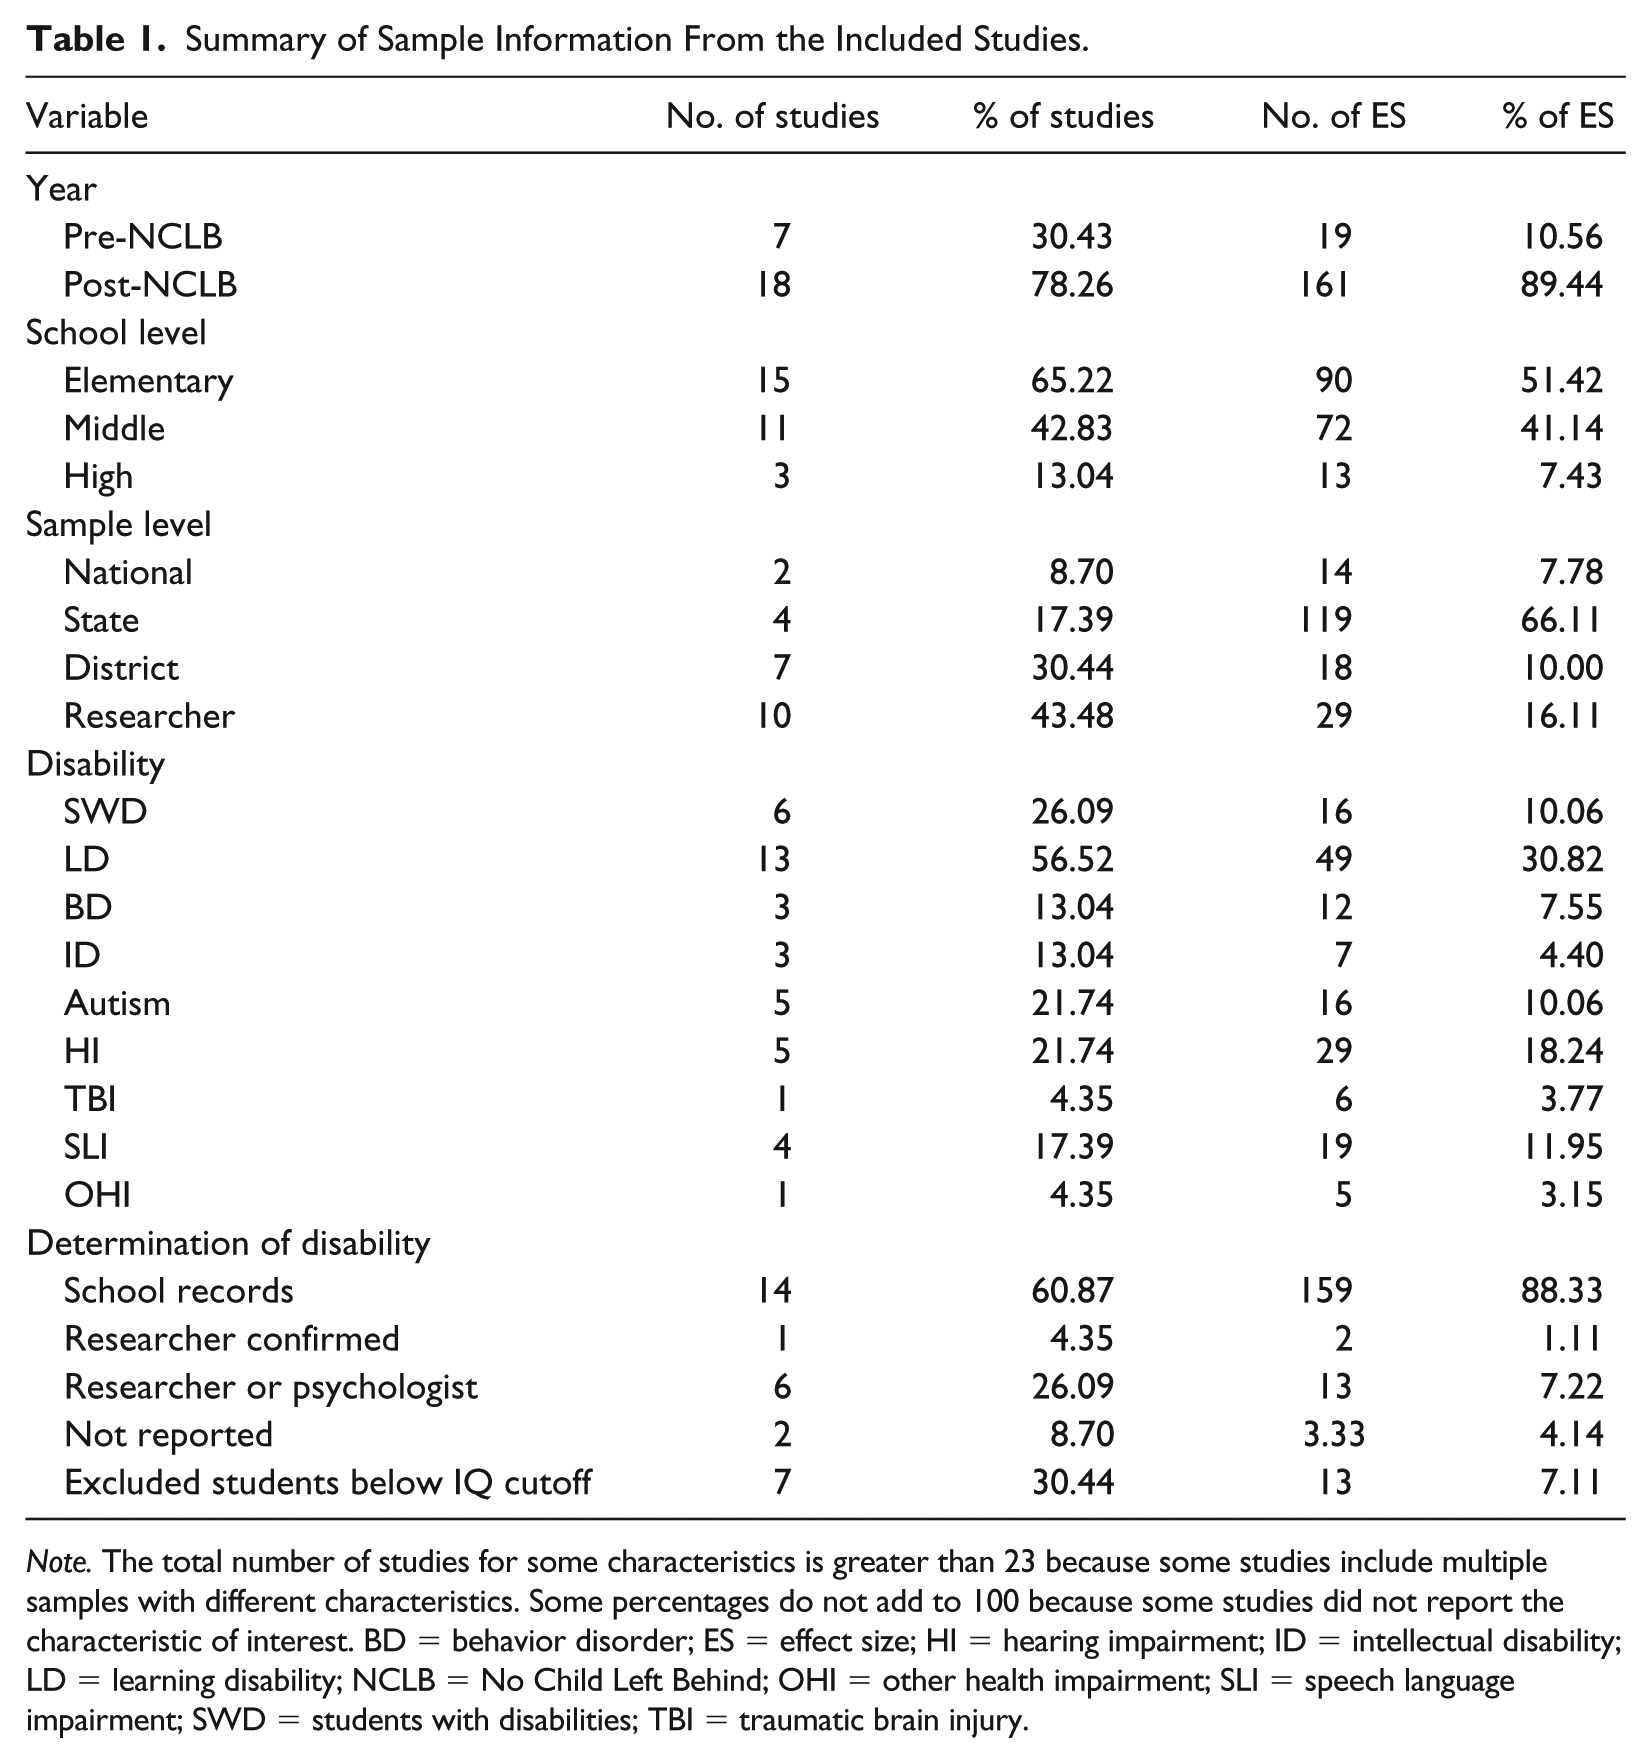
Note. The total number of studies for some characteristics is greater than 23 because some studies include multiple samples with different characteristics. Some percentages do not add to 100 because some studies did not report the characteristic of interest. BD = behavior disorder; ES = effect size; HI = hearing impairment; ID = intellectual disability; LD = learning disability; NCLB = No Child Left Behind; OHI = other health impairment; SLI = speech language impairment; SWD = students with disabilities; TBI = traumatic brain injury.
All but five teams of the researchers reported information about students excluded from the sample. Buchsbaum (2013), LeRoux (2012), and Morgan et al. (2011), for example, removed students with missing data. Other researchers excluded students who were not monolingual English speakers (Catts, Bridges, Little, & Tomblin, 2008) or SWDs with more significant impairments, many of whom were placed in more restrictive educational environments (Blackorby et al., 2010; Carlisle, 1999; Gwynne, Lesnick, Hart, & Allensworth, 2009; Hood, 2015; Klingner, Vaughn, Hughes, Schumm, & Elbaum, 1998). Schulte et al. (2016) excluded disability groups with small sample sizes (e.g., multiple disabilities) and students who had never participated in state assessments. Overall, students with significant cognitive impairments were excluded from many samples.
Characteristics of the assessments used in the included studies are provided in Table 2. Most researchers did not describe the specific reading skills addressed by the reading composite assessments. Nor did they include the amount of each reading skill covered by the assessment, such as the percentage of items related to reading comprehension or vocabulary. Reading comprehension was also assessed with different formats. In four studies, investigators used a cloze procedure (Carlisle, 1999; Cole, Waldren, & Maid, 2004; Holman, 2004; Park et al., 2013). In the remaining studies, the researchers required students to read silently or aloud and to answer multiple-choice questions. There was an absence of description of test administration procedures beyond if the test was given individually or in a group.
Summary of Assessment Information From the Included Studies.

Note. We examined retests only when the researchers used a high-stakes assessment. The number of studies total for some characteristics is greater than 23 because some studies include multiple samples with different characteristics. ES = effect size.
Some states and districts allowed students to take a high-stakes assessment multiple times if they did not obtain a passing score (i.e., retests; Domaleski, 2011). Most studies that included results from high-stakes assessments did not address the use of retests. Hood (2015) and LeRoux (2012) reported that students could retest up to three times and that the students’ best scores were used in their analyses. We also examined the use of test accommodations. None of the authors of studies that included researcher-administered assessments stated that accommodations were not permitted. This could be due to the assumption that norm-referenced assessments were delivered under the standardized procedures without accommodations. The researchers that included test accommodation information reported that accommodations were determined based on the student’s IEP, but often the studies did not describe the specific accommodations provided.
Size of the Reading Achievement Gap
The average reading achievement gap between students with and without disabilities was 1.17 standard deviations, with SWDs performing poorer than their nondisabled peers. The large τ2 (.39) and I2 (98.72) suggested heterogeneity in effect sizes across studies. Because the majority of the effect sizes in the analyses were from samples of elementary school students, we converted the reading gap from standard deviations to years of academic growth using the average annual gains in reading from third to fourth grade (0.36 standard deviations) reported in Hill, Bloom, Black, and Lipsey (2008). The average reading gap between students with and without disabilities was equivalent to 3.3 years of reading growth.
The average reading achievement gap between students with and without disabilities was 1.17 standard deviations, with SWDs performing poorer than their nondisabled peers.
Moderators of the Gap
Correlations between moderators were small to moderate and not statistically significant, ruling out the likelihood of confounds (Lipsey, 2003). We conducted meta-analyses for each moderator variable and then conducted statistical tests using meta-regression. We did not conduct meta-regression when there were not enough samples of the moderator category to obtain a stable estimate (Tipton, 2015). For each moderator, we first presented the estimates of the reading gap by moderator category (results of the meta-analyses) followed by the statistical test of differences for the moderators (results of the meta-regression).
Disability
We were unable to conduct meta-analyses for each disability category because of the small number of samples for most categories. For example, only one study included students with traumatic brain injuries. We grouped disabilities into four categories: high incidence, low incidence, communication disorders, and SWDs as a combined group. The high-incidence group included students with LD, behavior disorders, or other health impairments. The low-incidence group included students with autism, intellectual disabilities, and traumatic brain injury. We grouped students with hearing impairments or SLI into a third category, communication disorders, to improve statistical power and because identification of either of these disabilities is not related to cognitive functioning. We conducted a separate meta-analysis for LD because this disability category had enough samples to obtain stable estimates. We report descriptive weighted effect sizes by disability in the far right column of Table 3.
Results From Separate Meta-Analyses and Weighted Mean Effect Sizes.

Note. In models with less than 4 degrees of freedom, the parameter estimates are unstable. We do not report the results from these models. BD = behavior disorder; CD = communication disorders; CI = confidence interval; ES = effect size; Est. = effect size estimate; HI = hearing impairment; HS = high school; ID = intellectual disability; k = number of studies used in the analysis; LD = learning disability; MS = middle school; NCLB = No Child Left Behind; OHI = other health impairment; SLI = speech language impairment; SWD = students with disabilities; TBI = traumatic brain injury. Effect sizes are negative to reflect that SWDs are scoring below their peers without disabilities.
p < .05. **p < .01.
Our meta-analysis revealed that students with LD, on average, performed 1.44 standard deviations, or about 4 years, below students without disabilities in reading (left side of Table 3). This gap decreased when students with LD were grouped with students with behavior disorders into a high-incidence category. The average reading gap between students with low-incidence disabilities and students without disabilities was about 4.3 years. The average gap appeared smallest, 0.62 standard deviations, or about 1.7 years of growth, when SWDs were grouped together. As shown in Table 4, the meta-regression suggests that the only statistically significant difference in gap size between disability groups was between samples of students with high-incidence disabilities and SWDs grouped together.
Results From Meta-Regressions.
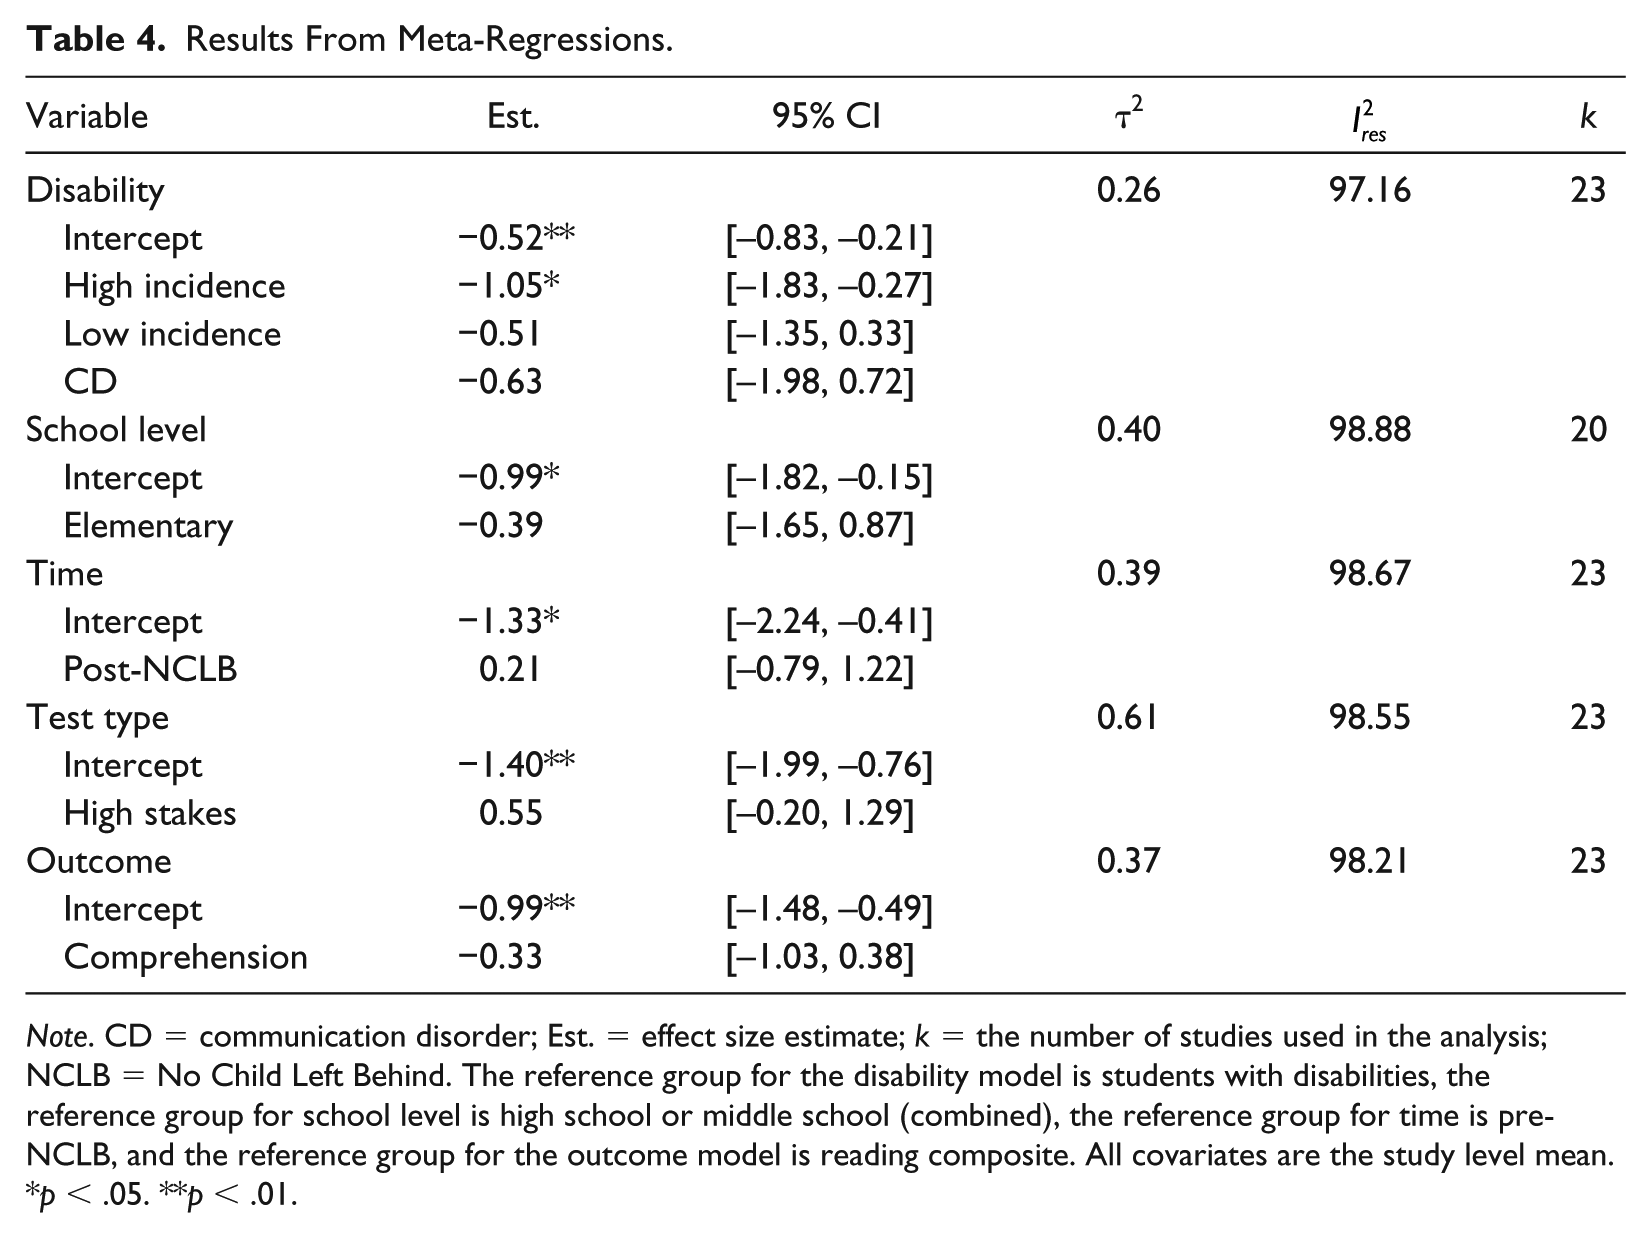
Note. CD = communication disorder; Est. = effect size estimate; k = the number of studies used in the analysis; NCLB = No Child Left Behind. The reference group for the disability model is students with disabilities, the reference group for school level is high school or middle school (combined), the reference group for time is pre-NCLB, and the reference group for the outcome model is reading composite. All covariates are the study level mean.
p < .05. **p < .01.
School level
We grouped studies that included samples of high school and middle school students together due to the small number of samples with high school students. As shown in Table 3, the average reading gap between elementary school SWDs and students without disabilities was about 3.1 years. This was larger than the gap between secondary school students and their peers, but this difference was not statistically significant (Table 4).
Before and after NCLB, assessment type, and outcome type
The average reading gaps calculated from samples constituted before and after NCLB were similar in magnitude (Table 3), and we did not identify a statistically significant difference between them (Table 4). The magnitude of the gap was smaller (0.85 standard deviations) when studies used included high-stakes assessments than when the studies used low-stakes assessments (1.40 standard deviations), but this difference was not statistically significant (p = .13). The average reading gap for studies that included a reading comprehension outcome was 1.41 standard deviations, and the average gap for studies with a reading composite outcome was 1.11 standard deviations, with SWDs scoring below their peers without disabilities. This difference by outcome was not statistically significant.
Sensitivity Analyses and Test for Publication Bias
We completed sensitivity analyses by reestimating the achievement gap after excluding studies with specific characteristics. The resulting gap estimates from these models were all statistically significant and ranged from 1.20 to 1.04 standard deviations, with SWDs scoring below their peers; all contained the overall estimate of the achievement gap from all studies, 1.17 standard deviations, within their 95% confidence intervals. The average gap did not differ based on values of rho in our RVE analyses. We conducted an Egger test using RVE and found no evidence of small-study effects (p = .10; CI = [–10.81, 1.35]). Our results do not appear to change based on the inclusion or exclusion of studies with specific characteristics and are unlikely inflated due to publication bias.
Discussion
A succession of accountability polices have shifted the conception and operationalization of “access” from the physical location of SWDs in schools to their academic outcomes. Our meta-analytic findings show a 1.17-standard-deviation reading gap between SWDs and their nondisabled peers, or about 3 years of reading growth. Such a gap raises concerns about the access that SWDs have to the general curriculum. The magnitude of this gap is particularly concerning given evidence from the most recent National Assessment of Educational Progress (2017) that 60% of fourth- and eighth-grade students without disabilities are performing below grade level in reading. In other words, students without disabilities are reading at unacceptable levels, and SWDs are reading worse. Moreover, our estimate is likely conservative because many of the studies included in our analyses excluded students with more significant cognitive impairments. The average achievement gap we identified should alarm parents, educators, policy makers, and others with interest in the academic outcomes of SWDs.
students without disabilities are reading at unacceptable levels, and SWDs are reading worse.
The estimates of the achievement gap we calculated from individual studies ranged from 10.88 standard deviations to 0.08 standard deviations, with SWDs scoring below their peers, suggesting that gap estimates are sensitive to student samples and measurement approaches. We found that the achievement gap varied across disability categories and appeared smallest when SWDs were grouped into a single category. Our estimate did not vary as a function of school level, reading constructs addressed by assessments, or whether samples were constituted prior to or following implementation of NCLB. Considerable heterogeneity across effect sizes remained after we included the moderator variables, further supporting the importance of meta-analysis to combine estimates to obtain an accurate understanding of the achievement gap.
Findings from this meta-analysis raise more questions than they answer regarding the differential performances of SWDs and their peers. After discussing limitations of our investigation, we focus on two such questions, the first of which is why the achievement gap is so large; the second is whether closing it is realistic.
Limitations
There are several limitations associated with our study. We investigated cross-sectional achievement gaps instead of longitudinal gaps following cohorts of students. Few samples included students with low-incidence disabilities, likely reflecting the small number of students in these categories. Additionally, many students with low-incidence disabilities take alternative assessments. It would be inappropriate to compare scores from these alternative assessments to scores from a regular assessment. We grouped students with autism, traumatic brain injuries, and intellectual disabilities together, despite that some students with autism had been described as “high functioning.” This grouping could have resulted in an underestimation of the achievement gap for low-incidence disabilities.
Why Is the Achievement Gap So Large?
Our results describe the size of the achievement gap but do not identify its causes. We hypothesize, nevertheless, that the magnitude of the gap is likely due to two access-related issues: First, how should we think about the least restrictive environment (LRE)? Second, how appropriate is the instruction that SWDs typically receive?
LRE
As defined in IDEA, the LRE is the regular education classroom unless the student’s needs cannot be met there despite the use of supplemental aids and services (§ 300.114). But recent federal guidance expresses the need for SWDs to have access to the general education curriculum and make progress in the general education curriculum (Yudin & Musgrove, 2015). For some students, progress in the general education curriculum may conflict with the interpretation of the LRE as the general education classroom with accommodations (D. Fuchs & Fuchs, 1994; D. Fuchs, Fuchs, & Compton, 2012; L. Fuchs et al., 2015). That is, some SWDs may require instruction beyond the general classroom for a portion of the school day to access the general education curriculum.
The belief that some SWDs will need intensive services that cannot be delivered through modifications or accommodations in the general education classroom is supported by empirical evidence. For example, L. Fuchs et al. (2015) compared the achievement gaps in fractions performance between two very-low-performing groups of students and their peers without disabilities. The first low-performing group received intensive fractions intervention, whereas the second low-performing group received fractions instruction in general education classrooms with accommodations based on the principles of Universal Design for Learning. The average gap in performance between the low-performing students in the general classroom and their peers was, in the final year of the study, more than twice as large as the gap between the low-performing students participating in intensive intervention and their peers. Accommodations are likely not enough to improve the academic outcomes of SWDs. Equating setting with access implies that exposure to content leads to improvement for all SWDs. Instead, how and where SWDs are educated needs to be determined by students’ individual needs for accessing the curriculum.
Equating setting with access implies that exposure to content leads to improvement for all SWDs.
Instruction
Even when SWDs are provided with supplemental services and instruction, reading instruction for SWDs may not include the instructional practices that researchers have identified as effective for improving SWDs’ reading abilities (Lindström, 2018; McKenna, Shin, & Ciullo, 2015; Swanson, 2008). For example, Lindström (2018) reports in her recent review of observational research regarding reading instruction for students with or at risk for disabilities that effective instructional strategies are rarely used, teachers spend less time on literacy instruction than other classroom activities, and instruction often does not address foundational reading skills. SWDs’ access to the curriculum is unlikely to change if teachers do not know how to improve SWDs’ outcomes or choose not to use evidence-based practices.
Is Closing the Achievement Gap Realistic?
Research supports that many SWDs can make large gains when they are provided intensive, individualized instruction (D. Fuchs et al., 2012). However, even with the best instruction, SWDs may lag behind their peers. For example, in L. Fuchs et al. (2015), the achievement gaps between very-low-performing students and their peers decreased upon receipt of the intervention, but large achievement gaps of 1.03 standard deviations still remained. Other studies of intensive and individualized reading interventions report notable effect sizes that are still only a fraction of the achievement gap between SWDs and their peers. For example, Denton and her colleagues (2013) reported an effect size of 0.34 favoring students with very low reading skills who were randomly assigned to an individualized reading intervention compared to students receiving standard-protocol Tier 2 intervention. This moderate effect size is only a third of the achievement gap between SWDs and their nondisabled peers. Current reading interventions for SWDs may not be sufficiently strong to close achievement gaps.
Further, the reading achievement gap we identified did not change as students progressed from elementary school to middle and high school, in contrast to our hypothesis. A widening achievement gap could be masked if SWDs who were further behind academically dropped out of school more often than their peers. However, it is unlikely that many students dropped out of middle school, and only three studies included samples of high school students. More likely, the persistence of the gap reflects the continuous needs of SWDs to receive access to individualized instruction, especially in light of the growing complexity of content as students progress in school. Policy makers and researchers must struggle with the likelihood that closing achievement gaps may not be possible given that SWDs are identified for special education services precisely because of their severe and continuous learning needs. Using gaps as a measure of access may create an impossible goal. However, the magnitude of this gap should not simply be accepted because the students have disabilities.
How Can Policy Improve Outcomes for SWDs?
Accountability policies that are focused on reporting achievement gaps are unlikely by themselves to sufficiently strengthen academic outcomes of SWDs and improve their access to the general education curriculum. But the retreat from these policies is also unlikely, as shown by the requirements described in ESSA. At minimum, states could improve the usefulness of the results they publish. Consolidated State Performance Reports, for example, should include average scores, standard deviations, and the sample sizes of students with and without disabilities. Such information would facilitate the calculation of achievement gaps, rather than proficiency gaps, between SWDs and their peers. In a similar vein, states should report students’ scores from the first of multiple test administrations when retests are allowed, and they should clarify which accommodations were allowed. Moreover, they should consider disaggregating average scores, standard deviations, and sample sizes by disability category.
We believe policy makers must use other levers to address the unacceptably poor academic outcomes of many SWDs. Federal and state governments have implemented large programs and policies in general and special education with the goal of improving students’ reading skills, and they have funded billions of dollars of research on effective reading interventions. Despite these efforts to improve SWDs’ reading outcomes, very large gaps remain. The Institute of Education Sciences might direct research monies toward the study of school adoption and implementation of evidence-based practices. Such research might include evaluating service delivery models that improve student outcomes and explore the barriers to implementation, such as the recruitment, training, and retention of high-quality special educators. A focus on identifying effective interventions or strengthening interventions is insufficient if not paired with research on the use of these effective practices at scale and on identifying the necessary structures and supports for sustained implementation of evidence-based practices for SWDs in schools.
The goal of access to the general education curriculum for SWDs is commendable, but this access will be achieved only when special education is actually special, that is, individualized and intensive for the many who require it. The large achievement gap between SWDs and their nondisabled peers suggests that SWDs still have limited access to the instruction that they need to succeed in school.
Supplemental Material
EC_795830_Online_Appendix_A_and_B – Supplemental material for Are Students With Disabilities Accessing the Curriculum? A Meta-Analysis of the Reading Achievement Gap Between Students With and Without Disabilities
Supplemental material, EC_795830_Online_Appendix_A_and_B for Are Students With Disabilities Accessing the Curriculum? A Meta-Analysis of the Reading Achievement Gap Between Students With and Without Disabilities by Allison F. Gilmour, Douglas Fuchs and Joseph H. Wehby in Exceptional Children
Footnotes
Authors’ Note
The first author was supported by a grant from the Office of Special Education Programs (H325D120091) to Vanderbilt University. We would like to thank Johny Daniels, Mary Shipley, and Alyssa Van Camp for their assistance with identifying and coding studies.
References
Supplementary Material
Please find the following supplemental material available below.
For Open Access articles published under a Creative Commons License, all supplemental material carries the same license as the article it is associated with.
For non-Open Access articles published, all supplemental material carries a non-exclusive license, and permission requests for re-use of supplemental material or any part of supplemental material shall be sent directly to the copyright owner as specified in the copyright notice associated with the article.