
Abstract
It is important to understand how longitudinal patterns of special education placement differ from cross-sectional incidence estimates in order to improve measurement precision and better target assistance to students with disabilities. This study used latent class growth analysis in a national-level data set to classify four trajectories of special education service receipt from kindergarten to eighth grade (Never, Persistent, Delayed, and Discontinued) and to predict which kindergarteners follow these trajectories of service receipt (N = 3,970). This study is among the first to identify which kindergarteners with disabilities may experience persistent special education services, which may exit special education, and what patterns of sociodemographic, achievement, and behavior covariates distinguish these groups. Results both align with prior work and offer a fresh perspective for researchers and policymakers as to how placement changes across schooling and for whom.
Accurately determining when and which students with disabilities (SWD) need special education services is an important and enduring educational goal. Not only are special education services costly to implement (Dhuey & Lipscomb, 2013; Hanushek et al., 2002), but there is a well-documented achievement gap between students with and without disabilities (Nese et al., 2017; Schulte & Stevens, 2015; Ysseldyke & Bielinski, 2002). This has led some to theorize that special education services are stigmatizing or ineffective, and particularly for students of color (Burns & Ysseldyke, 2009; Shifrer, 2013). Yet, research has also demonstrated that the size of this achievement gap may depend on the timing at which disability status is measured—whether as a discrete, time-invariant event (“ever” disabled) or whether students are persistently reported to have a disability (“always” disabled; Nese et al., 2017; Schulte & Stevens, 2015; Ysseldyke & Bielinski, 2002). This research implies that it may be inappropriate to draw longitudinal conclusions from a measure of special education obtained from only one time point, as some SWD may discontinue services and display better long-term outcomes than others who continue to receive services. Knowing who will continue to receive special education services over time may also allow for more reliable targeting of assistance to the neediest SWD, which is of importance to both scientists and policymakers alike.
Identification, Discontinuation, and Reclassification Within Special Education
The present study was prompted by calls to improve methods of grouping SWD in compliance with national education policy. These improved methods might better assess outcomes like academic achievement (Chudowsky et al., 2009; Schulte & Stevens, 2015; Ysseldyke & Bielinski, 2002) and differentiate the risk factors associated with early, delayed, or continued service receipt. For instance, high-incidence disabilities (e.g., learning disabilities) can be more often identified with implicit bias than low-incidence disabilities (e.g., more severe or more often medically diagnosed disabilities, like vision or hearing impairments; Harry & Anderson, 1994; Hibel et al., 2010; Parrish, 2002; Skiba et al., 2008). Students with low-incidence disabilities may be identified earlier and have services put in place during or prior to their transition to schooling. Students with high-incidence disabilities may have needs that take longer to manifest within school settings given increasingly difficult content (Francis et al., 1996; Losen & Orfield, 2002) and because teachers often rely on comparisons with peers to identify atypical development or learning (Peterson et al., 2011). Special education services might therefore be delayed for students with high- relative to low-incidence disabilities.
Improved measurement of special education delivery patterns would also take into account the contextual factors influencing identification and continuation of services. Otherwise similar SWD may be more or less likely to receive special education services depending on their school context (e.g., Hibel et al., 2010). Black and Hispanic students may be more likely to receive special education services in schools composed of mostly White students but substantially less likely in schools with larger shares of non-White students (Elder et al., 2019; Fish, 2019; Hibel et al., 2010). Students of color may also be more likely to receive special education services specifically for more stigmatized disabilities (i.e., intellectual disability) in schools composed of mostly White students (Fish, 2019). In contrast, White students may be more likely to receive special education services for less stigmatized disabilities (i.e., speech and language disorder) in schools composed of mostly non-White students (Fish, 2019). Some SWD are more likely to receive special education services in schools with lower grade retention rates (Sullivan & Bal, 2013) and better overall self-regulatory behavior and academic achievement (Hibel et al., 2010).
Moreover, early-identified students may either discontinue special education or have their primary Individuals With Disabilities Education Act (IDEA; 2006) category reclassified. For example, students receiving speech and language impairment (SLI) services who need continued support are commonly reclassified to the learning disabilities category (Marder, 2009; Wolman et al., 1989). However, those tracking students with SLI may erroneously label them as having discontinued services. This is important because estimates vary regarding the number of students who exit special education. Studies have estimated that anywhere from 7% to 22% of students have discontinued special education services, and 4% to 24% continued to receive services but changed their primary disability classification (Carlson et al., 2008; Carlson & Parshall, 1996; Halgren & Clarizio, 1993; Marder, 2009; Nese et al., 2017; D. Walker et al., 1988; Ysseldyke & Bielinski, 2002). Entrance rates to special education may peak prior to fourth grade, and exit rates peak between Grades 4 and 6 (Nese et al., 2017). The wide range in estimated prevalence of students who exit out of special education may exist because few studies utilized a nationally representative sample (Carlson et al., 2008; Marder, 2009), with most using state (Carlson & Parshall, 1996; Nese et al., 2017; Ysseldyke & Bielinski, 2002) or community samples (Halgren & Clarizio, 1993; D. Walker et al., 1988).
Measuring Patterns in Special Education Service Receipt
Motivation for the present study aligns methodologically with recent work by Michelmore and Dynarski (2016), who investigated the longitudinal patterning of subsidized school meal eligibility as a proxy for economic disadvantage. They found that students with the largest academic deficits by the end of eighth grade were those who were persistently economically disadvantaged, as opposed to those who were intermittently or temporarily disadvantaged. The authors concluded that utilizing a longitudinal measure of chronic eligibility for subsidized meals would lead to more accurately targeted assistance and would better identify at-risk students who might most benefit from intervention.
A longitudinal measure of chronic eligibility would lead to more accurately targeted assistance and would better identify at-risk students who might most benefit from intervention.
Disability status may be similar methodologically because it can change on an annual basis. This has implications for researchers studying both who is placed in special education and the consequences of special education service receipt. For instance, estimates of the achievement gap relative to nondisabled peers depend on the age when special education status is determined (Schulte & Stevens, 2015; Ysseldyke & Bielinski, 2002). SWD may experience either persistent or intermittent receipt of special education services, which also alters conclusions regarding the size of the achievement gap between students with and without disabilities. The achievement gap appears largest between students without disabilities and students who “always” receive special education services and smaller relative to students who “ever” received special education services (e.g., Nese et al., 2017; Schulte & Stevens, 2015; Ysseldyke & Bielinski, 2002). Yet, the extent to which we can predict student-level patterns of entrance to and exit from special education has been underinvestigated, and particularly using national-level data. Better understanding this question may aid in differentiating those SWD who are at risk for receiving persistent special education services as opposed to discontinuing services. This precision could allow educators to target limited resources to the neediest students.
The Importance of National Data
The difference between longitudinal prevalence and current incidence of special education service receipt is an important yet relatively underinvestigated distinction (Forness et al., 2012). Considering how longitudinal prevalence differs from current incidence of special education service receipt is an important consideration given evidence that the academic and social effects of special education might depend on when services are delivered (e.g., see Chesmore et al., 2016; Ehrhardt et al., 2013; Hanushek et al., 2002). Whether we can predict which students will exit special education as opposed to switching disability classifications and continuing service receipt is also empirically uncertain. Unfortunately, few national-level studies directly address special education entrance and exit patterns (i.e., At what points do certain students enter and exit special education? For how long do they receive services?).
It is vital for researchers to first understand patterns in entrance to and exit from special education (hereafter referred to as trajectories) in order to understand differences among these groups. This knowledge might then inform policy targeting students who may require special education services for a longer duration. Earlier services might then be more optimally provided according to the students’ long-term needs (Gresham, 2007). Early intervention provides the best opportunities for later success. Kulkarni and Sullivan (2019) write, “If behaviors that place children at-risk for later special needs can be reliably identified at school entry, there is potential to intervene early to reduce severity, chronicity, and conceivably even emergence of the need for special education” (pp. 810). Ramey and Ramey (2004) write, “Waiting until these children ‘fail’ in school and then providing remedial, pull-out, or compensatory programs . . . typically does not sufficiently help these children to catch up and then achieve at grade level” (pp. 472–473). In this vein, the present study attempted to determine whether and to what extent various student- and school-level factors can help determine, as early as possible, which students will receive special education services and for how long.
Research Questions
Do SWD follow different latent trajectories of special education service receipt through eighth grade?
What kindergarten sociodemographic, academic, and behavioral factors suggest not only an increased risk of special education placement but for a longer duration?
Method
Analyses were conducted using restricted data from the Early Childhood Longitudinal Study, Kindergarten Class of 1998–1999 (ECLS-K:1998). This study sampled a nationally representative cohort of 21,400 students for 8 years, collecting information about schooling experiences in kindergarten and first, third, fifth, and eighth grades. The longitudinal and comprehensive nature of this data set lends itself to studying a wide range of factors associated with schooling outcomes, including special education.
Although an older data set, these analyses were ideally situated to the ECLS-K:1998 for several reasons. First, unlike other large and nationally representative data sets, the ECLS-K:1998 follows students across five waves of data collection. This is in contrast to other longitudinal and nationally representative data sets, such as the Special Education Elementary Longitudinal Study (SEELS; 2005), which had only three waves of data collection, or the National Assessment of Educational Progress, which is cross-sectional. Second, it includes a rich set of individual-level measures (e.g., characteristics in the home environment that are related to educational outcomes, teacher-reported student behaviors) that are usually unavailable in administrative data. Third, at present, the ECLS-K:1998 is among the only data sets with this kind of rich information beginning as children transition to school and following them through middle school (eighth grade). The SEELS data set followed children with disabilities only through early elementary school. The newest ECLS-K (2010–2011 cohort) followed students only through fifth grade. Representing less than half of formal schooling in the United States, it may not capture enough variation in the timing at which SWD start or discontinue service receipt.
A link to the analytic code is available with the supplementary material that is available online. There were 9,730 students who participated in all five spring sampling waves of the ECLS-K:1998. Analyses were performed on a subsample of students with complete data on special education status during all five waves (n = 3,970 attending 600 schools). Differences between the ECLS-K:1998 sample of students who participated in the study at all five waves and the analytic subsample of students with complete special education status data are provided in the supplementary online material and summarized here. Per stipulations required by the Institute of Education Sciences when using restricted data, all reported sample and group sizes are rounded to the nearest 10. This study was exempted from institutional review by a university ethics committee because the data were deidentified prior to author receipt and analyses.
Variables
This study assessed group differences between trajectories and demographic, achievement, and behavioral predictors commonly used in prior work assessing special education placement (e.g., Hibel et al., 2010; Sullivan & Bal, 2013). Specific coding schemes and missing data proportions for each variable are available in the online supplementary material.
Special education services
During each wave of data collection, school office staff were asked to indicate whether each student had an Individualized Education Program (IEP) on file. This resulted in binary indicators corresponding to general or special education status at kindergarten and first, third, fifth, and eighth grades, which were then used as the variables of interest to assess latent trajectories of special education receipt.
Demographic covariates
Analyses included child, family, and school characteristics used in prior research and considered “best-evidence” predictors of the likelihood of special education placement. Each predictor was measured at kindergarten. Information about the child’s home and family was provided by parents, and information about the child’s school was provided by the principal unless otherwise specified. Covariates included male sex (50% of the sample); whether non-English was the primary home language (7.3%); whether the child was born weighing less than 6 pounds (8.9%); whether the child did not have health insurance coverage (7.4%); whether the family was at or below the federal poverty line (14.2%); whether the child’s mother was single, separated, divorced, or widowed (22.0%); whether the school was in an urban area (80.4%); whether the school was private (13.5%), whether the school had enrolled more than 500 students (44.5%); whether the composition of non-White students was 50% or more of the student body (24.1%); and whether the school received schoolwide Title I Funding (62.6%). Categorical variables included race-ethnicity, with 1 = non-Hispanic White (referent category; 71.1%), 2 = non-Hispanic Black (10.9%), 3 = Hispanic (12.4%), and 4 = another race-ethnicity (5.8%); mother’s highest education level, with 1 = high school or less (41.5%), 2 = some college (32.6%), and 3 = bachelor’s degree or higher (25.9%); child’s age at kindergarten entry, ranging from 38 to 83 months (sample M = 65.98); the average socioeconomic status (SES) of students attending the child’s school, created by aggregating the ECLS-K-provided standardized SES measure across schools (ranged from −1.5 to 1.7, M = 0.05); and the average number of SWD per classroom in the child’s school, as reported by classroom teachers and aggregated across the school (ranged from 0 to 15.2, M = 2.10).
Aspects of the home environment that might influence cognitive development were captured with three variables constructed from parent-reported items. First, 11 binary indicators of whether the child took dance, music, or art lessons; participated in athletic events, organized performances, or organized clubs; read a book outside of school; and visited the library, a museum, a zoo, or an aquarium were summed into one composite variable and standardized to have a mean of 0 and standard deviation of 1. This variable was called “cognitive stimulation” (M = −.06). Next, how safe it was to play outside was included as a binary variable, with 0 = not at all safe or somewhat safe and 1 = very safe (74.6%). Last, given theory regarding the importance of a nonchaotic home (i.e., one that includes stable family routines and structure; see Johnson et al., 2008) a dichotomous variable asking whether the child went to bed at the same time each night was added to a standardized composite of four variables assessing the number of days per week breakfast or dinner was consumed as a family and how many days per week these meals occurred at regular times. This new variable, referred to as “family routines,” was then standardized (M = −.09).
Academic achievement and behavioral ratings
Poor academic achievement, including in both reading and math, is one of the strongest predictors of special education placement (Briesch et al., 2012; Morgan et al., 2017). Academic assessments created specifically for the ECLS-K:1998 used item response theory (IRT), which adjusts scores for each child based on the number of correct, incorrect, and omitted answers in relation to item difficulty. This method also allows scores obtained at each time point to be directly comparable with one another across waves, thus permitting longitudinal analyses. IRT-adjusted scores assessing reading (range: 11.6–70.8, M = 33.37, α = .93) and mathematics ability (range: 7.7–59.2, M = 29.17, α = .92) in the spring of kindergarten were included in these models. Individual scores for both reading and mathematics were also aggregated across children within schools to create measures for average schoolwide reading (range: 12.3–63.7, M = 32.35) and mathematics (range: 7.7–49.4, M = 28.24).
Behavioral problems, such as self-regulatory, internalizing, or externalizing disorders, also have a demonstrable effect on special education referrals and placements (Briesch et al., 2012; Forness et al., 2012). Four kindergarten teacher-reported ratings of behavioral capabilities from the Teacher Social Rating Scale (adapted from the Social Skills Rating Scale; Gresham and Elliott, 1990) were included in analyses. Each scale captured the frequency of observed behaviors and ranged from a low of 1 to a high of 4. The Approaches to Learning scale (sample M = 3.20, α = .89) measures how children engage with the learning environment by rating their attentiveness, task persistence, eagerness to learn, independence, flexibility, and organization. The Interpersonal Skills scale (M = 3.20, α = .89) rates the child’s ability to form and maintain relationships; get along with others; comfort or help others; positively express feelings, ideas, and opinions; and show sensitivity to others’ feelings. The Internalizing Problem Behaviors scale (M = 3.46, α = .80) rated apparent anxiety, loneliness, low self-esteem, and sadness. The Externalizing Problem Behaviors scale (M = 3.33, α = .90) measured how often the child argues, fights, gets angry, acts impulsively, and disturbs ongoing activities (both scales were reversed for consistency within analyses). Individual scores on the Approaches to Learning and Externalizing Problem Behaviors scales were also aggregated across children within each school to create variables measuring schools with high positive learning behaviors (M = 3.13) and high levels of externalizing problems (M = 1.65).
Missing Data
Though five predictor variables were missing no data (male sex, urban area, private school, school size, and average schoolwide mathematics score), most variables did have some missingness, ranging from 0.1% to 12.6% (M = 2.3%). To account for this missingness, 40 data sets were multiply imputed. Additional detail about the imputation process and proportions of missing observations are available in the supplementary material.
Normality and Weighting
Stata’s collin program (available at https://stats.idre.ucla.edu/stata/ado/analysis/) revealed no issues with multicollinearity (e.g., the maximum variance inflation factor was 3.07, average = 1.58). Sixteen students attended schools where the average number of SWD per classroom was 28; removal of these outliers from the analytical data set did not affect results. Analyses were weighted with a longitudinal sampling or probability weight (C1_7FC0) with the pweight command in Stata. This is both a design weight and a poststratification weight that adjusts for nonresponse over time. In other words, this weight assigns each observation the inverse of its probability of being sampled, which compensates for the complex, cluster-sampling study design and adjusts for study nonresponse following the baseline year of data collection. The analytical sample (n = 3,970) is therefore more representative of the population of students who began kindergarten in the 1998–1999 school year and continued through eighth grade (additional information about the ECLS-K sampling weights and design is provided in Tourangeau et al., 2009).
Analytic Strategy
Assessing heterogeneous populations is often an important goal in educational research. Analytic approaches should appropriately account for such heterogeneity to guard against Simpson’s paradox (Simpson, 1951), wherein statistical inferences obtained from procedures that assume homogenous populations can be misleading (Yang et al., 2005). Growth mixture modeling (GMM) clusters latent classes of individuals over time such that participants within subpopulations are grouped with those who are maximally similar to each other at each time point and have similar growth curves over time. These methods can also group participants even when the outcome variable is categorical or binary (e.g., having an IEP). However, here GMM repeatedly produced a convergence error—specifically, issues with nonreplication of starting log-likelihood values. Increasing these starting values resulted in the following error message: The standard errors of the model parameter estimates may not be trustworthy for some parameters due to a non-positive definite first-order derivative product matrix. This may be due to the starting values but may also be an indication of model nonidentification.
This error was primarily associated with large factor loadings at later time points, which has been noted to cause model convergence issues (Berlin et al., 2014).
Latent class growth analysis (LCGA), a special form of GMM that constrains groups to be homogenous within classes, was used due to these issues with nonconvergence. LCGA produces a “simpler” model in which fewer parameters are estimated, which may be preferable both when faced with nonconvergence issues in GMM and for a clearer interpretation of classes during exploratory analyses (Berlin et al., 2014). LCGA adds classes stepwise until the smallest number of latent classes that fit the data well is identified and produces individual probabilities of membership within each growth trajectory (Yang et al., 2005). Relative to GMM, the LCGA had slightly lower entropy but similar posterior probabilities and model fit. However, because the assumption of zero-variance within classes may not be tenable, future researchers should replicate these classes and directly address within-class variability. A description of the formal statistical models is available in the online supplementary materials.
The analytic strategy was to take a theory-driven approach to determining the number of classes while remaining flexible to implications of model fit that might suggest unexpected results. Model fit statistics were then used to further confirm the optimal number of classes. Following prior work, at least four latent classes were expected: Never (i.e., general education students), Persistent (i.e., students who are always in special education), Delayed (i.e., students who do not receive referrals until several years of schooling have passed, for example, for LD; Peterson et al., 2011), and Discontinued (i.e., students who exit out of special education, for example, after receiving SLI services; Marder, 2009). The latter two categories describe students who “ever” received special education services, similar to those described in Schulte and Stevens (2015).
Results
Table 1 presents fit statistics from two-, three-, four-, and five-solution LCGAs. The model with the minimum values of information criteria and high entropy values (≥.90) is considered the best-fitting model. Model fit statistics are a common method of evaluating how well LCGA describe the data and are typically evaluated through comparative goodness-of-fit likelihood ratio test (LRT) statistics (e.g., Vuong-Lo-Mendell Rubin [VLMR], Lo-Mendell-Rubin [LMR], bootstrapped LRT), entropy, and information criteria (e.g., Akaike information criterion [AIC], Bayesian information criterion [BIC], sample-adjusted BIC). Smaller values usually indicate that the model “fits” the data better. LCGA was performed with the five IEP variables present at each wave of data collection. Because introducing predictors into this initial step may affect the latent class formation, the kindergarten variables associated with each latent growth trajectory were analyzed in a second step following creation of the latent classes (Asparouhov & Muthén, 2014). This second step utilized multinomial logistic regression with maximum-likelihood estimation, a technique that compares the odds of being placed in any one of multiple groups with a base comparison group (Hosmer & Lemeshow, 1989).
Fit Statistics for Two-, Three-, Four-, and Five-Solution Latent Class Growth Analysis.
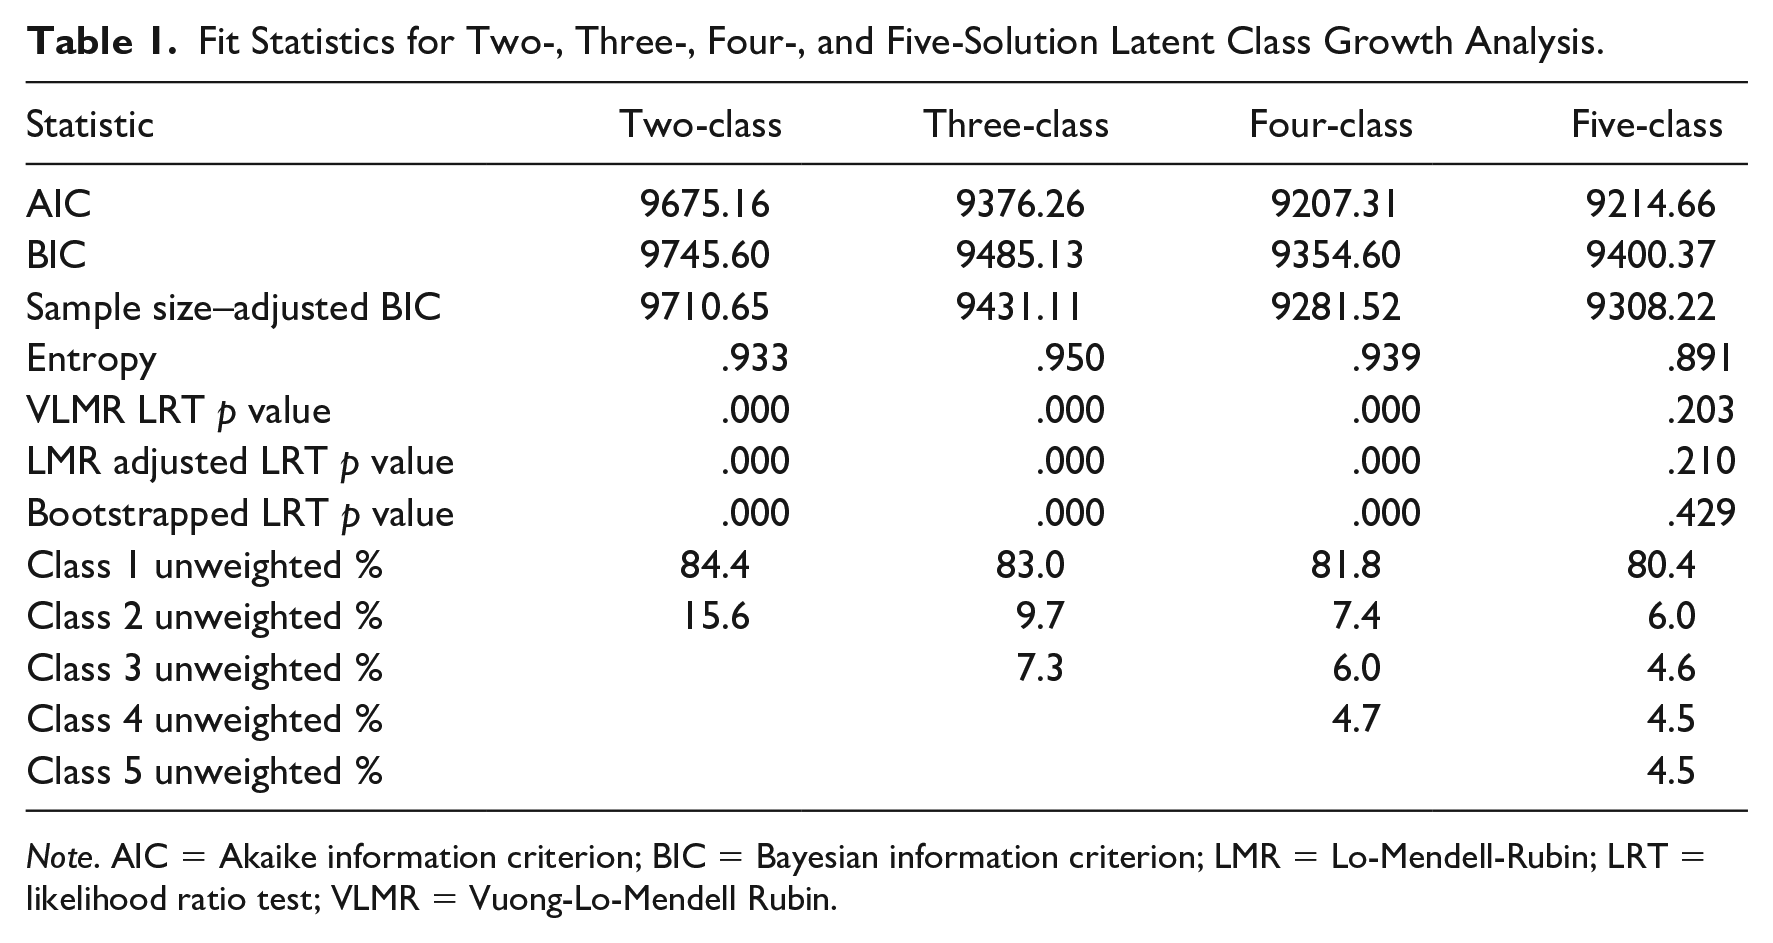
Note. AIC = Akaike information criterion; BIC = Bayesian information criterion; LMR = Lo-Mendell-Rubin; LRT = likelihood ratio test; VLMR = Vuong-Lo-Mendell Rubin.
Do Students Follow Different K–8 Paths of Special Education Service Receipt?
The first research question asked whether SWD follow different trajectories of special education service receipt throughout primary schooling. The two-class solution classified students as general education (i.e., Never) or special education (all other students who received services at some point through eighth grade). The three-class solution differentiated this latter group of students into two distinct trajectories of students who are most likely to be in special education at all time points (Persistent) and students who are most likely to receive special education in fifth grade (Delayed). The four-class solution added a group of students who were likely to receive special education services in kindergarten or first grade but who stop receiving services thereafter (Discontinued). This four-class solution fit the data better than the three-class solution, as indicated by significant VLMR and LMR LRTs and reduced information criteria. The five-class LCGA classified an additional group of students who experience both a delayed entry into special education and are likely to stop receiving services before eighth grade (labeled Brief). Between two models with the same goodness of fit, the smaller is preferred because it is more parsimonious (Yang et al., 2005). By this metric, the five-class solution did not fit the data better than a four-class solution (VLMR LRT, p = .203; LMR LRT, p = .210; bootstrapped LRT, p = .429), and the fit statistics worsened (AIC = 9214.66, BIC = 9400.37, sample-adjusted BIC = 9308.22, entropy = .891). Figure 1 displays growth curve trajectories for the four-class solution, and the longitudinal patterns within each of these four classes are presented in the online supplementary material. Because the most parsimonious model is not always the most accurate model (Sher et al., 2011), robustness analyses were conducted with the five-class solution and are available in the online supplemental material. Results from this analysis do not substantively differ from those obtained with the four-class solution. Weighted kindergarten descriptive statistics for each trajectory are presented in Table 2.
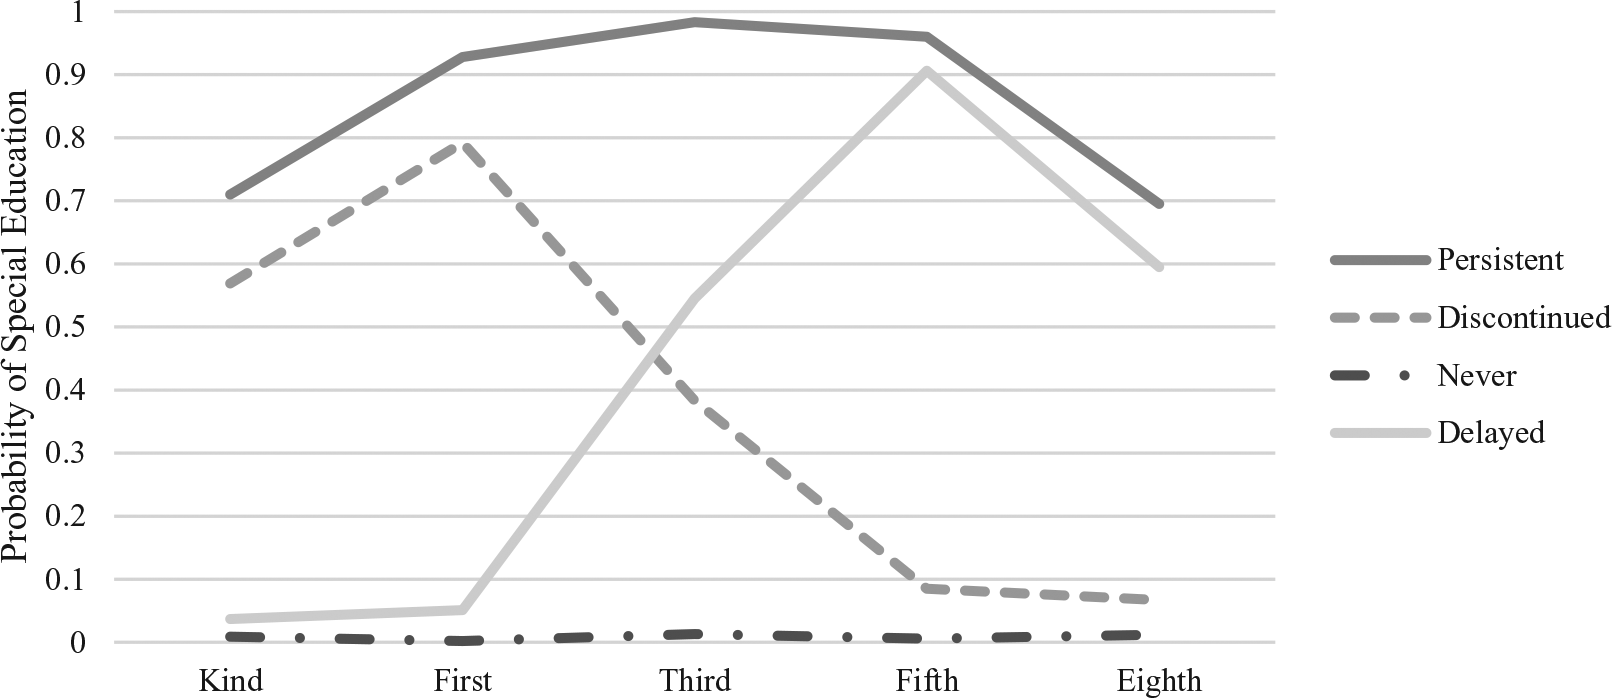
Four-solution latent class growth analyses of special education trajectories.
Weighted Imputed Kindergarten Descriptive Statistics by Latent Special Education Class.

Note. SWD = students with disabilities.
Letters indicate which columns significantly differ. eStandardized measure (M = 0, SD = 1).
p < .05. **p < .01. ***p < .001 (Scheffé correction).
Students in the three special education trajectories (Persistent, Delayed, Discontinued) had consistently and significantly lower reading and mathematics scores than students in the Never trajectory (see online supplementary material). By eighth grade, students in the Persistent category were about 1.3 standard deviations behind students who never receive services in both reading and mathematics; students in the Delayed category were about 0.9 and 0.8 standard deviations behind in reading and mathematics, respectively; and students in the Discontinued category were about 0.3 standard deviations behind in both reading and mathematics. Post hoc tests largely revealed no significant differences among the Persistent or Delayed trajectories in reading or mathematics. The Discontinued group had significantly higher reading and mathematics scores than the Persistent group but did not differ in mathematics performance from students who never received services following kindergarten.
What Individual- and School-Level Sociodemographic, Academic, and Behavioral Characteristics Uniquely Predict Special Education Trajectories?
The second research question assessed which kindergarten variables predicted the likelihood of following each trajectory over time. Identifying such patterns in trajectory membership might help illuminate systemic barriers to special education access and to streamline resources for the neediest students. Multinomial logistic regression was used to analyze which variables predicted trajectory membership while simultaneously controlling for sociodemographic, achievement, and behavioral confounds measured during the kindergarten year. Multinomial logit coefficients and confidence intervals are presented alongside relative risk ratios (RRR), which assess the risk of membership in a certain trajectory relative to a base category. Numbers greater than 1.00 correspond to increased risk relative to the referent group, numbers less than 1.00 correspond to decreased risk, and numbers equaling 1.00 indicate equal likelihoods. A standardized measure of effect size, Cohen’s d, is also presented.
Table 3 displays results relative to students who never receive services (the referent group). Students who followed each special education trajectory (Persistent, Delayed, and Discontinued) are more likely to be male (RRRs = 2.15–2.48, ds = 0.18–0.22) and less likely to attend private school (RRRs = 0.21–0.34, ds = −0.26– –0.38), though this estimate was not statistically significant for students following the Persistent trajectory. Though few covariates were statistically significant, students who followed the Persistent trajectory appeared to have more markers of socioeconomic risk than students who followed the other special education trajectories. For instance, there was a pattern for these students to speak a non-English home language (RRR = 0.48, d = −0.18, p < .10), to live in areas where it was not safe to play outdoors (RRR = 0.49, d = −0.17, p < .10), and to attend schools with poorer overall levels of self-regulation (RRR = 1.70, d = 0.13, p < .10) and externalizing problems (RRR = 0.79, d = 0.19, p < .10). Their parents were less likely to have attended some college in favor of a bachelor’s degree or higher (RRR = 0.49, d = −0.17, p < .10). The few precise (significant) estimates were small in magnitude but revealed that students in the Persistent group tended to be older at kindergarten entry (RRR = 1.10, d = .02, p < .05), have lower math scores (RRR = .86, d = −0.04, p < .001), to display fewer internalizing symptoms (RRR = 0.71, d = −0.08, p < .01), and to attend schools serving more SWD (RRR = 1.21, d = 0.05, p < .001) than their peers without disabilities.
Risk of Placement in LCGA Trajectories at Kindergarten Relative to the Never Group.
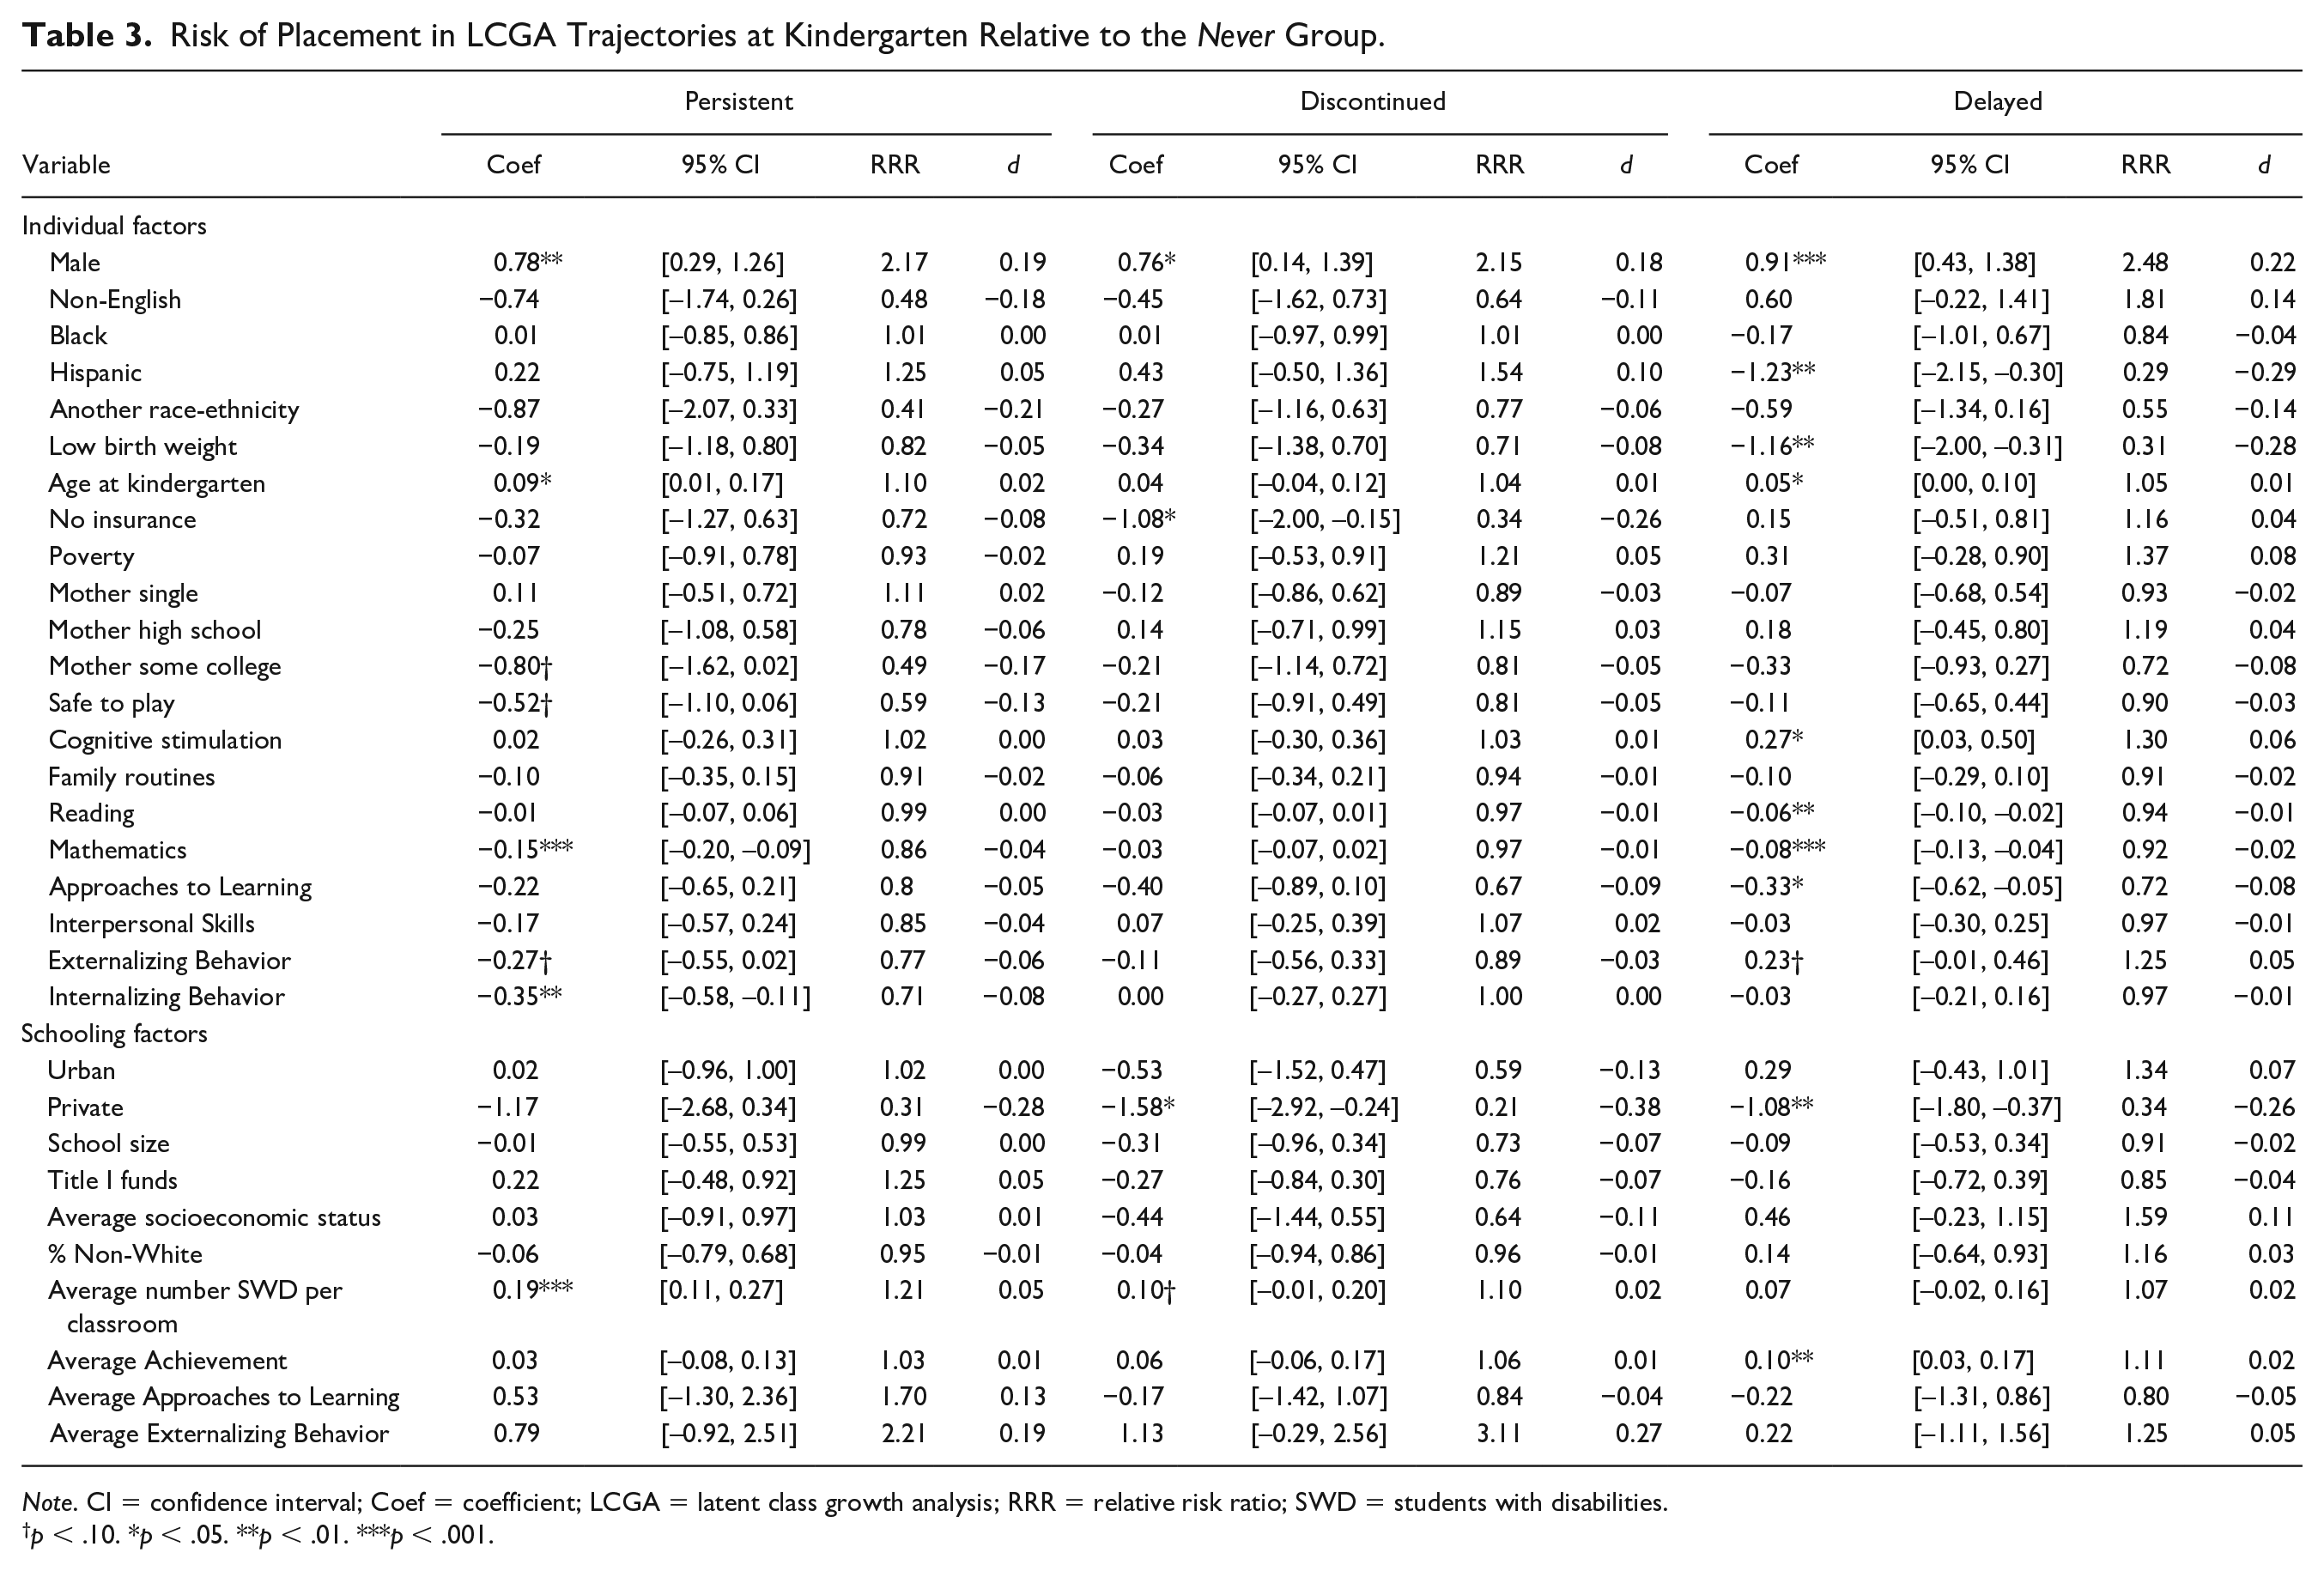
Note. CI = confidence interval; Coef = coefficient; LCGA = latent class growth analysis; RRR = relative risk ratio; SWD = students with disabilities.
p < .10. *p < .05. **p < .01. ***p < .001.
Group membership in the Discontinued trajectory was not associated with any kindergarten differences in achievement or behavior relative to students who never received services. However, students who discontinued services were less likely to lack health insurance coverage (RRR = 0.34, d = −0.26) than their peers never receiving services. They also appear to attend schools with more students who display externalizing problems (RRR = 3.11, d = 0.27, p > .10), though this estimate was not statistically significant.
Relative to students never receiving special education, students who experienced a delayed entry were less likely to be Hispanic (RRR = 0.29, d = −0.29, p < .01) and to have a low birth weight (RRR = 0.31, d = −0.28,p < .01). Again, similar to students following the Persistent trajectory, there were a number of precise estimates that were small in magnitude among students in the Delayed group. These revealed that students in the Delayed trajectory were negligibly older at kindergarten entry (RRR = 1.05, d = 0.01, p < .05), experienced more cognitive stimulation outside of school (RRR = 1.30, d = 0.06, p < .05), displayed poorer reading (RRR = 0.94, d = −0.01, p < .01) and mathematics performance (RRR = 0.92, d = −0.02, p < .001) and fewer positive learning-related behaviors (RRR = 0.72, d = −0.08, p < .05), and attended schools with better overall achievement (RRR = 1.11, d = −0.05, p < .01) in kindergarten. In summary, results demonstrated that different sociodemographic, academic, and behavioral factors uniquely predicted which kindergarten students followed each special education trajectory relative to general education peers.
Next, a second multinomial logistic regression was conducted among only the three special education trajectories. Presented in Table 4, results display the likelihoods of following the Discontinued or Delayed trajectories relative to the Persistent group based on kindergarten predictors. Relative to students who experienced persistent special education service receipt, students following the Discontinued trajectory were significantly more likely to display better mathematics performance (RRR = 1.13, d = 0.03, p < .001) and fewer internalizing problem behaviors (RRR = 1.41, d = 0.08, p < .05) at kindergarten. Though not significant, they also trended toward lacking health insurance (RRR = 0.47, d = −0.18) and having mothers who experienced some college instead of obtaining a bachelor’s degree (RRR = 1.81, d = 0.14). They appeared to attend fewer urban schools (RRR = 0.58, d = −0.13), fewer schools receiving Title I funding (RRR = 0.61, d = −0.12), and more schools of lower SES (RRR = 0.63, d = −0.11) and self-regulation (RRR = 0.50, d = −0.17). This is consistent with the pattern of socioeconomic disadvantage present among students in the Persistent trajectory, especially given few significant or substantive differences between students who never receive or who discontinue services.
Risk of Placement in LCGA Trajectories at Kindergarten Relative to the Persistent Group.

Note. CI = confidence interval; Coef = coefficient; LCGA = latent class growth analysis; RRR = relative risk ratio; SWD = students with disabilities.
p < .10. *p < .05. **p < .01. ***p < .001.
Relative to students who experienced persistent special education service receipt, students in the Delayed group more often spoke non-English (RRR = 3.80, d = 0.32, p < .05), were significantly less likely to be Hispanic (RRR = 0.24, d = −0.35), had both higher externalizing (RRR = 1.65, d = 0.12, p < .01) and internalizing problem behaviors (RRR = 1.38, d = 0.08, p < .05), and attended schools serving fewer SWD at kindergarten (RRR = 0.89, d = −0.14, p < .05). Though not significant, they also trended toward being of lower birth weight (RRR = 0.38, d = −0.23), and attending schools with poorer overall self-regulation (RRR = 0.47, d = −0.18) and externalizing problem behavior (RRR = 0.56, d = −0.14).
Discussion
There have been many calls to more accurately classify when and which students will receive special education services given concern over special education’s costly implementation, potentially inappropriate delivery (e.g., to students of color), and in compliance with national education policy and to assess outcomes like academic achievement (Chudowsky et al., 2009; Schulte & Stevens, 2015; U.S. Department of Education, 2018; Ysseldyke & Bielinski, 2002). Research on the longitudinal risk patterns for participation in special education might also help target early assistance to the neediest students (cf. Michelmore & Dynarski, 2016). The basic motivation for this national-level, longitudinal study was therefore twofold: first, to identify latent trajectories of service receipt among SWD and, second, to explore whether and to what extent we can predict which students follow each trajectory.
Results indicate that students follow heterogeneous patterns of special education service receipt through schooling, and about 18% of students experience at least some special education prior to eighth grade. Around 6% of these students received mostly continuously delivered special education services through eighth grade, and just under 5% discontinued services. Moreover, of the 18% of students experiencing special education, 41% entered and exited more than once. These patterns were further classified into four categories using LCGA to analyze the demographic, achievement, and behavioral factors that might inform special education placement. These trajectories fit the data about the same as an LCGA model with five categories, demonstrating their general robustness to alternative trajectory specifications. Although students who received any services between kindergarten and eighth grade were more likely to be male and to attend public schools, different combinations of other kindergarten factors illuminated the longitudinal profiles of SWD. These factors should be considered by both policymakers and researchers who are concerned with accurately grouping and longitudinally tracking SWD.
Results indicate that about 18% of students experience at least some special education prior to eighth grade.
Study Contributions and Policy Implications
Findings have policy implications for reevaluation and reclassification. In addition to annual IEP reviews, students must be reevaluated for special education eligibility at least every 3 years (20 U.S.C. § 1414[a][2]). Children should receive services based on and in response to their unique disability and special educational needs. Students can and should discontinue service receipt if those services are effective at remediating the disability-related issue that preceded identification. However, results from the present study suggest that SWD who discontinue services experience less disadvantage than SWD who remain eligible for special education, whether in the same IDEA category or through reclassification to a different category. For example, although SWD who discontinued appeared in many ways to be more similar to students who never received services, kindergarteners persistently receiving special education services displayed a pattern of increased socioeconomic disadvantage relative to all but the Delayed group. In contrast, students who discontinued special education did not display these same risk profiles, which is consistent with prior research investigating declassification (e.g., Carlson, 1997; Daley & Carlson, 2009; Ruedel, 2008; SEELS, 2005). Such a pattern of sociodemographic risk among SWD can be a potential marker of systemic bias.
SWD who discontinue services experience less disadvantage than SWD who remain eligible for special education, whether in the same IDEA category or through reclassification to a different category.
One explanation for this finding is that bias regarding familial disadvantage influences practitioner decisions regarding whether to reclassify SWD or discontinue services. For example, disadvantaged families may be more likely to be exposed to environmental toxins that increase risk for disability identification (e.g., Brooks-Gunn & Duncan, 1997; Skiba et al., 2005). Yet, current IDEA eligibility definitions specify that children being evaluated for a learning disability are ineligible for special education if their learning problems arose as a function of cultural, economic, or environmental disadvantage (34 C.F.R. § 300.8[2]). This stipulation could lead to underidentification in areas where such disadvantage is pervasive. Prior research has found that school or district characteristics associated with socioeconomic disadvantage also increase the likelihood of discontinuing services, including living in a low-wealth district, a district with a smaller special education department (Daley & Carlson, 2009; Ruedel, 2008), or a district with a higher proportion of non-White students (Ruedel, 2008). Practitioners operating in areas where environmental stressors may unduly influence disability identification or continuation of special education services (e.g., in areas where high rates of lead in drinking water may predispose children to cognitive or behavioral disabilities) may require different training and support to identify disability or make a determination regarding the termination or continuation of special education service receipt. Increased focus on family–school partnerships, particularly in these areas, may also be required to ensure that services are delivered appropriately and at the right time during schooling.
Another finding of note is that although there were few meaningful academic differences between the Delayed, Persistent, and Discontinued groups, students may receive delayed services even though their kindergarten teachers perceive them as having more emotional or behavioral issues than students persistently receiving special education. This aligns with research demonstrating that, over time, children with early behavior problems are likely to continue displaying problematic behavior patterns, to disengage academically, and to underachieve (Lin et al., 2013; Morgan et al., 2008, 2009, 2012; Stipek & Miles, 2008). These children may eventually be placed in special education even though these problematic behavior patterns are often resistant to treatment after several years without intervention (e.g., Kulkarni & Sullivan, 2019; Morgan et al., 2009; H. Walker et al., 1998). Results therefore align with decades of discourse about the pitfalls of delayed referral, which has often been called the “wait-to-fail” model (e.g., Ramey & Ramey, 2004).
This finding also has implications for practitioners. Indicators of problem behavior as rated by teachers in kindergarten were relatively more important in predicting later special education service receipt than objectively measured academic achievement. This implies that we may need to more seriously consider concerns regarding children’s behavior that are expressed by teachers even as early as kindergarten, as these concerns could indicate a disability. It is also possible that delayed referral occurred for these students because general education teachers are underprepared to distinguish the extent to which disability might undergird inappropriate behavior early in schooling. Teachers report feeling underprepared to teach SWD following their preservice training, and only seven states have specific coursework requirements for how general education teachers should teach SWD at the elementary or secondary levels (Galiatsos et al., 2019). It may be worthwhile to specifically address early behavioral problems through additional training or professional development opportunities.
Teacher ratings of problem behavior in kindergarten were relatively more important in predicting later special education than objectively measured academic achievement.
Finally, evidence from this national-level study demonstrates that a student’s kindergarten school can influence their trajectory through the special education system. For instance, students in both the Persistent and Discontinued groups attended schools serving more SWD at kindergarten, which may have influenced their earlier receipt of services relative to the Delayed group. Parents sometimes seek out schools that cater to SWD once their child’s needs become apparent (Woods et al., 2017) and might especially turn to public schools. Private schools are not legally mandated to provide special education services or programs (though some do), leaving few options for SWD but to attend public schools where districts receive governmental funding to cover the costs of specialized programs. There may also be idiosyncratic variability in the timing at which schools identify SWD. For instance, although Sullivan and Bal (2013) found that school-level predictors were less predictive of special education placement among SWD than individual predictors, Hibel and colleagues (2010) found that placement decreased in schools with more non-White students and poorer overall behavior. Future research should further decompose the interplay between school choice and site-varying school characteristics in the timing of disability identification. Beyond the influence of schools, further attention should be paid to whether the reclassification process varies by state or district. Although the basic process underlying special education identification is outlined through federal law, smaller or rural districts might rely on regional education offices to centralize special education procedures (e.g., disability evaluations and provision of some services). In contrast, larger districts can centralize special education evaluations and services in-house (Umansky et al., 2017). This means that teachers may be more or less burdened with the responsibility of identifying and referring SWD for special education services depending on the size and financial resources of their district. Whether these differences systemically influence reevaluation and reclassification should be further investigated, particularly for students experiencing varying levels of familial disadvantage.
Limitations and Future Directions
Several limitations temper findings from this study. First, these findings should be replicated and extended with newer data. Post-2000 legislative changes to special education policy (e.g., the No Child Left Behind Act and revisions to IDEA) necessitate newer data than the ECLS-K:1998 to answer questions about trajectories of special education services. Because the ECLS-K:1998 sampled only odd grades, the analyses reported here may also underreport (dis)continuity of service receipt. Important to note is that the ECLS-K:1998’s measures do not contain information on why or whether students were appropriately referred to special education or about the specific services they were receiving both prior to and following special education referral.
Second, the outcome of interest in this study was whether the student received special education services generally as opposed to specific IDEA-recognized disabilities. This information was available from surveys given to their special education teachers. Among students who were reported to have an IEP on file in each wave, only about 50% had linked special education teacher data. This resulted in overly small sample sizes for each of the 13 IDEA categories. Moreover, students may not consistently receive services for the same disabilities over time. That is, some students may enter special education with a speech and language classification but switch to a learning disability classification later in schooling (e.g., Marder, 2009). Although these patterns are important to further understand, they are difficult to model with a limited sample size. Future research should investigate patterns in the trajectories of students with specific categorical disabilities, including the extent to which students change categories of service delivery over time.
Third, it is possible that there is more variability within and between schools than is observed here, as the weighting method controlled for students clustered within schools. Because this study was designed to build understanding about national-level patterns in special education trajectories, a natural next step for future research is to investigate state or regional variation in the composition and nature of these patterns. Finally, although the present study was not designed to evaluate causality (e.g., low academic performance in kindergarten causing later special education placement), findings provoke important questions about directionality. These warrant further investigation with a well-controlled or causal method into whether SWD who do not immediately receive formal intervention are at increased risk of experiencing behavioral issues. The increasing availability of large-scale data sets combined with sophisticated quasiexperimental techniques may enable research on this topic without succumbing to the unethical and illegal problems associated with true causal experimental methods (i.e., randomly assigning SWD to receive services earlier or later).
Conclusion
This study captures important dimensionality to service receipt that both replicates and extends prior research. Disability status can change on an annual basis. Accounting for changes in special education classification over time could not only improve measurement of disability and subsequent school functioning (e.g., the achievement gap; Schulte & Stevens, 2015; Ysseldyke & Bielinksi, 2002) but also lead to more appropriate early service provision. Precisely understanding the timing and duration of service receipt is also important for policymakers attempting to improve services delivered to SWD. To more accurately assess risk over time, it is informative to group students according to the longitudinal special education trajectory that students follow (cf. Michelmore & Dynarski, 2016). This might help policymakers and educators more precisely target specialized assistance to students at risk of special education placement.
Supplemental Material
EXC_Supplement_Final – Supplemental material for Examining Longitudinal Patterns of Special Education Service Receipt
Supplemental material, EXC_Supplement_Final for Examining Longitudinal Patterns of Special Education Service Receipt by Adrienne D. Woods in Exceptional Children
Footnotes
Author’s Note
This research was supported by a grant from the American Educational Research Association (AERA), which receives funds for its AERA Grants Program from the National Science Foundation, under Grant No. DRL-1749275. Opinions reflect those of the author and do not necessarily reflect those of the granting agencies. The author would also like to thank Dr. Melissa Peckins for her guidance in data analysis. There are no conflicts of interest to disclose.
Supplemental Material
Supplemental material for this article is available online.
References
Supplementary Material
Please find the following supplemental material available below.
For Open Access articles published under a Creative Commons License, all supplemental material carries the same license as the article it is associated with.
For non-Open Access articles published, all supplemental material carries a non-exclusive license, and permission requests for re-use of supplemental material or any part of supplemental material shall be sent directly to the copyright owner as specified in the copyright notice associated with the article.