
Abstract
This meta-analysis examined the effectiveness of supplemental Tier-2 mathematics interventions for students with mathematics difficulties (MD). We reviewed 39 experimental and quasi-experimental studies that included 40 independent samples, with 61 treatment groups. Utilizing robust variance estimation (RVE), results revealed a treatment effect of 0.41. Mixed-effects meta-regression analyses revealed that Tier-2 interventions were moderated by intervention model type, group size, and type of measure. We present recommendations for future research and implementation of mathematics practices.
Mathematics competency in school is associated with success in college and future employment (Lee, 2012; National Mathematics Advisory Panel, 2008). However, data from the National Assessment of Educational Progress (NAEP) indicate that not all students are meeting the benchmarks for mathematical proficiency. For example, 83% of fourth graders with disabilities scored at or below the basic level on the 2019 NAEP (National Center for Education Statistics, n.d.) compared with 55% without disabilities; 91% of eighth-graders with disabilities scored at or below the basic level compared with 62% without disabilities. Following calls in the early 2000s to raise student achievement using scientifically based research practices (No Child Left Behind Act of 2001, 2002), there has been an increase in intervention research for improving mathematics learning of students with learning disabilities and those who have mathematics difficulties (MD). However, mathematics achievement gaps have not decreased (Dossey et al., 2016; Rittle-Johnson & Jordan, 2016).
One promising approach to raise the mathematics achievement of students with MD is the implementation of response to intervention (RTI) or multitiered systems of support (MTSS) (Fuchs & Fuchs, 2006; Gersten, Beckmann, et al., 2009). Built from the theories of prevention science (Gordon, 1983), tiers vary in the levels of intensity of instruction and intervention based on student needs (Schulte, 2016). RTI or MTSS typically consists of a three-tiered instructional model that includes Tier 1 or core instruction, which is typically aligned with state and national standards (e.g., Common Core State Standards [CCSS]; National Governors Association Center for Best Practices & Council of Chief State School Officers, 2010), and Tier 2 and Tier 3 interventions. Tier 2 interventions are intended to provide supplemental, strategic instructional support to students demonstrating some academic risk for whom core instruction may be insufficient. Tier 3 interventions may serve as supplemental or replacement to Tier 1 and Tier 2 instruction and focus on remediation of skills for high-risk students with severe and persistent learning needs. It is worth noting that although a defining feature of a tiered framework is relative increase in intensity among the tiers, with more time and resources committed to students at Tier 3 relative to Tier 2 or Tier 1 interventions, descriptions of Tier 2 and Tier 3 are varied in the literature, and differences between these tiers may not be distinct. For example, some researchers have described Tier 2 support to include small groups (four to eight students) and Tier 3 supports as groups of one to three students (Chard & Harn, 2008), whereas others note that both Tier 2 and Tier 3 may include small groups of one to three students (Denton et al., 2007; Wanzek et al., 2016).
As local education agencies confront many decisions about academic intervention, identifying mathematics interventions to improve the performance of students who struggle in mathematics is of great importance. To address this need, we conducted a meta-analysis of the efficacy of Tier 2 interventions, which, although less intensive than Tier 3 interventions, target students’ specific mathematics deficits with the intent to remediate those deficits and help students progress toward grade-level standards. Although Tier 3 is usually considered special education, Tier 2 interventions are important because a majority of students with disabilities are likely to receive Tier 2 interventions that focus on their specific needs.
Tier 2 interventions are important because a majority of students with disabilities are likely to receive Tier 2 interventions that focus on their specific needs
Interventions That Enhance Mathematics Performance of Students With MD
The focus of this meta-analysis was on the influence of Tier-2 interventions designed to influence mathematics performance of students with MD, who have persistent mathematics difficulties because they struggle with both the abstract formal structures of mathematics and the cognitive processes involved in mathematics (e.g., Fuchs et al., 2010). That is, many students with MD do not use conceptual knowledge and procedural knowledge effectively to understand the problem and employ information purposefully or use their meta-knowledge about mathematics to monitor and reflect on their learning. Consequently, the need for targeted interventions to bolster the mathematics performance of these students is undisputed.
Research in special education reveals that interventions that enhance the mathematics performance of students with MD include (a) explicit and systematic instruction (e.g., Baker et al., 2002; Gersten, Beckmann, et al., 2009; Gersten, Chard, et al., 2009; Kroesbergen & Van Luit, 2003), (b) cognitive strategy instruction (Swanson & Hoskyn, 1998; Zhang & Xin, 2012), and (c) instruction based on common underlying problem structures (Gersten, Beckmann, et al., 2009; Jitendra et al., 2015; Peltier & Vannest, 2017; Zhang & Xin, 2012). Explicit and systematic instruction, which consists of “providing models of proficient problem solving, verbalization of thought processes, guided practice, corrective feedback, and frequent cumulative review” (Gersten, Beckmann, et al., 2009, p. 6), is an important feature of most cognitive strategy and underlying problem-structure interventions. Other specific intervention components that are crucial for the success of these interventions include the use of heuristics, student verbalization, visual models for representing mathematical ideas, and sequencing examples (e.g., concrete to semiconcrete to abstract; Gersten, Chard, et al., 2009; Jitendra et al., 2016).
Prior Meta-Analyses and Rationale for This Study
To date, several meta-analyses of mathematics interventions have made important contributions to understanding the effectiveness of mathematics interventions for students with MD. However, there are several limitations of those reviews and consequently important unanswered questions that this meta-analysis addresses. The majority of reviews focused on specific math skills, such as computation or fact fluency (e.g., Burns et al., 2010), early numeracy (Nelson & McMaster, 2019), word problem solving (Xin & Jitendra, 1999; Zhang & Xin, 2012; Zheng et al., 2013), fractions (Shin & Bryant, 2015), or algebra (Hughes et al., 2014). Other reviews have specifically focused on mathematics interventions for elementary (Chodura et al., 2015; Dennis et al., 2016; Kroesbergen & Van Luit, 2003; Peltier & Vannest, 2017) or secondary students with MD (Jitendra et al., 2018). Other researchers examined the effects of mathematics interventions for students in Grades 4 through 12 (Stevens et al., 2018). Two meta-analyses focused on K–12 students with learning disabilities (Gersten, Chard, et al., 2009; Swanson & Hoskyn, 1998) or MD (Baker et al., 2002) and identified effective practices (e.g., explicit instruction, use of heuristics, visual models) regarding mathematics interventions. However, the literature search ended in 2015 (Stevens et al., 2018) or 2017 (Jitendra et al., 2018), and since then, there have been many advances in developing and evaluating mathematics interventions. Furthermore, these previous meta-analyses included interventions across levels of instruction, including Tier 1 core mathematics instruction and Tier 2 interventions. A systematic review of Tier 2 interventions has not been conducted even though the research on Tier 2 interventions is dominant in the literature.
This meta-analysis would fill the gap on mathematic intervention research examining the outcomes related specifically to Tier 2 interventions and identifying key instructional components that influenced these effects. According to the Institute of Education Sciences’ (IES) Assisting Students Struggling in Mathematics: Response to Intervention (RtI) for Elementary and Middle Schools practice guide (Gersten, Beckmann, et al., 2009), Tier 2 interventions typically meet for 20 to 40 min, between three and five times a week. The IES mathematics practice guide recommendations also include that Tier 2 instruction should be explicit and systematic and should focus on whole numbers in kindergarten through Grade 5 and on rational numbers in Grades 4 through 8. Interventions should address “instruction on solving word problems that is based on common underlying structures” (Gersten, Beckmann, et al., 2009, p. 6). Furthermore, instructional materials should support student “use of visual representations of mathematical ideas” and “provide opportunities for developing fluent retrieval of basic arithmetic facts” (Gersten, Beckmann, et al., 2009, p. 6). Thus, by reviewing all of the research meeting the criteria for Tier 2 interventions, we can provide clear direction for next steps in research and implications for designing Tier 2 interventions.
Purpose of the Current Meta-Analysis
Previous meta-analyses demonstrated that mathematics interventions enhanced mathematics outcomes of students with MD (e.g., Baker et al., 2002; Jitendra et al., 2018; Stevens et al., 2018), but no analysis has examined the effects of Tier 2 mathematics interventions on these students’ mathematics outcomes. Educators’ knowledge of the overall effect of Tier 2 mathematics interventions based on systematic reviews is limited, a limitation our synthesis is designed to address. Educators also do not know what types of interventions have the most influence on mathematics performance. Nor do we know if other study characteristics make a difference in Tier 2 intervention outcomes, characteristics such as participants’ MD status, grade level of subjects, who delivered the intervention, instructional group size, duration of the intervention, and type of measure.
In this meta-analysis, we focused on students with MD who may or may not have been identified with a specific learning disability but manifest problems indicating likely difficulty processing and understanding mathematics. The primary criterion for classifying students with MD was a score on a standardized achievement test that falls below a cut point (Mazzocco, 2007). In RTI approaches, researchers stress the importance of examining how different factors—cut scores and types of screening criteria (e.g., calculation deficits only, word problem solving deficits only, both calculation and word problem solving deficits, comprehensive mathematics deficits)—may lead to different estimates of severity in MD and, thus, influence the observed effects of mathematics interventions (Fuchs et al., 2014; Murphy et al., 2007; Peng et al., 2018). In the present meta-analysis, we examined how mathematics interventions may be more or less effective for children screened by different mathematics measures and likely identified with comprehensive MD, a proxy for severity of MD.
The purpose of this meta-analysis is to examine the influence of Tier 2 mathematics interventions on the mathematics outcomes for prekindergarten (preK) through 12th-grade students with MD and to evaluate potential moderators that influence the effects of Tier 2 interventions on these students’ outcomes. Our research questions are as follows:
What is the magnitude of the effect of Tier 2 intervention studies that target mathematics as an outcome?
Are the effects of Tier 2 interventions moderated by study characteristics, such as participants’ MD status, grade level, intervention model type, interventionist, group size, duration of intervention, type of measure, and overall quality of the study?
Method
We adopted various methods consistent with standards for meta-analysis (e.g., Preferred Reporting Items for Systematic Reviews and Meta-Analyses). In the following section, we describe procedures, such as full electronic search strategy; information sources included in the search; study characteristics (e.g., participants, interventions, comparisons, outcomes, and study design) and report characteristics (e.g., years considered, language) used as criteria for eligibility; study selection; data items and data collection process (e.g., data extraction from reports); summary measures (e.g., difference in means); risk of bias in studies; synthesis of results (see analytic method); and additional analysis (e.g., metaregression).
Literature Search and Eligibility Criteria
We conducted a systematic search of the literature to identify mathematics intervention studies. First, we searched the online databases ERIC, PsycINFO, and Academic Search Premier to identify peer-reviewed studies published between 2000 and September 2019. Although the RTI process was introduced in 2004 with the reauthorization of the Individuals With Disabilities Education Act, we selected 2000 as the time period for the start of the search because it coincided with the national reform movement in mathematics (National Council of Teachers of Mathematics, 2000) and the accountability movement (the No Child Left Behind Act of 2001) that mandated schools to provide effective instruction for all students. We searched abstracts for mathematic search terms and roots (i.e., math or mathematic*, intervention or instruction or treatment or training or teaching method* or Tier 2 or RTI or MTSS or response to intervention or response to instruction or tutoring) in combination with key population search terms and roots (at-risk or difficult*, struggling or learning problem*, underperforming or below average or overachieving or disadvantaged). Second, we conducted an ancestral search by reviewing citations within prior meta-analyses (i.e., Chodura et al., 2015; Dennis et al., 2016; Gersten, Chard, et al., 2009; Jitendra et al., 2018; Peltier & Vannest, 2017; Stevens et al., 2018; Zhang & Xin, 2012; Zheng et al., 2013) and review articles (e.g., Hwang & Riccomini, 2016). Third, we examined cited references within articles yielded from reference databases for possible inclusion.
Studies were included in the review if they met the following eight criteria. First, the sample included students with MD in preK through Grade 12 who met one of the following conditions: (a) had a mathematics difficulty (scored at or below the 40th percentile on a screening mathematics test) or (b) were determined by the authors of the study to be eligible for Tier 2 services using specific criteria (e.g., Doabler et al., 2016). The 40th percentile cutoff criterion was selected to ensure broad representation of students who may be at low-to-high risk of developing mathematics difficulties (see Fuchs et al., 2014; Mazzocco, 2007).
Second, studies were included when more than 50% of the participants were students with MD or disaggregated data were provided for students with MD. Third, the investigation evaluated a mathematics intervention provided in English. Fourth, studies employed a randomized controlled trial (RCT) or quasiexperiment and compared students in treatment groups taught using a specific mathematics intervention with those in control groups. Fifth, studies included at least one outcome measure assessing mathematics performance that evaluated the effects of the intervention. Sixth, each treatment condition had to include a minimum of 10 students (Morris, 2008). Seventh, studies had to have a minimum of 15 treatment sessions. This requirement is intended to focus the review on Tier 2 interventions intended to provide sufficient intensity of instruction to support student learning. Eighth, studies reported data needed to calculate effect size.
We applied four exclusionary criteria for studies. First, studies conducted outside the United States were excluded because the RTI-MTSS framework is specific to studies conducted in the United States. Second, we excluded studies with combined samples of students with and without MD if data for the subgroup of students with MD were not disaggregated or at least 50% of the sample did not include students with MD. Third, we excluded studies if they employed a single group pre-/posttest design or single-case design, because standardized mean effects would likely be inflated in these studies (see Gersten, Chard, et al., 2009). Fourth, we excluded computer-assisted instruction and peer-mediated instruction because the purpose of this meta-analyses was to understand the influence of educator-led interventions. Additionally, peer-mediated instruction is typically used as a Tier 1 instructional strategy.
The search yielded a total of 4,010 studies for screening. Figure 1 illustrates the literature search and screening. After removing duplicate listings (n = 1,116), we reviewed titles and abstracts of 2,894 articles. Interrater agreement calculated between the first and second authors for the initial screening using kappa (κ), which takes into account chance agreement, was 0.87. Disagreements were resolved by the first author, who had 30 years of experience conducting mathematics research. Following the exclusion of 2,782 records based on screening of titles and abstracts, we retrieved a total of 112 references for full-text screening. Each study was carefully read to determine if it met all inclusion and exclusion criteria. The largest excluded category consisted of 25 studies that did not include Tier 2 interventions. Twelve studies were excluded because they did not include a control condition or were single-subject-design studies, and 11 studies were conducted outside of the United States. In nine studies, there were fewer than 10 subjects in each treatment group. Eight studies did not disaggregate the data for students with learning disabilities or MD, and five studies investigated peer-assisted tutoring or computer-adaptive instruction. In three instances, we could not extract sufficient data to calculate an effect size. This resulted in a total of 39 studies that were included in this meta-analysis.
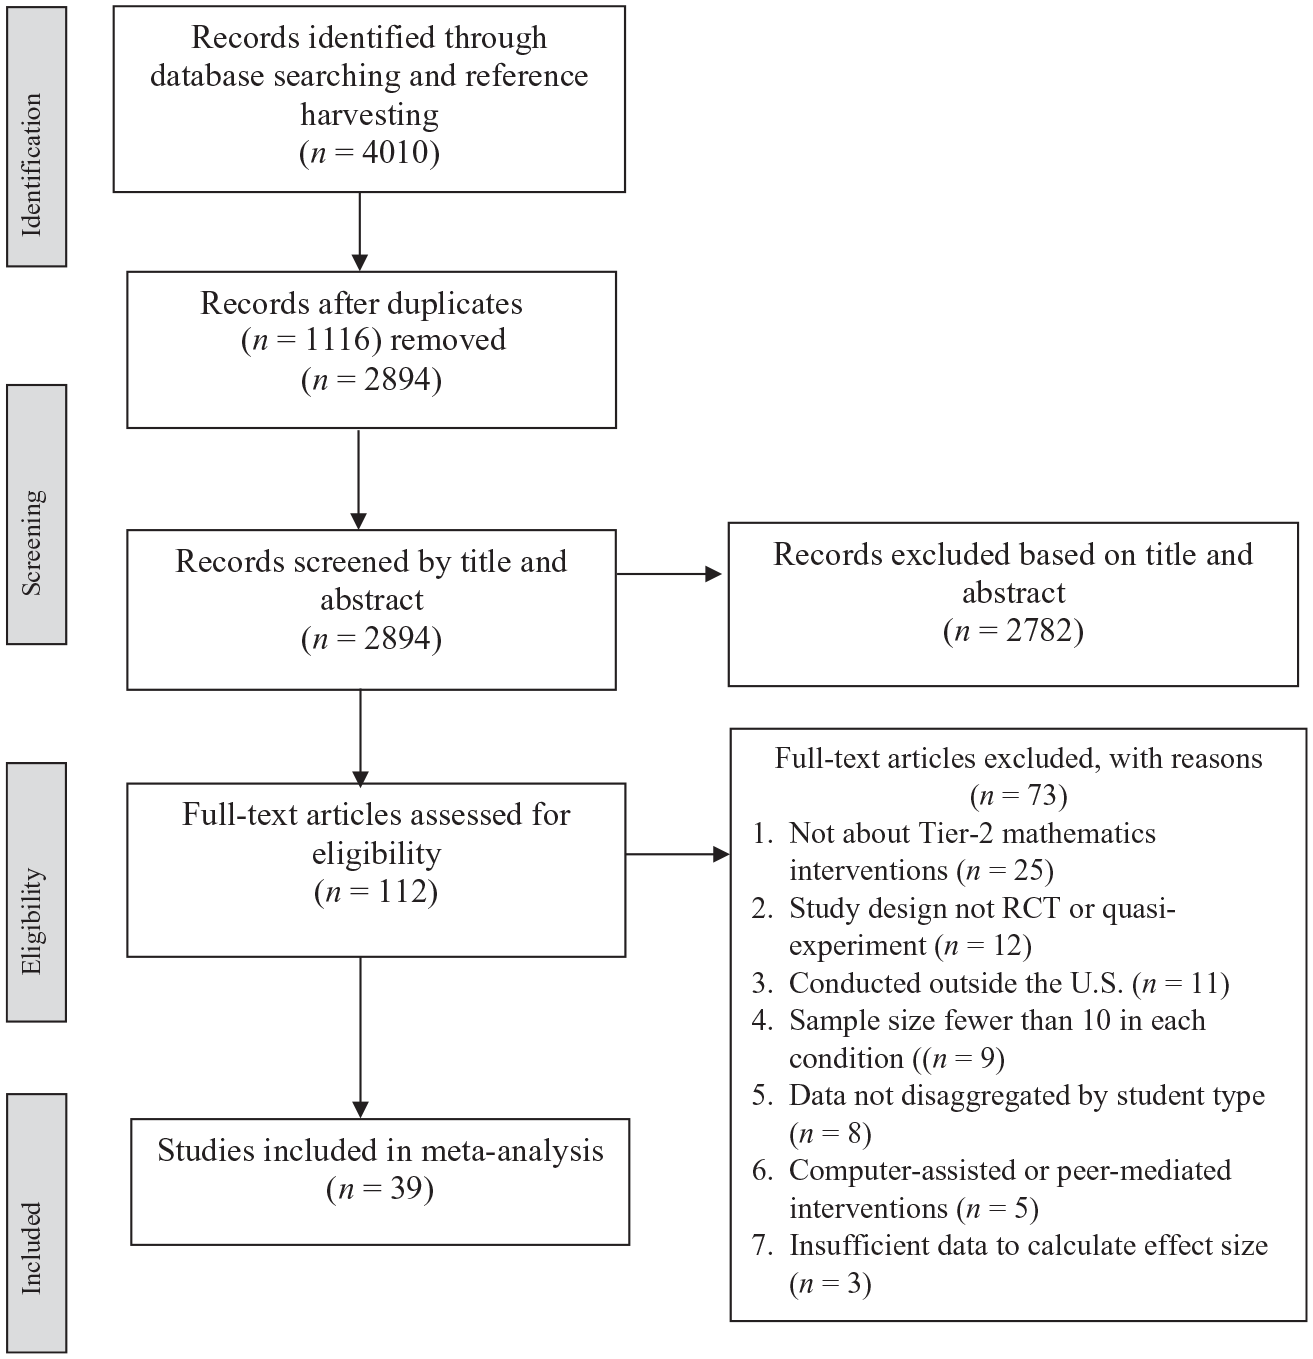
Flowchart of the search and screening process.
Coding of Studies
We developed a detailed coding sheet to organize relevant information about each study. We coded each study for the following descriptors: (a) year of publication; (b) research design; (c) participants in terms of their MD status (screening based on a single test or multiple tests), grade level (preK through Grade 2, Grade 3, Grade 4 and above), gender, race or ethnicity, socioeconomic status, and language status; (d) intervention model type; (e) interventionist (researcher, school personnel, researcher and school personnel, or other [e.g., tutors from the community]); (f) group size; (g) duration of intervention (or total instructional time, measured continuously in hours); (h) mathematics domain and number of CCSSs addressed; (i) implementation fidelity; (j) professional development (provided or not provided and hours); (k) nature of comparison condition; and (l) type of measure (standardized, researcher created).
We developed a set of codes for categorizing intervention models that were informed by research for defining classifications. These codes included explicit instruction or direct instruction, underlying problem-structure instruction (e.g., schema-based instruction, schema broadening (and transfer) instruction, conceptual model–based problem solving), and strategy (cognitive) instruction. It is important to note that studies on underlying problem-structure instruction also include explicit instruction, but they are unique in that they focus on the underlying problem structure (e.g., Boonen et al., 2013).
We coded group size as one to one versus two to three versus four or more. If a study reported a range of two to four students, for example, we used the average (i.e., three) for this variable. Four studies had two treatment conditions each with a different instructional group size (two or five). These studies combined the treatment conditions when analyzing the effects of the intervention. As such, we used the average (3.5 and rounded to 4) to record the group size in these studies.
In addition, we assigned each study a score for seven quality indicators, with a score of 1 if the condition was met and 0 if not met (see Graham et al., 2018). The indicators consisted of (a) high-quality design (RCT); (b) more than two groups or classes in each condition; (c) teacher effects controlled, with teachers randomly assigned to condition or taught in each; (d) overall attrition not greater than 10%; (e) treatment and control conditions equivalent on pretest mathematics measures, with mean score difference between conditions not exceeding the smallest standard deviation for the two conditions at pretest (RCTs that did not include a pretest were deemed to meet the criterion); (f) outcome measures that were reliable, with a reliability coefficient of .70 or greater (standardized measures were assumed to be reliable); and (g) evidence of treatment fidelity provided. For pretest equivalence and reliability quality scores, we adjusted for the number of measures that met the criterion when studies had multiple mathematics measures. For each study, we calculated a summative score for proportion of quality indicators met by averaging a study’s quality indicator points. As such, quality of study index could range from 0 to 1.
Each study was independently coded by two coders (doctoral students in educational psychology), and interrater agreement between coders across categories (e.g., participants, measures) calculated using kappa averaged 0.85 (95% confidence interval [CI]: [0.76, 0.94]). The most frequent disagreements involved the category implementer, followed by type of measure and intervention model. The two coders subsequently resolved discrepancies in coding through discussion, meaning the final agreement was 100%.
Effect Size Calculation and Analytic Method
For all studies, we calculated standardized mean differences (SMDs). Whenever available, we used covariate adjusted mean differences; otherwise, the adjusted standard deviation was used to calculate SMDs. We used Hedge’s g to calculate an unbiased estimate of the effect size in small samples. For each outcome measure in the studies reviewed, we extracted data (e.g., sample size, mean, standard deviation) needed to calculate effect sizes and entered the data into an Excel sheet. Kappa agreement between two raters for data entry averaged 0.87 (95% CI: [0.85, 0.89]). All effects were computed using R software (Version 3.6.1; R Core Team, 2019).
In all meta-regression analyses, we used random-effects models, weighting by the inverse variance of effect sizes. Studies with more participants were given more weight in the metaregression models. We included studies with multiple intervention groups with different participants and studies using multiple tests for the same intervention groups. As such, we used robust variance estimation (RVE; Hedges et al., 2010) to avoid problems with dependence between effect sizes. RVE requires the mean correlation between all pairs of effect sizes within a study (rho) to estimate study weights and between-study variance. Because correlations between the effect sizes in each study are usually not reported, we conducted a sensitivity analysis in which varying rho values are used in the meta-analytic models. We found no differences in the results of the meta-analysis using rho values of 0.2, 0.5, and 0.8. The results reported used a rho of 0.8. We included a small-sample bias correction that adjusted for both the degrees of freedom and the residuals when estimating the coefficients to avoid Type 1 error (Tipton, 2015).
In addition, we examined the sample of effect sizes for evidence of outliers (i.e., one or more effect size values that are more than three standard deviations above or below the average weighted effect size). Descriptive statistics suggested the assumption of normality needed for inferential analyses was satisfied despite the presence of one outlier. At the same time, we probed the sensitivity of our findings to this outlier by conducting all analyses with and without this outlier. Because the overall findings were similar with and without the outlier, we report the findings obtained for the full sample.
Evaluating heterogeneity of effect sizes and moderator analyses
We evaluated heterogeneity of variance using the I2 measure to characterize the extent to which the dispersion of effect sizes is likely due to sampling error (chance) versus potentially explainable variation. Large I2 values signal most variation in effect sizes is between studies, and moderator analyses are more likely to be fruitful. We used the following guidelines for interpreting the I2 statistic: I2 = 25% suggests a small amount of heterogeneity, I2 = 50% suggests medium heterogeneity, and I2 = 75% suggests large heterogeneity (Cooper et al., 2009).
We conducted a multiple-metaregression analysis to explore the effects of moderators (i.e., participant’s MD status, grade level, intervention model type, interventionist, instructional group size, duration of intervention, type of outcome measure, and study quality) on students’ mathematics outcomes (Lipsey & Wilson, 2001). Unlike subgroup analysis, metaregression analysis allows the inclusion of multiple moderators in the model. To account for any potentially confounding collinearity, we examined bivariate correlations among moderators and found little evidence of collinearity, with most correlations <|.12|. For the metaregressions model, we used a forced-entry method where we entered the eight moderators simultaneously (Field et al., 2012). Participants’ MD status, grade level of subjects, intervention model type, interventionist, group size, and type of measure were categorical variables, which were dummy coded and entered in the metaregression model. Quality of study and intervention duration (hours), which was mean centered (15 hr), were entered in the model as continuous variables.
Results
Study Characteristics
Supplemental Table S1 provides a complete overview of the characteristics of each study included in the current meta-analysis. Our final sample of 39 total studies spanned 17 years (2002–2019), with the majority of studies (64%) published between 2014 and 2019, 28% published between 2008 and 2013, and 8% published before 2008. Ninety-two percent of studies employed RCTs. Of the studies that were RCTs, randomization was at the student level (86%). The majority of studies (87%) included business as usual as the comparison condition. Ninety-five percent of the studies reported fidelity of implementation. About 59% of the studies used a combination of researcher-developed and standardized measures, 28% used only researcher-developed measures, and 13% used only standardized measures.
Sample sizes included a broad range of participants (i.e., 22–1,033). English learner status was reported for approximately 70% of the studies, which ranged from 1% to 100% (mean = 29%). Most studies (65%) also reported percentage of participants receiving special education services, which ranged from 4% to 100% (mean = 23%). The mean percentage of students eligible for free and reduced-price lunch reported in 55% of the studies was 66% (range: 34% to 90%). The majority of the studies (91%) involved elementary-age populations. Of these, most studies comprised students in Grade 3 (38%), followed by Grade 1 (21%) and kindergarten (18%). Only one study each included students in Pre-K, Grade 4, and a combination of grades at the elementary level. About 8% of the studies comprised middle school students, and 3% included both elementary and middle school students. Seventy-four percent of the studies reported providing professional development training. About half of the studies (48%) evaluated explicit strategy instruction, 26% of the studies evaluated the underlying problem-structure instruction, and 24% evaluated strategy instruction. One study that included two treatment groups evaluated explicit instruction only versus explicit instruction combined with self-regulated strategy instruction.
We found that 56% of the studies were implemented by researchers, school personnel (teachers or paraprofessionals) were the interventionists in 26% of the studies, researchers and school personnel composed 10% of the implementers, and 8% were implemented by “other.” On average, 46% of the interventions were implemented in small groups of four or more students, and the average group size in 26% of the studies was three. Four studies (10%) reported a group size of two or five, and seven studies (18%) provided one-on-one instruction. With regard to duration of intervention, there is a fairly even distribution of studies reporting intervention duration of fewer than 15 hr (38%) or between 15 and 20 hr (33%). The remaining studies provided between 21 and 30 hr of intervention (2%), and only two studies (5%) provided more than 30 hr of instruction.
Research Question 1: What is the magnitude of the effects of Tier 2 interventions that target mathematics as an outcome?
Table 1 displays the results of metaregressions, which include 256 effect sizes from 39 studies that yielded 40 independent samples and included a total of 61 treatment groups. The mean number of effect sizes per treatment group was seven, with a range of one to 15. The first column in Table 1 contains only the constant. The overall weighted mean effect size of 0.41 for Tier 2 mathematics intervention is moderate and statistically significant (95% CI: [0.33, 0.48]). There is considerable heterogeneity between effect sizes, which range from −0.92 to 3.04. The I2 statistic is 72.8%, implying there is systematic variation between effect sizes, which motivates the moderator analyses.
Research Question 2: Are the effects of Tier 2 interventions moderated by study characteristics, such as participants’ MD status, grade level, intervention model type, interventionist, group size, duration of intervention, type of measure, and overall quality of the study?
Results From Metaregressions Examining Differences in Effect Sizes Attributable to Moderators.
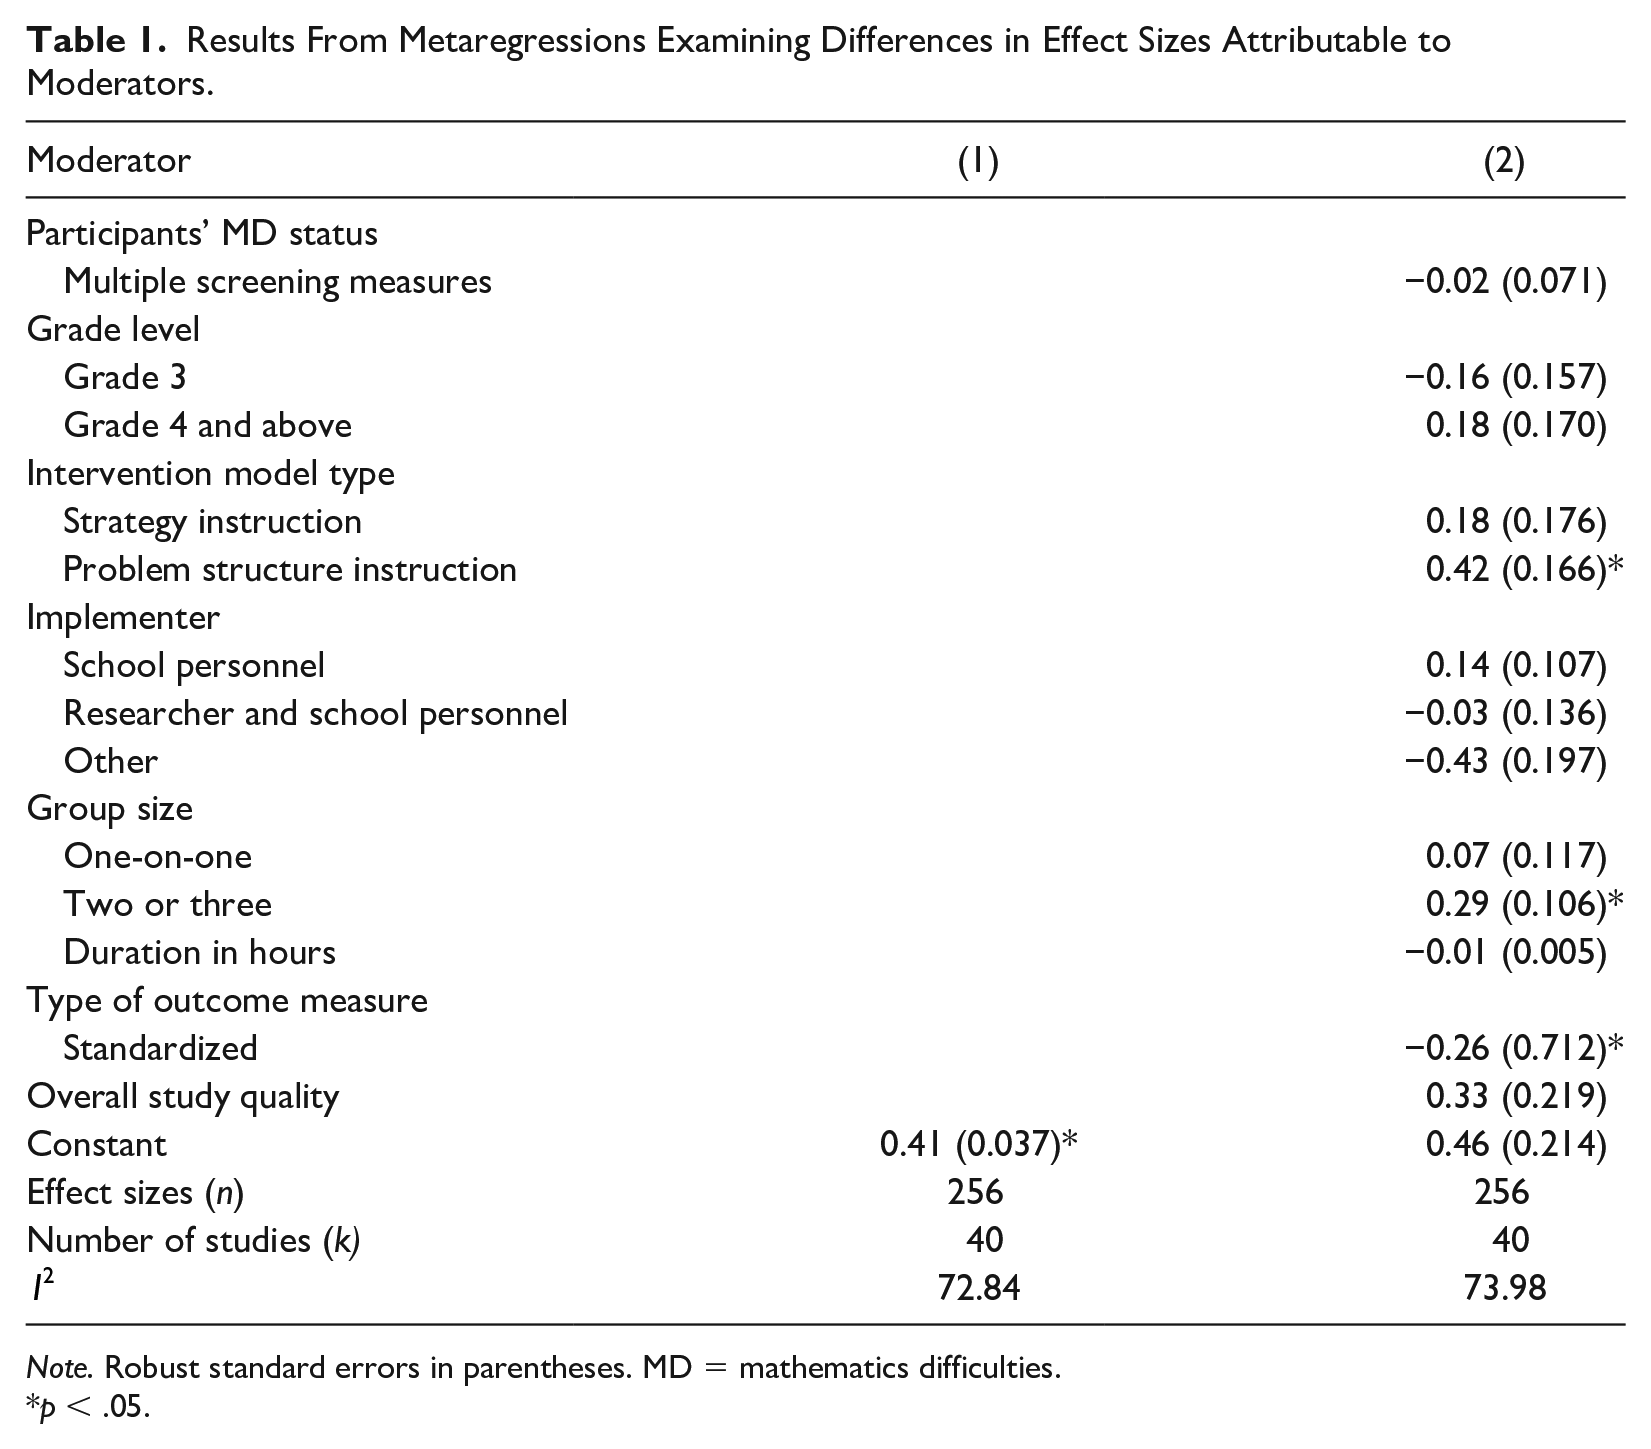
Note. Robust standard errors in parentheses. MD = mathematics difficulties.
p < .05.
The second column of Table 1 shows results for metaregression analysis with the moderators added. The overall weighted effect size of 0.46 is not significant after including eight moderators (plus a constant) in the regression and controlling for predictors related to participants’ MD status (screening using a single measure), grade level of subjects (preK to Grade 2), intervention type (explicit instruction), implementer (delivered by researchers), group size (four or more), duration of intervention, type of outcome measure (researcher created), and study quality. The association between effect sizes and participants’ MD status based on multiple screening measures is negative, small, and not significant. The association between effect sizes and Grade 3 is negative and not significant, whereas that between effect sizes and Grade 4 and above is positive and not significant. The indicator for intervention model is positive and significant, with an effect size of 0.42 for problem-structure instruction only, meaning that problem-structure instruction was associated with an effect increase of 0.42 above the average adjusted effect of 0.46 (p < .05). In contrast, use of strategy instruction was associated with a positive and nonsignificant predicted effect (0.18). The indicator for group size is positive and significant, with an effect size of 0.29 for group size of two or three only, meaning that group size of two or three was associated with an effect increase of 0.29 above the average adjusted effect of 0.46 (p < .05). For the implementer indicator, the effect size for interventions delivered by school personnel (0.14) is positive and not significant, whereas the effects for researchers and school personnel combined (−0.03) and for interventions delivered by “other” (−0.43) are negative and nonsignificant. For the variable intervention implemented by “other,” RVE estimate with fewer than 4 degrees of freedom is unreliable (Tipton, 2015), making the results inconclusive.
The indicator for intervention model is positive and significant, with an effect size of 0.42 for problem-structure instruction only
Duration of intervention was not a significant predictor of student outcomes. Each unit increase in the number of hours (1-hr increase) is associated with a negligible and nonsignificant decrease in effect size of 0.01. The indicator for standardized measures is negative, with a magnitude around −0.26, and significant. The quality-of-study indicator was not a significant predictor. The I2 statistic of 73.9% in Table 1 indicates that there is substantial heterogeneity for the model with the moderators included; however, the increase in heterogeneity from the baseline model is minimal. The still-unexplained variance suggests the need to further explore this between-studies variation.
Discussion
To our knowledge, this study represents the first meta-analysis evaluating the effects of Tier 2 interventions on the mathematics outcomes of students with MD in preK through Grade 12. With respect to our first research question regarding the overall effect of Tier 2 interventions on the mathematics performance of students with MD, the research demonstrated a moderate, positive effect size of 0.41. An effect size of 0.41 can be interpreted as approximately 66% of students in the treatment group performed above the mean of students in the control group (Lipsey et al., 2012).
The results of this meta-analysis were similar to other syntheses of mathematics interventions for elementary and secondary students with MD that yielded average effect sizes from 0.37 to 0.53 (Dennis et al., 2016; Jitendra et al., 2018; Stevens et al., 2018). It is worth noting that 72% of the studies in the current meta-analysis included standardized measures only (13%) or a combination of both standardized and researcher-developed measures (59%). As such, the results of our meta-analysis may not have inflated the intervention effects compared with intervention effects in the prior reviews. In contrast, the results of this meta-analysis yielded a smaller average effect compared with another review (0.83; Chodura et al., 2015). The difference in results might be attributable to varying inclusion criteria, focus on elementary school students only, few studies that included standardized mathematics measures, and that the Chodura et al. (2015) literature search ended in 2013. In sum, Tier 2 interventions successfully addressed mathematics skill deficits for students with MD. This finding is encouraging because these less extensive interventions were sufficient to positively affect student mathematics outcomes in a variety of domains (e.g., counting and cardinality, operations and algebraic thinking, fractions, ratios, and proportions).
When we examined the moderating influences of study characteristics, we found few significant moderators of effect sizes. Specifically, intervention model type, group size, and type of measure moderated the effects of mathematical competence. Regarding intervention model type, problem-structure instruction was found to be the only model that significantly affected the effects of intervention on mathematics outcomes. This is consistent with prior research that indicates positive effects for interventions aligned with contemporary views of mathematics emphasizing the importance of priming the underlying mathematics problem structure (Jitendra et al., 2015). These interventions included a variety of features, such as identifying the problem type, representing problems using visual-schematic diagrams that highlight the mathematical relation between quantities in the problem, or identifying transfer features. In contrast, the effect for cognitive strategy instruction was not significantly associated with the mathematics outcomes of students with MD. This finding is consistent with a previous review that indicated cognitive strategy instruction did not meet the standards for evidence-based practice (Montague & Dietz, 2009). It is important to note that there are various examples of strategy instruction (e.g., visual strategies, verbal strategies, paraphrasing propositions, self-regulated strategy) in this category, and only a few studies in our meta-analysis examined each of these different examples. For cognitive strategy instruction to be effective requires the development of flexibility and adaptability, which we did not evaluate in the studies reviewed (see Jitendra et al., 2015).
With regard to the indicator group size, instruction provided in small groups of two or three students only was found to affect Tier 2 intervention effects. Intervention provided one-on-one did not alter student mathematics outcomes. We note that the majority of studies in this meta-analysis with a group size of at least four or more students included small-group instruction of four or five students. There were only two studies with larger group sizes (four to seven and four to 10 students). Our finding for group size is not consistent with previous research on less intensive (Tier 2) reading interventions (Wanzek et al., 2016) and student response to reading interventions conducted at the early- or upper-elementary levels, which found no moderating effects for group size (Tran et al., 2011; Vaughn et al., 2003). However, consistent with previous research results, small-group instruction (two or three students) has been found to improve student outcomes (Elbaum et al., 2000). We also note that Nelson and McMaster (2019) found small-group instruction improves student outcomes in a meta-analysis of early numeracy interventions. A possible explanation for the positive and significant findings for small-group instruction of two or three students (unlike one-on-one implementation) in our meta-analysis is that it allows for not only teacher–student interactive dialogue but also student-to-student talk to promote thinking and increase student understanding of key mathematics ideas.
Standardized measures had lower and negative effect sizes as they are less likely aligned with the intervention than researcher-designed measures (Cheung & Slavin, 2016). In contrast, the magnitude of effects was not related to participants’ MD status or grade level of subjects. The finding for MD status suggests that Tier 2 interventions have similar effects regardless of the severity of MD (i.e., low performance on multiple measures). Regarding grade level, the majority of individuals included in this meta-analysis were elementary school children identified as having MD (92%). One plausible explanation for the lack of association between grade level and effects is that students with MD in the elementary grades demonstrate MD to certain degrees, and their difficulties may be more or less severe based on not only the types of screening measures but also the domains of task (e.g., calculations, fractions). Furthermore, the effects of Tier 2 interventions were not found to be moderated by implementer, indicating that Tier 2 mathematics interventions were effective across a variety of implementers. Interventions appeared to be feasibly implemented by both researchers and school personnel, a finding that is consistent with a previous meta-analysis of mathematics interventions for secondary students with MD (i.e., Jitendra et al., 2018). It is worth noting that fidelity of implementation was reported in 95% of the studies and was generally high when reported (see Table S1 in the online supplement), which might have accounted for the lack of differences in research staff and school staff or “other” implementers.
Tier 2 interventions have similar effects regardless of the severity of MD (i.e., low performance on multiple measures)
The variable related to the total hours of interventions modeled as a continuous variable had no moderating effect. Tran et al. (2011) also found no moderating effects for dosage variables (number of weeks, number of sessions) when examining student response to reading interventions. Study quality did not have a statistically significant relation with average effect sizes, perhaps because the majority of studies were RCTs of high quality (average quality index was 0.83) such that it significantly reduced variability in the quality of studies reviewed.
Study Limitations and Future Directions
There are at least three limitations to our findings. First, although we sought to search the literature base (i.e., electronic database searches, hand searching of relevant journals, exploring citations for prior meta-analyses and review articles) comprehensively, we did not search for unpublished studies (i.e., gray literature). Gray literature is, for example, sparse with a good deal of missing data, extremely hard to retrieve, or of suspect quality or has not always been used in past meta-analyses in this area given the target population of studies (see Stevens et al., 2018). At this stage of the research, our focus was on peer-reviewed findings because it is important to have some quality control and filtering of studies, which also means that there is publication bias in the sample. The impact of publication bias in education research has been documented to overestimate the size of treatment effects in the population (Polanin et al., 2016). Therefore, the next step is to extend this meta-analysis by doing a deep dive into the gray literature to reduce publication bias and increase accuracy of results. Additionally, by excluding single-case design studies, the current study may have missed key insights into nuanced and specific Tier 2 mathematics intervention approaches researched within smaller designs. Future studies should extend search procedures to include single-case design studies to further validate results.
Second, the majority of studies in the current meta-analysis were at the elementary grade level, indicating that we have a better understanding of Tier 2 interventions in those grades and less or no knowledge about the efficacy of Tier 2 interventions at the middle and high school grade levels. Consequently, the pool of studies did not allow examination of the effects of Tier 2 interventions on advanced mathematics outcomes (e.g., geometry, measurement and data, statistics and probability, algebraic expressions and equations), suggesting the need for studies with students in secondary grades and future research in the development of interventions for improving knowledge of more advanced mathematics.
Third, we did not consider including other variables, such as publication year or mathematics domain (foundational skills vs. whole numbers vs. rational numbers), in the final metaregression model. Future syntheses may include examining relationships between variables not examined in this meta-analysis as more studies of Tier 2 interventions are available.
Implications for Practice
The results of this meta-analysis demonstrated that well-designed Tier 2 interventions (e.g., explicit modeling, focus on underlying problem structure, teacher and student verbalizations, use of visual models to represent mathematical ideas, sequencing examples using a concrete-semiconcrete-abstract model, providing corrective feedback) were effective for students with MD, notwithstanding the severity of MD. Given the current educational environment that targets students for intervention based on their limited response to core instruction within an MTSS framework, the results of this meta-analysis add to our knowledge base on the efficacy of less intensive Tier 2 interventions. Across 17 years of research (i.e., 2002–2019), 39 studies investigated Tier 2 interventions. Although the intervention duration in the majority of these studies were fewer than 15 hr (38%) or between 15 and 20 hr (33%), the mean effect size reflected an average gain of a little less than half a standard deviation, suggesting that the less intensive Tier 2 interventions show promise for improving students’ mathematics performance.
Our results demonstrate that it is possible for schools and local stakeholders to improve substantially the mathematics achievement of students with MD. When it comes to specific interventions a school, teacher, or curriculum specialist should choose, our results provide some guidance. Specifically, one implication of our findings is that students with MD should receive well-designed Tier 2 interventions (e.g., problem-structure instruction) in small groups of two or three students to improve their mathematics performance.
Another implication is enhancing these students’ technical problem solving and critical thinking skills, especially in light of recent moves toward career and technical education programs to help students acquire the necessary academic skills, technical STEM (science, technology, engineering, mathematics) skills, and employability skills to succeed in postsecondary education and advance in their career in a global economy. This would require providing students with learning opportunities beyond the traditional classroom and into the world of work by making life connections. Individuals engaged in curriculum and instructional design can play an important role in helping students with MD develop these connections by scaffolding student learning.
Summary
The results of this review add to the evidence base regarding the effectiveness of mathematics intervention by specifically focusing on less intensive Tier 2 interventions to improve student mathematics outcomes. The research on Tier 2 interventions suggests Tier 2 interventions are effective for a diverse range of learners (including students with disabilities, English learners struggling in mathematics) in improving their learning in domains such as counting and cardinality, operations and algebraic thinking, fractions, ratios, and proportions. These interventions are effective for students across grade levels examined (preK through Grade 8) and can be easily implemented by different special education professionals and others concerned with promoting mathematical competence. However, how to provide the best Tier 2 interventions to students with MD at the secondary level is still unknown. The results of this review indicate the importance of increasing efforts to implement effective interventions for students with MD and designing studies that may answer the pending question of what types of interventions can improve student knowledge of more advanced mathematics.
Tier 2 interventions are effective for a diverse range of learners (including students with disabilities, English learners struggling in mathematics) in improving their learning
Supplemental Material
EC_Supplemetal_Material_Table_S1_201021 – Supplemental material for The Effects of Tier 2 Mathematics Interventions for Students With Mathematics Difficulties: A Meta-Analysis
Supplemental material, EC_Supplemetal_Material_Table_S1_201021 for The Effects of Tier 2 Mathematics Interventions for Students With Mathematics Difficulties: A Meta-Analysis by Asha K. Jitendra, Ahmed Alghamdi, Rebecca Edmunds, Nicole M. McKevett, John Mouanoutoua and Rachel Roesslein in Exceptional Children
Footnotes
References
Supplementary Material
Please find the following supplemental material available below.
For Open Access articles published under a Creative Commons License, all supplemental material carries the same license as the article it is associated with.
For non-Open Access articles published, all supplemental material carries a non-exclusive license, and permission requests for re-use of supplemental material or any part of supplemental material shall be sent directly to the copyright owner as specified in the copyright notice associated with the article.