



Abstract
Past research has established clear educational inequities between young people with disabilities and their peers. In part, some of these inequities may be attributed to expectations. In this study, we examined whether parental expectations were related to school functioning at high school, with school functioning broadly defined as ease and frequency of engagement in school-based activities. Using the Longitudinal Study of Australian Children (N = 3,956; 48.9% female; 5.01% with disability), we examined parental expectations and school functioning measured at three time-points, biennially from the ages of 12 and 13 through to 16 and 17. A multigroup, parallel latent growth curve analysis revealed that high parental expectations at the first timepoint predicted steeper increases in the trajectory of school functioning over time, but only among young people with disability. Parental expectations did not significantly predict school functioning trajectories for the remainder of the sample. Subsequent multigroup analyses that compared disability characteristics revealed that learning difficulties and speech problems, in particular, were associated with lower parental expectations. These results suggest that the perceptions of parents in the lives of young people with disability are important and efforts to shape them may have long-term benefits.
Young people with disabilities experience considerable barriers in achieving the outcomes desired by many young people. Mental ill-health, social exclusion, and financial deprivation are all disproportionally higher among both children and adults with disabilities (Emerson et al., 2017, 2020). Some young people with disabilities may experience the burden of low expectations and are more likely to be at greater risk than others for low academic performance and qualifications (Chatzitheochari & Platt, 2019). Sub-optimal school outcomes increase the likelihood of unemployment and exclusion from other roles in society (Australian Institute of Health and Welfare, 2020; Blackorby & Wagner, 1996). Identifying factors that are related to poorer academic outcomes is one step in addressing this disadvantage. The current study reports on an investigation of the association between parental educational expectations and school functioning of students between the ages of 12–13 years and 16–17 years.
School functioning is a broad assessment of how a child is faring in their educational context, tapping into issues such as absenteeism from class (Fowler et al., 1992; Tollit et al., 2018) and the capacity to keep up with homework and other academic tasks (Pedersen et al., 2019). School functioning is an important precursor to positive outcomes during adolescence as classroom struggles and absenteeism are related to both academic performance and subjective well-being (Crump et al., 2013; Leung & Leung, 1992).
A growing body of research suggests that parental expectations about educational attainment, broadly defined as the maximum level of educational attainment parents expect of their child, may be a positive predictor of school functioning (although high expectations may be detrimental when intense pressure is placed on the child, Lu et al., 2021). Parents with high expectations will often foster a home environment that promotes academic behaviors and instills a sense of mastery at school (Pinquart & Ebeling, 2020). For example, past research has found that parents with higher expectations engage in practices to promote homework completion (Domina et al., 2011) and reduce absenteeism (Kearney, 2008). Further, as children grow in home environments characterized by positive academic attitudes and behaviors, young people will subsequently learn to value and enjoy school, which further reinforces self-initiated schooling behaviors (Eccles & Wigfield, 2020).
Parental expectations are now established as an important precursor to academic success (for meta-analytic reviews see Castro et al., 2015; Pinquart & Ebeling, 2020). Yet, it is important to stress that expectations are related to—but distinct from—parental aspirations and desires. Adolescence is characterized as a time when “ideal preferences” are interpreted alongside other factors, including barriers and opportunities to realizing the initial aspiration (Blau et al., 1956; McNulty & Borgen, 1988; Musgrave, 1967). This is congruent with the notion of “adaptive preference,” where individuals alter their preferences in life to be consistent with the constraints they experience that may preclude other options (Begon, 2015). Along these lines, parents who perceive prominent social and environmental constraints may themselves adapt their expectations and aspirations for their children's academic success. Relevant to the current study, a growing literature has documented how many of the barriers associated with lower parental expectations are experienced by parents of young people with disabilities.
Parental Educational Expectations for Young People With Disabilities
For a minority of young people with disabilities, the disability itself (for example, significant intellectual disability) may be a limiting factor for academic progress (Bouck & Satsangi, 2015). However, the expectations of all parents of children with disabilities might be lower than the expectations of parents of children without disabilities. Young people with disabilities can experience stigma and discrimination in educational settings, not least from educators (Shifrer, 2013). Further, some parents of young people with disabilities report considerable concerns about their capacity to offer care and support (Russell, 2003), peer relations at school (Lee et al., 2008), future employment options (Blustein et al., 2016; Griffin et al., 2010), and concerns about discrimination in the educational system (Chatzitheochari & Platt, 2019). Indeed, many parents can become frustrated by their experiences navigating the education system, or have experienced situations where schools were unresponsive to their needs and concerns (Robinson, 2018). Collectively, these experiences may serve as barriers that ultimately lower educational expectations—an assertion that a growing literature has begun to emphasize (e.g., Bouck et al., 2020; Hirano & Rowe, 2016; Masino & Hodapp, 1996).
Previous studies have demonstrated important differences in parental educational expectations among adolescents with and without disabilities (Doren et al., 2012; McCoy et al., 2016) even when young people were matched on behavioral and academic performances (Shifrer, 2013). Several other studies have examined differences in parental expectations across different types of impairments associated with disability and the subsequent association between expectations and academic outcomes. For example, Cawthon and Caemmerer (2014) found parental expectations were substantially lower for young people with multiple disabilities, and intellectual disabilities have been associated with lower parental expectations relative to other forms of disability (Doren et al., 2012; McCoy et al., 2016).
Some of these studies have evaluated the factors that may contribute to lower parental expectations among young people with disabilities. A large and extensive literature has demonstrated that family socioeconomic status and school resources are robust predictors of parental expectations (e.g., Tan et al., 2020; Yamamoto & Holloway, 2010). Higher socioeconomic status families are likely to perceive fewer barriers to higher education and are more likely to develop, gain access to, and retain educational opportunities for their children (Andres et al., 2007). More affluent families also have the means to invest in educational activities and resources for their child and may develop higher expectations due to the resources they have allocated (Kim et al., 2013). Unsurprisingly, then, studies focused on the parental expectations of caregivers for young people with disabilities have also found that socioeconomic status is an important predictor of parental expectations (Blackorby & Wagner, 1996; Kirby, 2016; Masino & Hodapp, 1996; Newman, 2005).
While the antecedents and outcomes of parental expectations for young people with disabilities are now quite well covered in the literature, there is a striking lack of longitudinal investigations on how expectations develop and change over time.
Modelling trajectories of change over time will facilitate capturing the changes in young people's school functioning as they move through the education system. Trajectories of change also provide an opportunity to model the rate of change over time. Some young people will experience accelerated rates of (positive or negative) change in the outcome variable over time, characterized by steeper increases or decreases. In the current study, we will explore how parental expectations predict trajectories of school functioning from the age of 12 to 17.
The Current Study
Parental expectations for educational attainment are significantly related to a child's academic performance and behaviors (Castro et al., 2015). Some research suggests that expectations tend to be substantially lower among parents of young people with disabilities. However, most of these studies have examined effects on academic achievement. To date, scholars are yet to consider the role of expectations in shaping school functioning either cross-sectionally or longitudinally. In the current study, we modelled latent trajectories of school functioning and parental expectations to determine if and how these constructs change over time. Academic performance is an important educational outcome, but young people's day-to-day school functioning is linked to both academic performance and mental health outcomes (Threlfall et al., 2017). This suggests the need to further understand school functioning as an important component of young peoples’ lives during years of mandatory school attendance.
Latent growth curve models estimate an intercept (starting point) and trajectory (the rate of change over time). In a nationally representative sample of Australian youth, we will model latent growth curve models measured at three timepoints from the ages of 12 and 13, through to 16 and 17. We hypothesize that steeper increases in the trajectories of school functioning (slope) over time will emerge for participants whose parental expectations are higher at the first timepoint (i.e., intercept). However, we also anticipate differences between participants with and without disabilities. Accordingly, we will conduct a multigroup model to specifically explore whether disability status moderates the association between parental expectations and school functioning. School functioning is an indicator of participants’ day-to-day functioning at school. As such, it is likely that, for the majority of the sample, school functioning will start from a high base and not increase over time (although it may decrease). In contrast, we hypothesize that young people with disabilities will have lower intercepts of parental expectations and school functioning at the ages of 12 and 13 relative to the remainder of the sample. This suggests greater room for parental expectations to positively influence trajectories in school functioning.
We will also evaluate whether educational expectations differ depending upon disability characteristics. In line with previous research, we expect that young people with impairments associated with learning are likely to have lower parental expectations (e.g., McCoy et al., 2016). Finally, socioeconomic status will be included in the model as a predictor of educational expectations. We anticipate that our indicators of socioeconomic status will significantly predict educational expectations, whereby individuals from families who experience fewer financial hardships and are of higher socioeconomic status will have higher parental expectations. Likewise, the parents of youth attending more advantaged schools are also expected to report greater expectations. Additional exploratory analyses will then be conducted to determine if associations between socioeconomic status and educational expectations are similar for youth with and without disabilities.
Method
Participants and Procedure
The current study utilized data from the Longitudinal Study of Australian Children (LSAC; K cohort). The first wave of data collection occurred in 2004 with the recruitment of 4- and 5-year-olds who were selected from a government-managed database that has over 96% of Australian births recorded (Sanson et al., 2002 ). Surveys were conducted longitudinally, every 2 years. The current study utilizes the data available when participants transitioned to adolescence and secondary school. Accordingly, we analyzed data from the fifth (T1, N = 3,956) 6th (T2, N = 3,526), and seventh (T3, N = 3,048) time-points. At the first time-point, the sample consisted of 12 and 13-year-olds (M = 12.41, SD = 0.49) and there was an approximately equal distribution of males (51.1%) and females (48%). Although the data collection methods varied across the years, in-home interviews and computer-assisted self-interviews were conducted with parents/carers, teachers, and the child participants. Information about the study's methodology and a depository of research output are available online (https://growingupinaustralia.gov.au/). Registered researchers can apply for access to data via a permanent online data depository (https://doi.org/10.26193/BAA3N6). Ethical approval for this project, entitled Wellbeing in Adolescence, was granted by the Social and Behavioral Research Ethics Committee at Flinders University in Adelaide, Australia.
Measures
Disability Status and Characteristics
The primary caregiver was asked a single, dichotomous question to determine disability status (Does the child have any medical conditions or disabilities that have lasted, or are likely to last, for 6 months or more?). Overall, 180 children were nominated as having an ongoing disability at the age of 12 or 13 using this question. The caregivers (99% biological parents, 94.3% female) were also asked about the characteristics of these health concerns. The most common issues included speech problems (23.9%) and learning difficulties (55.6%). Many young people with disabilities were also said to have physical impairments, including limited use of arms or fingers (3.9%), difficulty gripping (3.3%), limited use of legs or feet (7.2%), or other physical conditions (17.2%). Due to their similarity, participants who had any of these conditions were said to have a physical disability (23.3%). Other subgroups of impairment had low sample sizes (N < 30), including vision impairment (10%), hearing impairment (13.3%), blackouts (3.3%), facial or body difference (4.4%), mental illnesses (10.6%), chronic pain (1.7%), and head injuries (1.1%). Due to the low number of participants in these subgroups, we did not conduct specific subgroup analyses that compared these participants to the remainder of young people with disabilities. However, they were still retained in the main analyses as part of the group with disabilities and were included in the reference group when specifically comparing young people with physical impairments, learning difficulties, and speech problems, to other young people with disabilities without those specific concerns.
Parental Educational Expectations
A single item was used to measure parental expectations (Looking ahead, how far do you think [study child] will go in his/her education?). Parents responded on a 5-point scale (from 1 = Leave school before finishing secondary school to 5 = Obtain post-graduate qualifications at a university).
School Functioning
School functioning was measured using the 5-item subscale of the widely validated Pediatric Quality of Life Inventory (Varni et al., 1999). Parents were asked questions related to their child's capacity to engage in academic activities (e.g., Problems paying attention in class) and the extent to which their child misses school (e.g., Problems missing school due to illness). Responses were recorded on a 5-point scale ranging from 1 = never to 5 = almost always. Following a preliminary confirmatory factor analysis (available in the online supplementary materials), only the items related to academic activities were included in the current study (as listed in Figure 1). These items were found to be reliable across time based upon omega (McNeish, 2018) computed using the approach outlined by Hayes and Coutts (2020; ωT1 = .85; ωT2 = .86; ωT3 = .84).

The Parallel Curve of Factors Model Exploring the Longitudinal Relationship Between Parental Educational Expectations and School Functioning Over Time (N = 3,050).
Socioeconomic Factors
Two different indicators of socioeconomic status were included in the current study. First, family socioeconomic status was measured using an indicator derived by the LSAC project team (Baker et al., 2017 ). Indicators of family structure, parental income, occupational prestige and parental education were aggregated into a single socioeconomic position index, with each family unit ranked to allow comparison across the sample. Second, the school-level Index of Community Socio-Educational Advantage (ICSEA; Australian Curriculum, Assessment & Reporting Authority, 2010 ), based on average parental occupation and education for each school, was included as a standardized indicator (M = 1.00, SD = 0.10). A measure of financial hardship was also included in the study as an indicator of family deprivation. Participants’ parents were asked if they had experienced six different events in the previous 12 months (e.g., Sought assistance from a welfare or community organization; 0 = no, 1 = yes), with the six items summed to form a total financial hardship score.
Covariates
Age in years and gender were controlled for in the analyses. Due to evidence that individuals residing in regional areas have lower educational expectations (e.g., Kilpatrick et al., 2019), whether respondents lived in a large city was also controlled for. Finally, we controlled for teacher educational expectations using a general indicator of the students they taught. The single item asked for agreement with the statement “I have high expectations for the academic success of my students” on a 5-point scale (1 = strongly agree to 5 = strongly disagree).
Analytical Strategy
Bivariate correlations and descriptive statistics were inspected as an initial step. Next, we fit a series of latent growth models using a structural equation modeling framework (Wickrama et al., 2016; see the online supplementary materials for the full model building process). Model fit was evaluated using the recommendations of Hu and Bentler (1999). First, an unconditional latent means model (UMM) was estimated for parental expectations. Parental expectations at each timepoint were included as observed indicators of a latent intercept score (i.e., an intercept-only model). By constraining each of the factor loadings to be 1, the UMM constrains the rate of change over time to be 0. Next, an unconditional latent growth curve model (LGC) was estimated that accounted for linear growth in parental educations over time via a second latent variable with factor loadings of 0, 2, and 4 for the three time-points collected at 2-year intervals (see Figure 1). Using this approach, the intercept now corresponds to when the slope factor was 0. Thus, the intercept represents parents’ educational expectations at the first time-point in the current study, and the slope represents the magnitude and direction of change from that baseline over time.
A similar approach was used to model school functioning. However, the use of manifest, aggregated scale scores assume measurement invariance and equal factor loadings; these assumptions are rarely met (Bishop et al., 2015). An underutilized solution to this problem involves the estimation of the curve of factors model (CUFFS, Geiser et al., 2013; Isiordia & Ferrer, 2018). The CUFFS is conceptually similar to the standard latent growth curve model but is practically distinct due to the estimation of growth factors using latent scores. Accordingly, we initially modelled the factor structure of school functioning across time. Latent variables were scaled using the marker method and tests of measurement invariance were conducted using two commonly implemented approaches: nested chi-square comparisons and CFI difference scores (see online supplementary materials for the full model building process). Next, we conducted and compared unconditional means models and unconditional growth models.
After selecting the optimal solution for both parental expectations and school functioning, we conducted a parallel growth curve model (Figure 1; Jung & Wickrama, 2008 ; Wickrama et al., 2016). Continuous covariates were grand mean centered. Here, the slopes of educational expectations and school functioning were covaried. A significant covariation suggests that rates of change in one variable is associated with the rate of change in the other. Further, the intercepts were entered as predictor variables of the slopes. Controlling for the intercept of a latent trajectory ensures that initial between-person differences are accounted for. A significant relationship between the intercept of one construct and the slope of another provides important information about the temporal precedence: Starting levels of one variable predict the rate another variable changes in the future.
Next, we conducted a multi-group latent growth curve to determine if the average intercept or slope of each construct varied depending upon disability status. In this analysis, the residual variance of the slope of parental expectations was negative for the group of young people with a disability. As the variance was small and not significant, we allowed the error term to be freely estimated and interpreted the unrestricted model in text. In an alternative sensitivity test, we constrained the residual term to be 0. The direction and significance of all model coefficients were replicated.
Corrected chi-square difference tests were used to specifically compare the relationship between the intercept of parental expectations on the slope of school functioning in the two groups of participants, as per our hypotheses (i.e., does constraining the effect to be consistent across groups significantly improve or worsen the model?). Accordingly, these analyses tested whether disability status moderated the relationship between parental expectations and school functioning. As a final step of the analysis, we focused our attention on the participants with disabilities. In this subsample of participants, we used independent sample t tests to examine whether initial levels of parental expectations and school functioning differed depending upon specific disability characteristics.
As participants were recruited from a geographically stratified national database, 2,983 participants (75.40%) attended a school with at least one other participant. Thus, all models were estimated using a sandwich estimator to account for the clustering of multiple participants within specific schools in Mplus (Version 8.4; Muthén & Muthén, 2017). Missing data was addressed using full information maximum likelihood (FIML) which is appropriate when the data is either missing at random or missing completely at random (Enders & Bandalos, 2001). A weighting variable was included to ensure the sample remained nationally representative.
Results
Bivariate Correlations and Descriptive Statistics
An examination of the bivariate correlations (Table 1) indicates that school functioning and parental expectations were significantly and positively correlated across all time points. Further, parents reported significantly higher perceptions of their daughters’ school functioning and future educational attainment, relative to the parents of sons. Young people who reside in regional locations experience financial deprivation, and those with disabilities had significantly lower parental expectations and school functioning across adolescence. With respect to disability status, there were more males than females with a disability in the current study, and families caring for young people with disabilities were more likely to report financial hardship and enroll their children in more disadvantaged schools.
Descriptive Statistics and Bivariate Correlations Between School Functioning, Parental Expectations, and the Covariates.
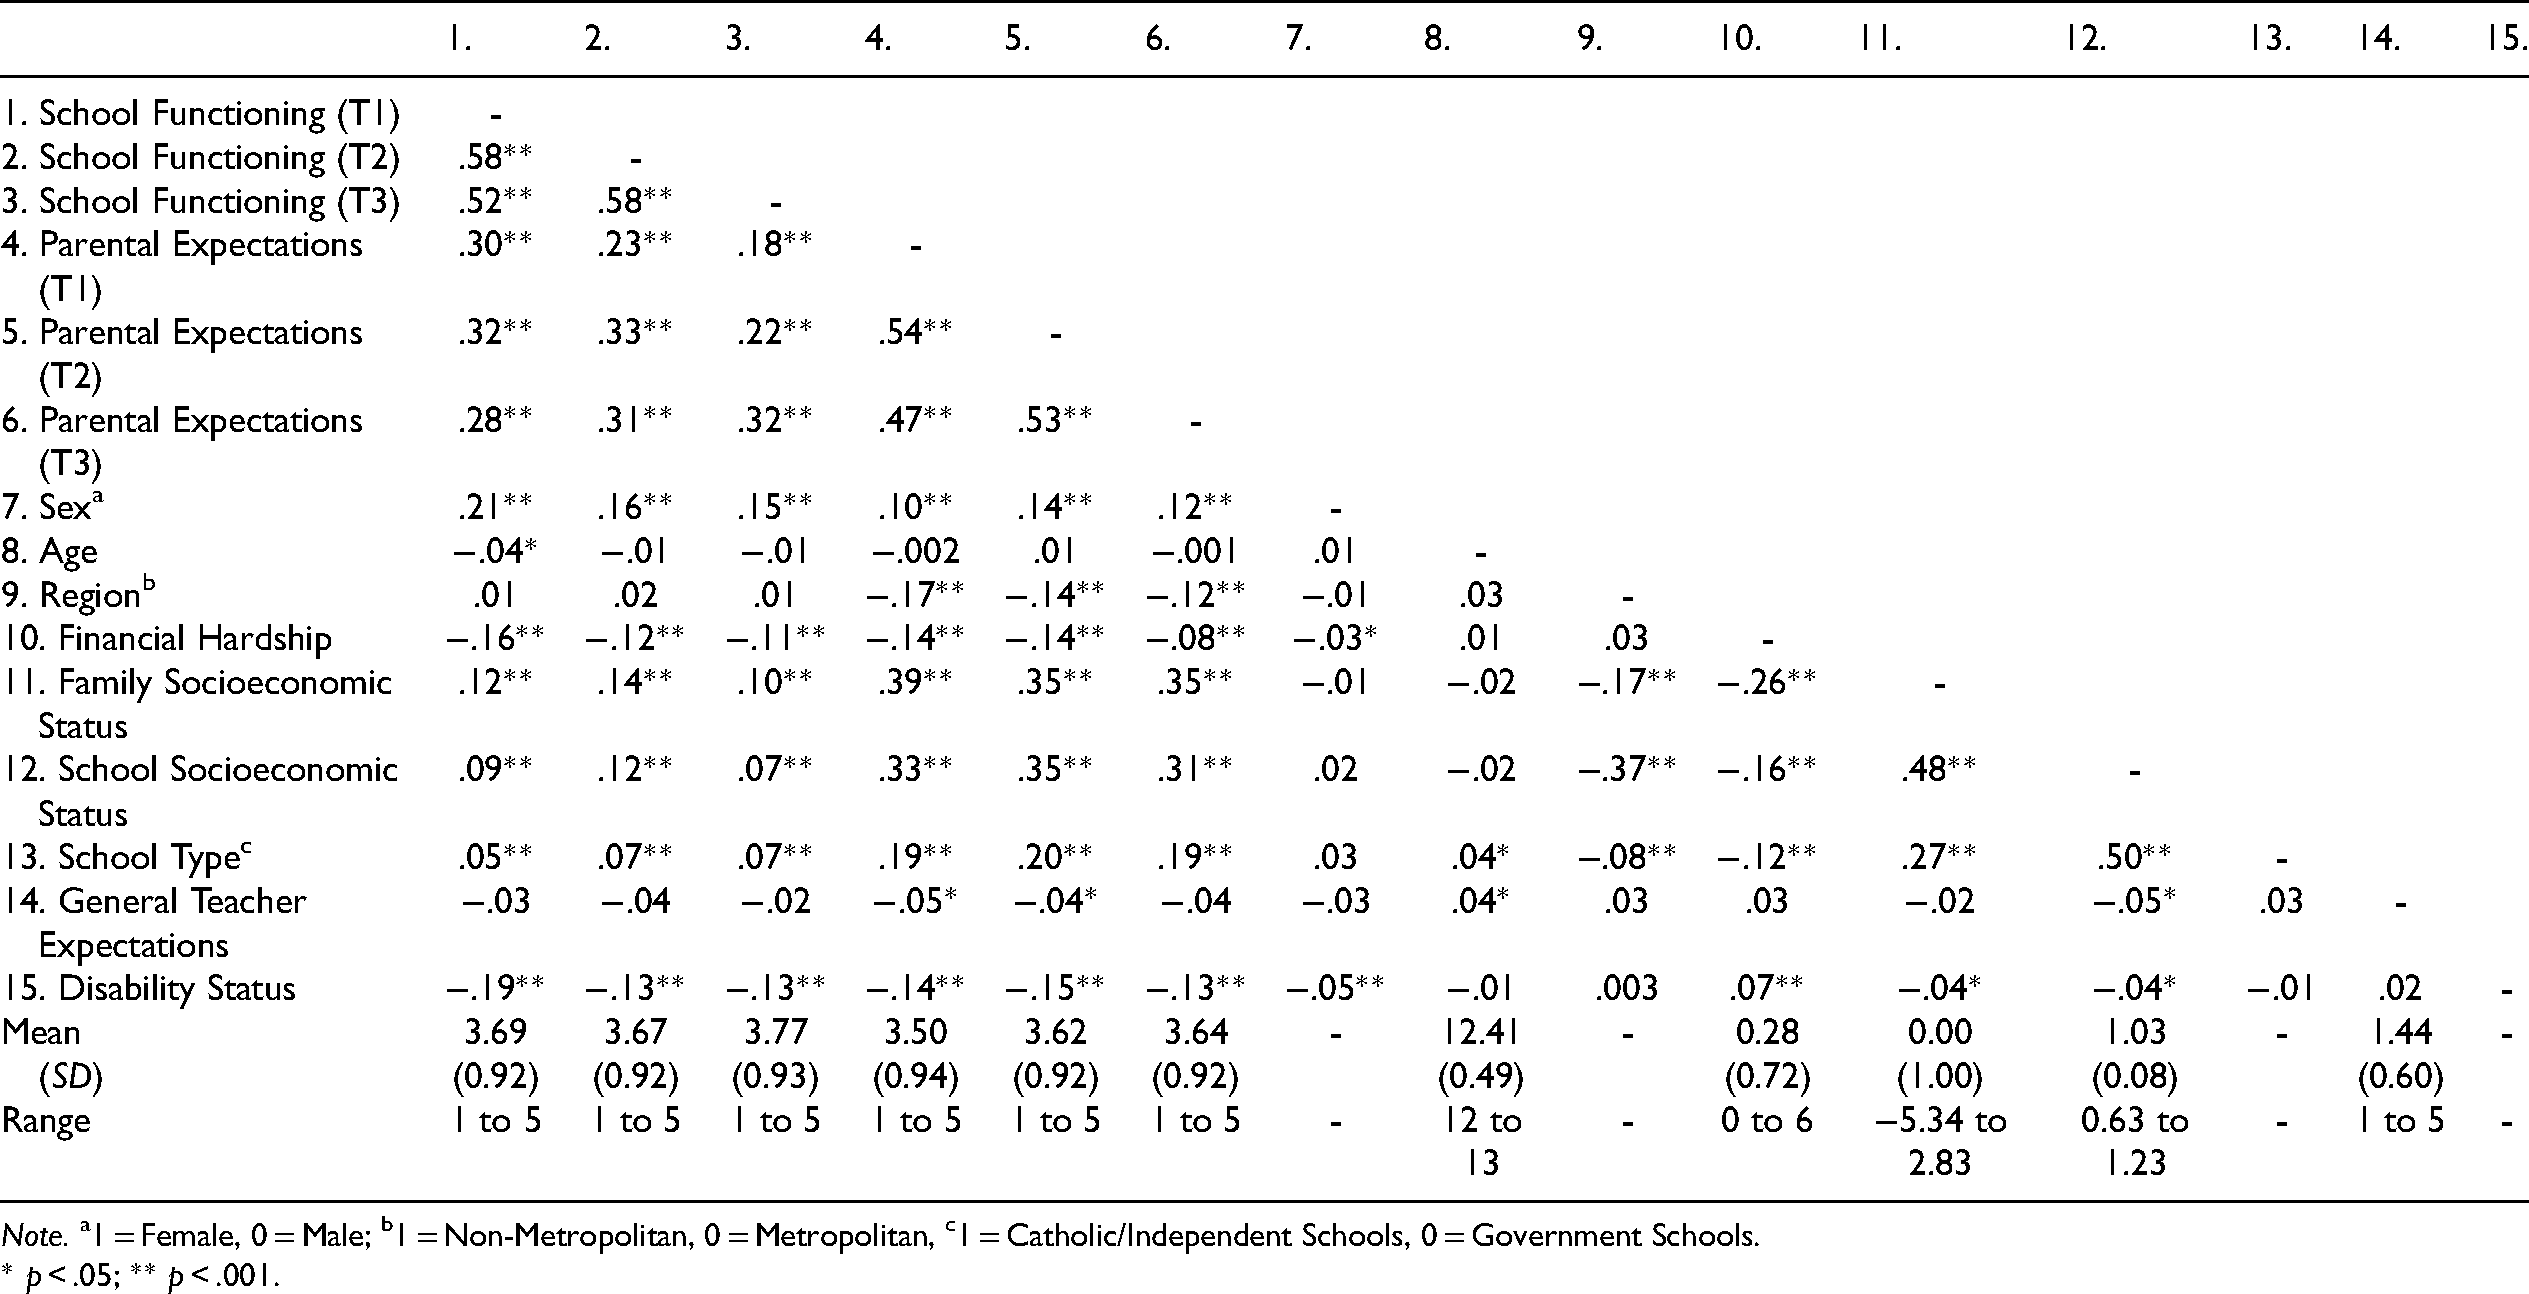
Note. a1 = Female, 0 = Male; b1 = Non-Metropolitan, 0 = Metropolitan, c1 = Catholic/Independent Schools, 0 = Government Schools.
* p < .05; ** p < .001.
Trajectories of Parental Educational Expectations
Following a series of model comparisons, we modelled a latent growth curve model with a linear slope and heterogenous residuals, χ2 (1) = 13.86, p < .001; RMSEA = .06; SRMR = .02; CFI = .99. On average, parental expectations at the first time point indicated that the majority of parents expected their children to finish high school and move onto vocational or tertiary education (intercept = 3.47, p < .001). Over time, these expectations increased slightly (slope = .03, p = .002), especially among participants who had lower parental expectations intercept (as denoted by the significant negative correlation between the intercept and slope, φ = −.27, p < .001). Subsequently, we examined whether the starting point and trajectories of change differed depending upon disability status by conducting a multigroup model with specific comparisons (Figure 2). In the freely estimated multigroup model, the intercept and slope had a correlation greater than 1 in the group of young people with disabilities. However, the variance of the slope factor was practically 0 (variance = 0.001, p = .965). Constraining the variance to be 0 did not significantly change the model fit, χ2 (2) = 4.67, p = .097. Thus, subsequent unconditional explorations of parental educational expectations employed a constraint on the slope factor in the group of young people with disabilities.

Unconditional Latent Trajectories of Parental Expectations and School Functioning Across Adolescence for Young People With and Without a Disability.
Using a series of nested chi-square comparisons, we found that the average intercept of educational expectations between young people with disabilities (intercept = 2.84) was significantly lower than the remainder of the sample (intercept = 3.50; χ2 (1) = 71.05, p < .001). However, the slopes were statistically equivalent (χ2 (1) = 0.79, p = .374).
Trajectories of School Functioning
Next, we tested growth in school functioning over time. Our tests of longitudinal measurement invariance (available in the supplementary materials online) established evidence for partial strong invariance that was then included in subsequent latent growth curve models. The inclusion of a linear slope with constrained residual variances provided the best model fit, χ2 (30) = 258.14, p < .001; RMSEA = .05; SRMR = .05; CFI = .97. Using this approach, we found that participants’ school functioning was reasonably high (intercept = 3.63, p < .001) and increased significantly over time (slope = 0.4, p < .001). However, the slope of school functioning was uncorrelated to participants’ starting levels (φ = −.01, p = .530). In a subsequent multigroup model we examined trajectories of school functioning by disability status (Figure 2). Comparisons between the two groups suggested that the average intercept (χ2 (1) = 74.65, p < .001) and slope (χ2 (1) = 8.68, p < .001) differed between the two groups, whereby young people with a disability had significantly lower school functioning at the age of 12 (intercept = 2.80, p < .001), but increased significantly over time (slope = .11, p < .001). In contrast, the school functioning of the remainder of the sample started higher (intercept = 3.69, p < .001) and had a more gradual growth (slope = 0.03, p < .001) relative to the young people with a disability (Figure 2).
Parallel Latent Growth Curve
At the next stage of the analysis, a parallel growth curve model was conducted with the full sample (Figure 1, Table 2), χ2 (119) = 608.60, p < .001; RMSEA = .04; SRMR = .05; CFI = .96. In this analysis, participants with higher parental expectations at the first time-point demonstrated a slight decline over time (likely attributable to a ceiling effect). However, there were significant longitudinal effects. Parents who rated their child's school functioning higher at the age of 12 or 13 had significant increases in their expectations over time. In contrast, the intercept of parental expectations was not a significant predictor of school functioning trajectories (Table 2). Thus, parents’ assessment of their child's school functioning longitudinally predicted their expectations, but expectations did not predict trajectories of school functioning in the full sample.
Parallel Latent Growth Curve Model Analyzing the Predictors of Parental Expectations and School Functioning Trajectories

Note. a1 = female, 0 = male; b1 = non-metropolitan, 0 = metropolitan, c1 = Catholic/independent schools, 0 = government schools.
* p < .05; ** p < .001
Note. slopes were significantly covaried (β = 0.39, p = .005)
Predictors of Parental Expectations and School Functioning
Family and school resources were related to expectations and school functioning. Parents reporting fewer financial hardships, higher socioeconomic status, and whose children attended more socially and educationally advantaged schools also reported higher expectations for their child. Furthermore, examination of covariates suggested that females, older children, and those residing in a metropolitan community enjoyed higher educational expectations and functioning at the first time-point. Generally, these factors were not found to predict trajectories of change, apart from family socioeconomic status which predicted future increases in educational expectations.
The Moderating Role of Disability Status
Next, we conducted a multigroup analysis comparing young people with and without a disability. Corrected chi-square difference tests found that the relationship between the intercept of parental expectations and the slope of school functioning was significantly different across the two groups (χ2 (1) = 20.92, p = .001).
From these comparisons, it was evident that the relationship between parental expectations and school functioning was substantially stronger in the group of young people with disabilities (Figure 3).
However, the same relationship was not statistically significant for the other participants. In comparison, the relationship between the intercept of school functioning and the slope of parental expectations was not significantly different across the two groups (χ2 (1) = 0.04, p = .845).

The Multigroup Parallel Curve of Factors Model Exploring the Longitudinal Relationship Between Parental Educational Expectations and School Functioning for Participations With (N = 136) and Without (N = 2,914) Disabilities.
Additional model comparisons showed that the relationship between the intercept of parental expectations and school socioeconomic status (χ2 (1) = 1.20, p = .273), family socioeconomic status (χ2 (1) = 0.40, p = .522), and financial hardships (χ2 (1) = 0.27, p = .601) did not differ significantly by disability status, indicating that socioeconomic status had a similar effect on parental expectations regardless of young people's disabilities.
Differences by Disability Characteristics
As a final step of the analyses, we conducted a series of comparisons to determine if disability characteristics predicted parental expectations and school functioning. Independent sample t tests (Table 3) suggested that parental expectations were lower for young people with disabilities who were identified by their parent as having learning difficulties or speech difficulties. In contrast, parental expectations were higher for those with physical disabilities relative to the other young people with disabilities.
Differences in Parental Expectations and School Functioning Depending Upon Disability Characteristics.

Note. School functioning was an observed variable, derived from the average of the three items included in the main analyses. YPWD = Young People with Disabilities.
* p < .05; ** p < .001
Discussion
Past research suggests that parental educational expectations may be one important precursor to academic performance, especially for young people with disabilities (Doren et al., 2012). The aim of the current study was to examine how parental expectations at the onset of adolescence predicted subsequent trajectories of school functioning. The results largely confirmed our hypotheses and illustrate how higher parental expectations are associated with long-term improvements in school functioning among young people with disabilities, and how specific disability characteristics and socioeconomic status are important precursors to educational expectations.
Our analyses suggests that young people with disabilities enter secondary education with substantially lower school functioning compared to other young people. However, in line with our hypotheses, we also observed significant increases in school functioning over time for young people with disabilities. These increases served to reduce (albeit not eliminate) the impact of living with a disability as our participants progressed through high school. Modelling average levels of change provided important information on the nature of educational inequities over time. However, our analytical approach also provided an opportunity to examine between-person differences in growth trajectories and the factors that may alter the speed or direction of growth over time.
Multigroup models demonstrated how disability status moderates the relationship between parental expectations and school functioning. School functioning was mostly high among young people without a disability. In contrast, young people with disabilities started secondary education at a distinct educational disadvantage that was lessened over time—especially among students with higher parental expectations. These results suggest the potential of identifying factors associated with parental expectations for young people with disabilities. We discuss these next.
Predictors of Parental Educational Expectations
The findings of the current study are congruent with a large literature demonstrating how socioeconomic status is related to parental expectations (Kim et al., 2013; Tan et al., 2020). It was therefore unsurprising that caregivers from higher socioeconomic status families had higher educational expectations at the age of 12 or 13 regardless of disability status. While the relationship between socioeconomic factors and parental expectations was statistically equivalent for the groups of young people with and without a disability, there was also a strong negative correlation between disability status and socioeconomic status. People with a disability have a higher probability of living in poverty than other people (OECD, n.d.), which may introduce constraints and barriers towards educational attainment that may partially explain the lower parental expectations for this group of young people.
We also noted how educational expectations differed depending upon disability characteristics. Akin to previous research (e.g., Doren et al., 2012), young people with learning difficulties (approximately half of the young people with disabilities in the current study) were likely to have lower parental expectations. The analyses also suggested that speech difficulties were associated with lower parental expectations and a physical condition was associated with higher parental expectations. Teachers play an important role in shaping how a young person responds to their schooling environment (Arciuli et al., 2019), but learning difficulties (Shifrer, 2016) and speech impairments (Lass et al., 1994) are highly stigmatized among some educators. Given the strong relationship between teacher and parental expectations (Benner & Mistry, 2007 ), it is possible that stigmatization by teachers could reduce parental expectations via feedback (Mistry et al., 2009). However, stigmatizing perceptions are in direct contrast to the aspirations and life goals of many young people with these disability characteristics. For example, past qualitative and quantitative research has demonstrated how transitioning to higher education and employment is an empowering move towards independence and adulthood that many young people with learning difficulties aspire to and succeed in (Prohn et al., 2018; MacIntyre, 2014). Yet, moves in this direction are often met with increased barriers with respect to post-school education and employment (Denhart, 2008). Many postsecondary education institutions are now offering opportunities to engage in standard coursework while providing services that align with students’ needs and choices (Rillotta et al., 2020). Efforts like these should be more readily promoted so that parents can envision ongoing educational opportunities as a feasible and desirable option in their child's future.
Implications for Social and Educational Policy
Given the established relationship between socioeconomic factors and parental expectations, social policies that provide financial security to families with young people with disabilities may serve to improve their educational success.
Research suggests that boosted household income has a positive impact on school results and maternal factors (Cooper & Stewart, 2021), suggesting programs that increase the financial security of families caring for a young person with a disability may positively influence parental expectations and subsequent school functioning.
Beyond financial supports, schools and educators should be properly provisioned to respond to the needs of young people with disabilities and their families, whether those needs relate to feelings of safety (Robinson, 2018), discrimination (Chatzitheochari & Platt, 2019), or preparation for post-secondary education or work (Children and Young People with Disability Australia, 2019). Given the longitudinal association between parental expectations and school functioning observed in the current study, practices and policies that increase expectations on policy makers and whole-school communities could have long lasting benefits and require further research and consideration.
Strengths and Limitations of the Current Study
The results of the current study may be important for ameliorating educational disadvantages for young people with disabilities. However, the study has limitations. Most notably, our data did not provide a fine-grained examination of disability status or type. Congruent with many other large scale nationally representative studies (e.g., Shahtahmasebi et al., 2011), the measure of disability in the current study documented ongoing health complaints and impairment types. Given the low percentage of participants who were identified as a young person with disabilities in the study's sample, it is highly unlikely that we captured the full diversity of experiences in our measures or sample. For these reasons, we do not claim to generalize our findings to every young person with disabilities.
In this study, the intercept of school functioning was used as a predictor of subsequent linear trajectories of change. Accordingly, we could conclude that higher parental expectations at the first time-point predicted subsequent increases in school functioning among young people with disabilities. However, the estimation of a linear slope prohibits the disentanglement of the timing and nature of change over time. Studies with additional measurement and more frequent points are needed to better capture changes in schooling outcomes among young people with disabilities.
Further, we cannot make any conclusions regarding the processes that occurred prior to the ages of 12 and 13 that may have contributed to higher parental expectations. For example, past research has established that positive interactions between parents and teachers can increase expectations (e.g., Mistry et al., 2009) and financial disadvantage can decrease expectations (e.g., Tan et al., 2020). Irrespective of the myriad of related factors contributing to higher parental expectations at the ages of 12 and 13, statistically controlling for the intercept ensures that the significant longitudinal effects in the current study were evident over and beyond any initial differences that may have occurred. Future research should unpack the influencing factors that emerge before this time.
A third limitation in the current study is that we have not directly considered young people's own experiences. Both measures of expectations and school functioning were reported from the parents’ perspective. As a major socialization context for young people, parents are known to influence the future welfare of young people and have a unique understanding of their issues and concerns. Parent reports of academic indicators are therefore valid and widely used in research (e.g., Waters et al., 2000). However, past research has shown that high levels of communication difficulties and disability severity can adversely impact parent-child agreement on measures (Kaat & Lecavalier, 2015). Further, we acknowledge the need to represent the voices of young people with disabilities to ensure that their perspectives are respected and represented in research. Future work using co-creative designs may be one avenue that scholars can use to advance this research.
Conclusion
Young people with disabilities often experience barriers in school that contribute to lifelong disadvantages in employment, income, and independence. In the current study, we found that higher educational expectations by parents can contribute to increasing school functioning over time. This effect was especially strong for young people with disabilities and occurred when controlling for initial levels of school functioning, economic position, and general teacher expectations. Many prominent factors, including financial hardships and perceived barriers to educational attainment, may contribute to lower parental expectations. Yet, our data suggests that efforts to address these risks may help young people with disabilities thrive in a schooling context, ultimately increasing the life chances of a group of young people who are routinely excluded.
Footnotes
Acknowledgments
The research undertaken for this paper was supported by the Australian Research Council (Project DP190100247). The Longitudinal Study of Australian is conducted by the Australian Institute of Family Studies with the Department of Social Services. The findings and views reported in this paper, however, are those of the authors and should not be attributed to the Australian Government, DSS, or any of DSS’ contractors or partners. We thank all of those involved, including participants and their families, for developing the study.
Declaration of Conflicting Interests
The authors declared no potential conflicts of interest with respect to the research, authorship, and/or publication of this article.
Funding
The authors disclosed receipt of the following financial support for the research, authorship, and/or publication of this article: This work was supported by the Australian Research Council, (grant number DP190100247).Manuscript received July 2021; accepted February 2022.

Supplemental Material
Supplemental material for this article is available online.
References
Supplementary Material
Please find the following supplemental material available below.
For Open Access articles published under a Creative Commons License, all supplemental material carries the same license as the article it is associated with.
For non-Open Access articles published, all supplemental material carries a non-exclusive license, and permission requests for re-use of supplemental material or any part of supplemental material shall be sent directly to the copyright owner as specified in the copyright notice associated with the article.
