
Abstract
There is growing evidence that school starting age impacts children's likelihood of receiving special education services, but less is known about variations in this effect. Using a regression discontinuity design, I found that the youngest students in a kindergarten cohort are 40% more likely (p < .001) to be placed in special education than are the oldest students, and that this effect persists through eighth grade. I found little evidence of heterogeneity by gender, race, or socioeconomic status, but some suggestive evidence that the effect is particularly great for White boys in early grades and for Black girls in the later elementary grades. I also found exploratory evidence that this effect is largest in schools with kindergarten cohorts that vary widely in age. These findings add new evidence to support policies to reduce age-induced bias in early special education placements, particularly those that address variation in this effect across students and schools.
There is considerable variation across schools, school districts, and states, in the number of students receiving special education services in the United States and in the characteristics of those students (National Center for Education Statistics, 2007, 2017). For example, there are well-documented racial, socioeconomic, and gender differences in special education rates, although researchers disagree on whether these patterns indicate an over-placement or under-placement of minoritized students (Grindal et al., 2019; Hibel et al., 2010; Jacob, 2005; Morgan et al., 2015; Skiba et al., 2006; Sullivan & Bal, 2013). Even among those placed in special education, disability classifications and placements types also vary by race and ethnicity, further suggesting variation in how disability is perceived, classified, and supported in school settings (Grindal et al., 2019; Hosp & Reschly, 2003).
There is also evidence that the age at which children begin school can change the likelihood that a child is placed in special education (Dhuey & Lipscomb, 2010; Dhuey et al., 2019) or diagnosed with Attention Deficit/Hyperactivity Disorder (ADHD; Elder, 2010; Krabbe et al., 2014; Layton et al., 2018; Schwandt & Wuppermann, 2016). This large body of work provides consistent evidence that the youngest students in a grade cohort are more likely to receive both ADHD diagnoses and special education placements than are the oldest students. Special education placement rates are also highest for the youngest boys in the early grades (Dhuey & Lipscomb, 2010; Dhuey et al., 2019). Surprisingly, there is little evidence of heterogeneity in the effect of being young for grade on special education placement by race or socioeconomic status. Further, less attention has been paid to exploring the timing of the effect of age on special education identification, duration of placements for the youngest students, and potential underlying mechanisms that have been the focus of much of the literature on subjectivity and variation in special education placements. Identifying sources of variation in special education placement driven by student demographic characteristics is important both from an efficiency perspective (i.e., are special education resources allocated to the students who need them?) and from an equity perspective, given the recent evidence that special education services benefit children who receive them (Ballis & Heath, 2021; Hanushek et al., 2002; Hurwitz et al., 2020; Schwartz et al., 2021).
The present study bridges the age at time of school entry literature and the evidence base on subjectivity in special education placement, making several contributions to both bodies of work. First, using state-level longitudinal data from Michigan for 10 cohorts of entering kindergarten students, I used a regression discontinuity design that exploits exogeneous variation in school starting age generated by the state's kindergarten entrance policy to estimate the effect of being the youngest student in a kindergarten cohort on the likelihood of being placed in special education in kindergarten through eigth grade. The findings build on prior evidence from Florida, evaluating the extent to which those earlier findings are replicable in a state with different special education policies and disability diagnostic approaches, student demographics, and kindergarten entry cutoff dates (Dhuey et al., 2019).
Second, prior analyses have reported effects of age-in-grade on the likelihood of ever being placed in special education over a period of many years. However, less is known about whether the effect of age-in-grade is concentrated in the early years or consistent across years. I expand on prior literature by estimating the effect of school entry age year-by-year through middle school, as well as the effect of age on exiting from services and on reentering services after exit. My findings suggest a persistent age effect starting in kindergarten, with little evidence of compensating higher placement rates for older students in later grades. Similarly, I found that the youngest students who are placed in special education in the early grades are both more likely to exit from services in later grades and to reenter services.
Third, I expand on prior work that has estimated the effect of school starting age on special education by gender, race/ethnicity, and socioeconomic status by also estimating within-race heterogeneity by gender. These analyses build on prior work in the special education literature identifying disparities in special education placement at the intersection of race and gender (Coutinho et al., 2002). Finally, I also provide evidence that the effect of school starting age on special education identification is concentrated in classrooms with wide age ranges, suggesting that peer comparisons may be a driver of the school entry age effect.
Background
Much of the evidence that school starting age impacts disability diagnoses comes from the large body of literature on Attention Deficit/Hyperactivity Disorder (ADHD) diagnoses. The youngest children in a grade cohort are 2 to 5 percentage points (22%–30%) more likely to be diagnosed with ADHD (Elder, 2010; Evans et al, 2010; Krabbe et al, 2014; Layton et al, 2018; Ma et al., 2012; Schwandt & Wuppermann, 2016). However, these findings may not be applicable to special education placements under the Individuals with Disabilities in Education Act (IDEA) because the ADHD literature has focused on outcomes such as clinical diagnosis or stimulant prescriptions rather than educational placements. In contrast, most disability eligibility classifications under IDEA do not require that a child have a clinical diagnosis (IDEA, 2004; MacFarlane & Kanaya, 2009; National Research Council, 1997). Special education also covers many types of developmental, physical, and behavioral differences that may be more or less susceptible to age-induced bias than is ADHD diagnosis.
However, there is less evidence on the relationship between school starting age and special education placement. In one study using data from nationally representative surveys, the authors found that an additional month of age decreases the likelihood of receiving special education services by 2 to 5 percentage points (Dhuey & Lipscomb, 2010). However, this study relied on parent reports of disability rather than the more reliable administrative education records or health insurance records used in more recent studies (Marder, 2009). A more recent study that combines Florida education and health records found a similar age effect, with older children in a grade cohort 4 to 6 percentage points less likely to receive special education services from ages 6 to 18 (Dhuey et al., 2019). These results were robust to including prenatal, birth, and family characteristics often hypothesized to be correlated with birth month.
There is mixed evidence of heterogeneity by student characteristics underlying this average effect of school starting age on disability classifications. Overall, boys are more likely to be diagnosed with ADHD than girls, but researchers have found conflicting evidence that the effect of school starting age on ADHD diagnoses is equal for boys and girls (Evans et al., 2010), larger for girls (Ma et al., 2012) or larger for boys (Layton et al., 2018). Similarly, boys are more likely to be placed in special education than girls and there is some evidence that the effect of school starting age on special education identification is larger for boys in the early years (Dhuey & Lipscomb, 2010). There is also some evidence of heterogeneity by race, with larger effects for White students (Dhuey & Lipscomb, 2010; Dhuey et al., 2019). Considering the large literature on disproportionality in special education receipt by race and socioeconomic status (Grindal et al., 2019; Hibel et al., 2010; Jacob, 2005; Morgan et al., 2015; Skiba et al., 2006; Sullivan & Bal, 2013), more evidence is needed to understand the interaction between demographic characteristics and disability identification, particularly at the intersection of race and gender. Finally, age effects may be strongest for students placed for specific disability categories (Dhuey et al., 2019), although evidence of this source of variation is limited.
Why are the Youngest Children More Likely to be Placed in Special Education?
One hypothesis is that the use of peer-to-peer comparisons to inform special education referral practices may lead to higher rates of special education placement for the youngest students in a grade. Younger students could be more likely to be referred to special education because age-typical developmental differences are attributed to signs of disability. Particularly in the early grades, when performance on academic measures and age are highly correlated, we might expect that the youngest children are more likely to be referred to special education because teachers have age-inappropriate expectations for skill acquisition and classroom behavior for the youngest children. Conversely, older students may be less likely to be referred because developmental delays are masked by a developmental age premium. If this is the case, the age of students in relation to their peers may be driving differences in special education identification rates.
Peer comparisons are likely to play a large role in special education placement because the referral and evaluation process relies on parents, teachers, and other education and health professionals to identify and flag signs of disability that may be impacting a child's learning. Although the percent of referrals initiated by teachers is not widely reported, teacher referrals likely make up a large proportion of total special education referrals for school-age children. A number of studies on teacher referral practices, both in special education and gifted and talent education, have found that teacher experience, sense of self-efficacy, and gender-, race-, and ethnicity-related biases impact referral choices (Grissom & Redding, 2016; Klingner & Harry, 2006; Skiba et al., 2006). Peer group comparisons have also been found to impact how teachers assess a child's academic performance through grading practices (Farkas et al., 1990) and who is referred for special education evaluation (Hibel et al., 2010). Similarly, special education disparities by race can be impacted by peer group composition, with minoritized students with the same achievement scores more likely to be placed in special education in predominately White schools but less likely in predominately non-White schools (Elde et al., 2021; Fish, 2019).
Importantly, the special education referral process involves multiple steps, starting with a referral, which may then lead to an evaluation and a subsequent eligibility decision. We might expect that peer-to-peer comparisons are most likely to generate age-at-entry differences at the referral stage, given that evaluations typically involve age-normed assessments. Even so, recent evidence suggests that school psychologists, one of the specialists most often involved in eligibility determinations, often make recommendations that are inconsistent with the data presented during the evaluation process (Sullivan et al., 2019).
Finally, we might expect that peer-to-peer comparisons are more likely to impact the likelihood of placements for disability categories such as speech/language impairment and learning disabilities, which are high-incidence and often identified when a child begins school (National Research Council, 2016). In contrast, many intellectual and physical impairments are lower-incidence, identified prior to school entry, and require medical diagnoses (Dragoo, 2020), and therefore may be less susceptible to peer-to-peer comparison. Understanding how age impacts disability classifications, in addition to overall placement rates, could also result in different practice and policy solutions if these high rates of placement for the youngest children are concentrated in disability categories that often experience shorter durations of service receipt (Woods, 2020).
Current Study
Michigan is an interesting context in which to study heterogeneity in the effect of school starting age on special education placement for several reasons. First, Michigan's kindergarten cutoff date during this period was December 1st, meaning that children could enter kindergarten when they were still 4 years old. This differentiates Michigan from Florida, the other state from which there is causal evidence of the effect of school starting age on special education placements, which had a cutoff of September 1st. Therefore, this analysis provides the opportunity to evaluate whether the findings from Florida replicate in a different state with younger children in both comparison groups.
Second, Michigan's kindergarten cohorts can vary widely in age range across schools given the prevalence of delayed kindergarten entry (i.e., redshirting) and 2-year kindergarten programs (∼20%–23% of all kindergarten students). During the study period, the ages of children in the same kindergarten classroom could range from 4.75 years old to 6.75 years old at the start of school. As the age range of kindergarten classrooms varies considerably in Michigan, the “normative standard” of skill acquisition and classroom behavior that a teacher uses to make special education referrals may also vary for the youngest children in a grade, who can be between 1 and 2 years younger than some of their peers on the first day of school.
Third, while Michigan's overall special education rate is close to the national average, during the study period, students with Individualized Education Plans in Michigan were 10 percentage points more likely to be classified as having a speech or language impairment in K-3 than were K-3 students nationwide (60% vs. 50% nationwide) making the state an outlier in disability classification practices (Department of Education, 2011). This high concentration of speech and language classifications in the early grades provides an opportunity to assess the extent to which age impacts all disability classifications or may be concentrated in classifications that are more common for young children (National Research Council, 2016).
The present study builds on prior research on the effect of school starting age on special education placement by estimating how the effect of school entry age varies across grades, in the types of disability classifications children receive, and by student demographic characteristics. More specifically, I answer the following three research questions.
What is the effect of being young for grade on special education service receipt in each year of elementary and middle school in Michigan? Are children who are young for grade more likely to be placed in special education for certain disability classifications? Are these effects heterogeneous by gender, race/ethnicity, or economic disadvantage at kindergarten entry?
Finally, taking advantage of the variation in classroom age compositions across the state, I conduct an exploratory analysis into whether the impact of being young for grade on special education varies by the age composition of a child's school peers.
Method
Sample
The current study used data from the Michigan Education Data Center (MEDC) which houses the state administrative education data collected by the Center for Educational Performance and Information (CEPI) at the Michigan Department of Education (MDE). The study sample included 1,285,165 first-time kindergarten entrants in school years 2002–2003 through 2012–2013 who had enrolled in a Michigan public school. I followed all first-time kindergarten enrollees for 5 follow-up years after kindergarten eligibility (fifth grade for most students) and for 8 follow-up years (eighth grade for most students) for cohorts one through seven. I observed 89% of the fifth grade sample in follow-up Year 5 and 86% of the eighth grade sample in follow-up Year 8. I did not include students who entered the public schools in later grades (15% of all students in Grades 1–8) because I could not observe whether these students started kindergarten on time or what their special education status was prior to entering the Michigan school system. However, the study sample was nearly identical to the full population of K-12 students on these demographic measures in Michigan during this period (result available upon request). The study sample of first-time kindergarten entrants was 49% female, 68% White, 20% Black, 7% Hispanic, 3% Asian, and 1% other race. Approximately 42% of students qualified for free or reduced-price lunch in their kindergarten school year (at or below 185% of the federal poverty line) and nearly 7% were considered limited English proficient in kindergarten.
Outcomes
The primary outcome of interest is special education identification as measured by a binary indicator for having an Individualized Education Plan (IEP) in their first kindergarten-eligible year and each subsequent follow-up year. I also constructed binary indicators for ever being placed in special education, ever exiting special education, ever reentering special education after exit, and time spent in special education. Finally, I constructed binary indicators for the primary disability associated with each student's IEP in a given year, generating the following disability categories: Intellectual impairment, speech and language impairments, specific learning disability, developmental delay, autism spectrum disorder, emotional impairment, and physical/severe impairment (orthopedic, hearing/visual impairments, deaf-blindness, traumatic brain injuries, and severe multiple impairments). For all measures described above, the indicator was set to missing if the student was not enrolled in a Michigan public school for that school year.
Predictors
Running Variable
The kindergarten cutoff law creates a policy-generated discontinuity in the likelihood that a child will enroll in kindergarten as the youngest in their cohort. The variable that sorts children into being either young for grade or old for grade at this cutoff (i.e., the running variable) is a child's birthday. Using student birthday, I constructed the running variable as a measure of days between the child's fifth birthday and the December 1st cutoff. I centered the variable to have a value of 0 on December 1st so that children born in the 182.5 days before the cutoff have negative values of the running variable and children born in the 182.5 days after the cutoff have positive values.
Eligibility and Enrollment Indicators
The eligibility indicator is a binary indicator of whether a student is eligible for kindergarten entrance at a younger age. Students born between June 1st and the December 1st cutoff were eligible to start kindergarten in the younger half of the age range (between 4.75 and 5.25 years old) and had an eligibility indicator set to 1. Students born after December 1st and before June 1st were eligible to start kindergarten in the older half of the age range (between 5.25 and 5.75 years old) and had an eligibility indicator set to 0. I then constructed a binary indicator for young enrollment set to 1 if a student enrolled in kindergarten between 4.75 and 5.25 years old.
Covariates
I included measures of time-invariant or pre-kindergarten student characteristics in all primary specifications. These include binary indicators of gender and race and ethnicity as reported in the state-level administrative data (Asian, Black, Hispanic, White, and other), socioeconomic status as measured by eligibility for free or reduced-price lunch, receipt of special education services through public preschool or Early On (Michigan's early intervention program), and immigrant status. I also used these covariates to estimate subgroup effects by gender, race/ethnicity, and socioeconomic status.
Data Analytic Strategy
Michigan's kindergarten entrance policy creates an exogenous source of variation in the likelihood that a child is the youngest student in their grade cohort. The kindergarten entrance policy effectively sorts those students who turn 5 on the days leading up the cutoff and the days just after the cutoff into two groups. The first, which I refer to as “young for grade” are those students born on December 1st who were eligible to start kindergarten at approximately 4.75 years old. The second, which I refer to as “old for grade”, are those students born on December 2nd were not eligible to start kindergarten until the following fall when they were approximately 5.75 years old. If the assumptions of a regression discontinuity design hold, comparing the special education outcomes of children on either side of this kindergarten cutoff date allows for a causal interpretation of the effect of being the youngest student on the likelihood of special education receipt.
In the present study, I estimated both the effect of being eligible to be the youngest student in a grade (i.e., the intent-to-treat effect) and the effect of enrolling in kindergarten as the youngest student in grade (i.e., the local average treatment effect). I first estimated an intent-to-treat effect of being eligible to start kindergarten as the youngest student in a grade cohort on the probability of being placed in special education in kindergarten and each follow-up year. Equation (1) is the estimation equation for the intent-to-treat effect, where Y is the outcome of interest for child i in cohort c, Elig is a binary indicator for whether child i is eligible to enter kindergarten at a young age in cohort c, Cutdist is the distance in days between child i's fifth birthday and the December 1st cutoff in cohort c, X′ is a vector of time-invariant or pre-kindergarten student characteristics for student i in cohort c,
Student-Level Heterogeneity
To answer the third research question, I used the same regression discontinuity approach, fitting the primary specification for both the ITT estimates (Equation (1)) and the LATE estimates (Equations (2) and (3)) separately by gender, race and ethnicity, and socioeconomic status (free or reduced-price lunch eligible), using the subgroup relevant bandwidth and functional form. I then plotted the estimated effect and corresponding robust confidence intervals for each subgroup to compare the magnitude and precision of the estimates. I also conducted sub-subgroup analyses to explore the possibility that gender differences vary across racial groups. Finally, I used this approach to conduct an exploratory analysis estimating the effect of school starting age separately in classrooms in the upper and lower quartile of age distribution across the state. This study was not preregistered.
Results
Effect of School Starting Age on Special Education Identification Over Time
In the full fifth grade follow-up sample, students who were eligible to enroll in kindergarten at the youngest age were 2.8 percentage points (p < .001) more likely to be receiving special education services in kindergarten (Table 1). The effect of enrolling in kindergarten as the youngest student in the class was 3.3 percentage points (p < .001), which is a 40% increase in the likelihood of placement. This effect persists through the 5th follow-up year in direction, decreasing slightly to 2.7 percentage points. The magnitude, direction, and pattern of effects was similar in the eighth grade sample (Appendix Table A.1). These year-by-year estimates suggest that the initial higher identification rates of students eligible to enroll at the youngest age in kindergarten are not balanced by higher identification rates of the oldest students in subsequent grades.
Effect of Enrolling as the Youngest in a Kindergarten Grade Cohort on the Likelihood of Special Education Service Receipt in Kindergarten Through Fifth Grade.
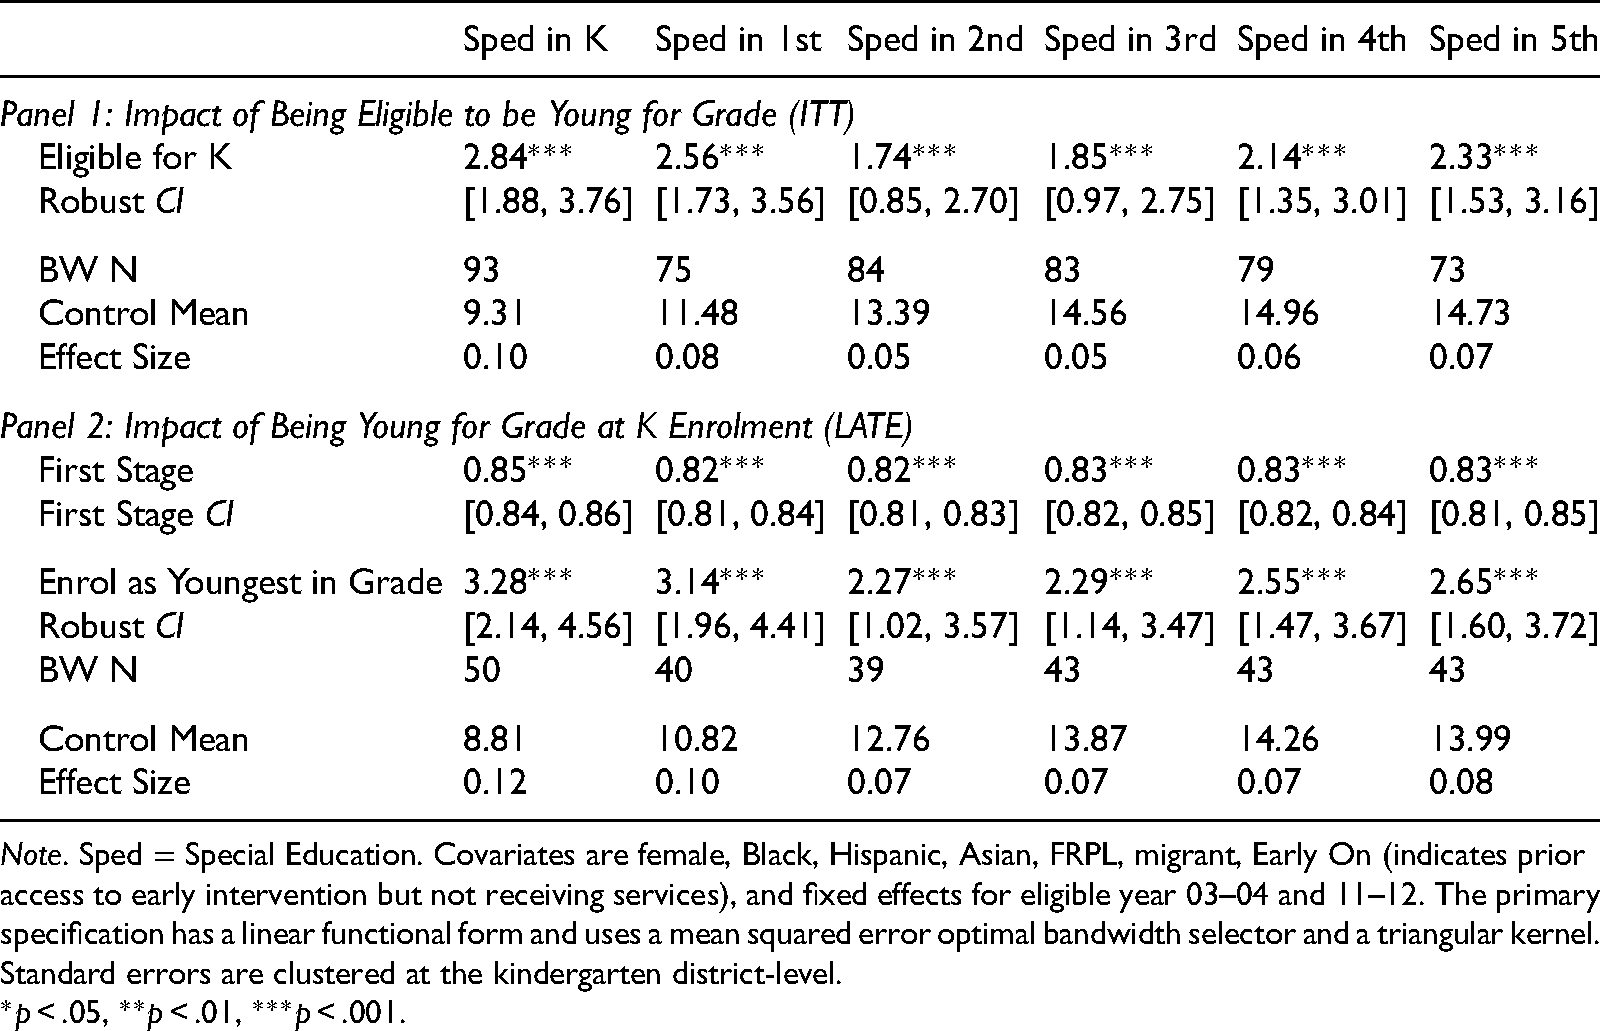
Note. Sped = Special Education. Covariates are female, Black, Hispanic, Asian, FRPL, migrant, Early On (indicates prior access to early intervention but not receiving services), and fixed effects for eligible year 03–04 and 11–12. The primary specification has a linear functional form and uses a mean squared error optimal bandwidth selector and a triangular kernel. Standard errors are clustered at the kindergarten district-level.
*p < .05, **p < .01, ***p < .001.
I also estimated the overall effect on ever receiving services from kindergarten through elementary (for the fifth grade sample) and middle school (for the eighth grade sample) to align with the prior literature (Dhuey et al., 2019). I found that students who enroll as the youngest in grade are 4.24 percentage points (p < .001) more likely to ever receive services than students who are old for grade. They are also 3.90 percentage points more likely to exit special education after starting to receive services (p < .001) and 1.63 percentage points more likely to reenter special education (p < .001; Table 2).
Effect of Enrolling as the Youngest in a Kindergarten Grade Cohort on Special Education Service Duration and Special Education Exit in Kindergarten Through Fifth Grade.
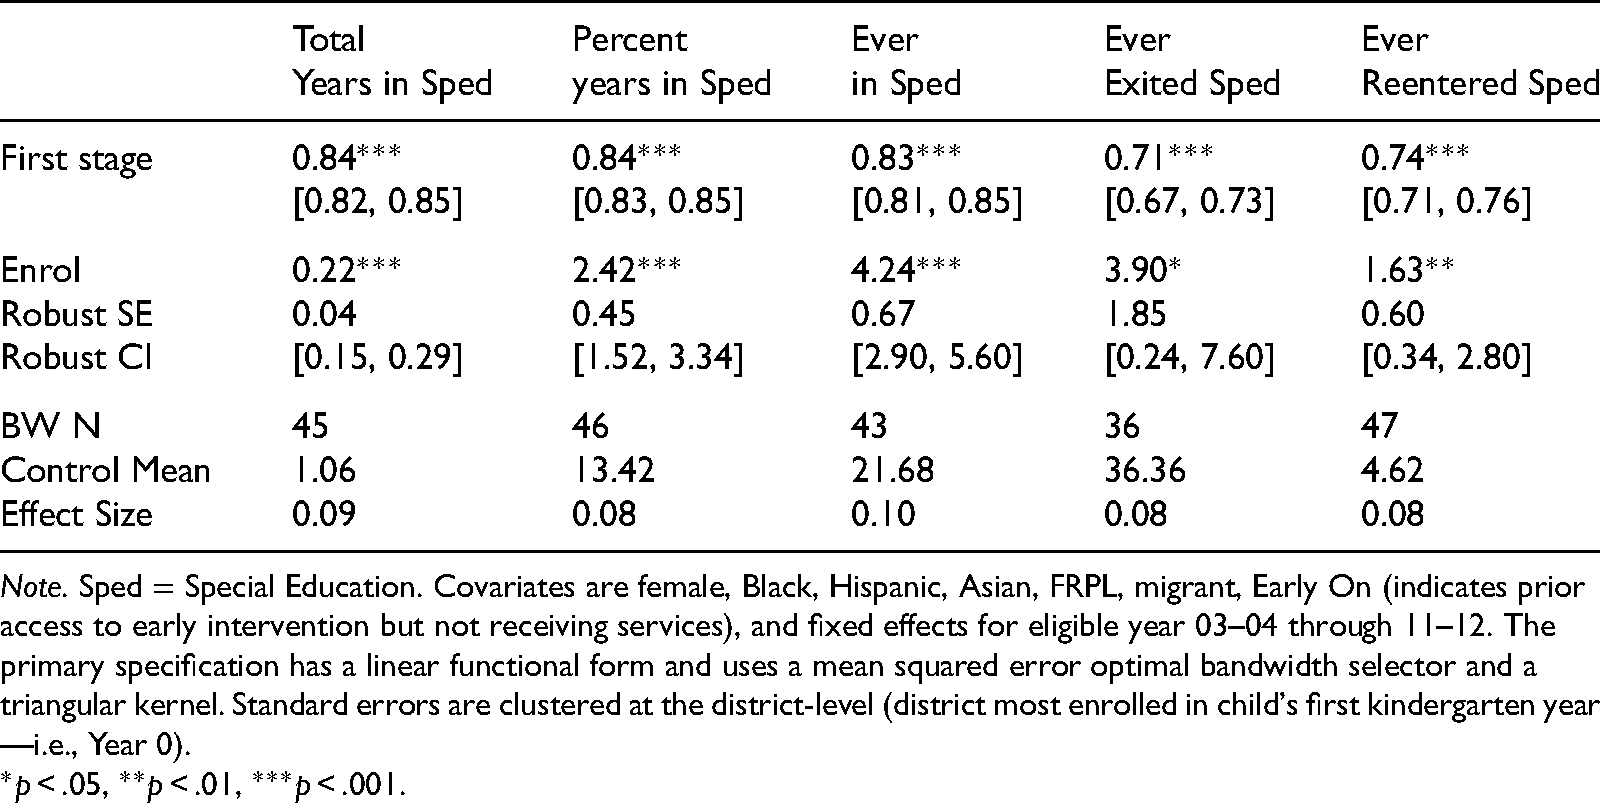
Note. Sped = Special Education. Covariates are female, Black, Hispanic, Asian, FRPL, migrant, Early On (indicates prior access to early intervention but not receiving services), and fixed effects for eligible year 03–04 through 11–12. The primary specification has a linear functional form and uses a mean squared error optimal bandwidth selector and a triangular kernel. Standard errors are clustered at the district-level (district most enrolled in child's first kindergarten year—i.e., Year 0).
*p < .05, **p < .01, ***p < .001.
Taken together, these findings suggest that even as the youngest children who are placed in special education in the earliest grades exit from services at higher rates than their older peers in special education, the children who are placed in special education in later grades are also those who are young for grade at kindergarten enrollment. The youngest children who are placed in special education experience slightly longer spells in special education as well, and are more likely to move in and out of special education placement. In other words, the effect of being young for grade on special education placement is not limited to early grade placements. Placements for young children do not revert to the cohort mean overtime either, despite a substantial fraction of children placed in the early grades exiting from special education throughout elementary and middle school.
Effect of School Starting Age on Special Education Identification by Disability Classification
Following the prior literature, I estimated the effect of being young for grade on ever being placed in special education for specific primary disability categories. I found that much of the effect of ever being placed in special education is concentrated in speech or language impairment classifications. This is not surprising given that over 75% of all kindergarten students with IEPs in Michigan have a primary disability diagnosis of speech or language impairment (Appendix Figure A.2). There are also small (0.8–1.1 percentage points) but statistically significant effects of age on ever being placed in special education for Other Health Impairments (which can include ADHD diagnoses) and for Developmental Delay (a category restricted to children under 8). These effects, broken out by disability classification, indicate higher rates of placement of younger children for disability classifications that can be more subjective in nature.
Variation by Student Characteristics
Figure 1 shows the effect of being young for grade for gender subgroups (boys and girls), race/ethnicity subgroups (White, Black, and Hispanic), and socioeconomic subgroups (disadvantaged and not disadvantaged) in the first kindergarten eligible year. I present these results in standard deviations (SD) of the control group mean to account for differing baseline rates of special education placement across groups. For all subgroups, being young for grade increases the likelihood of being placed in special education in kindergarten by between 0.09 to 0.13 SD. These effects are similar in follow up Years 1 to 5 for all subgroups (see Appendix, Table A.2 for point estimates). These findings do not suggest meaningful heterogeneity in the effect of being young for grade on special education identification by gender, race/ethnicity, or socioeconomic status.
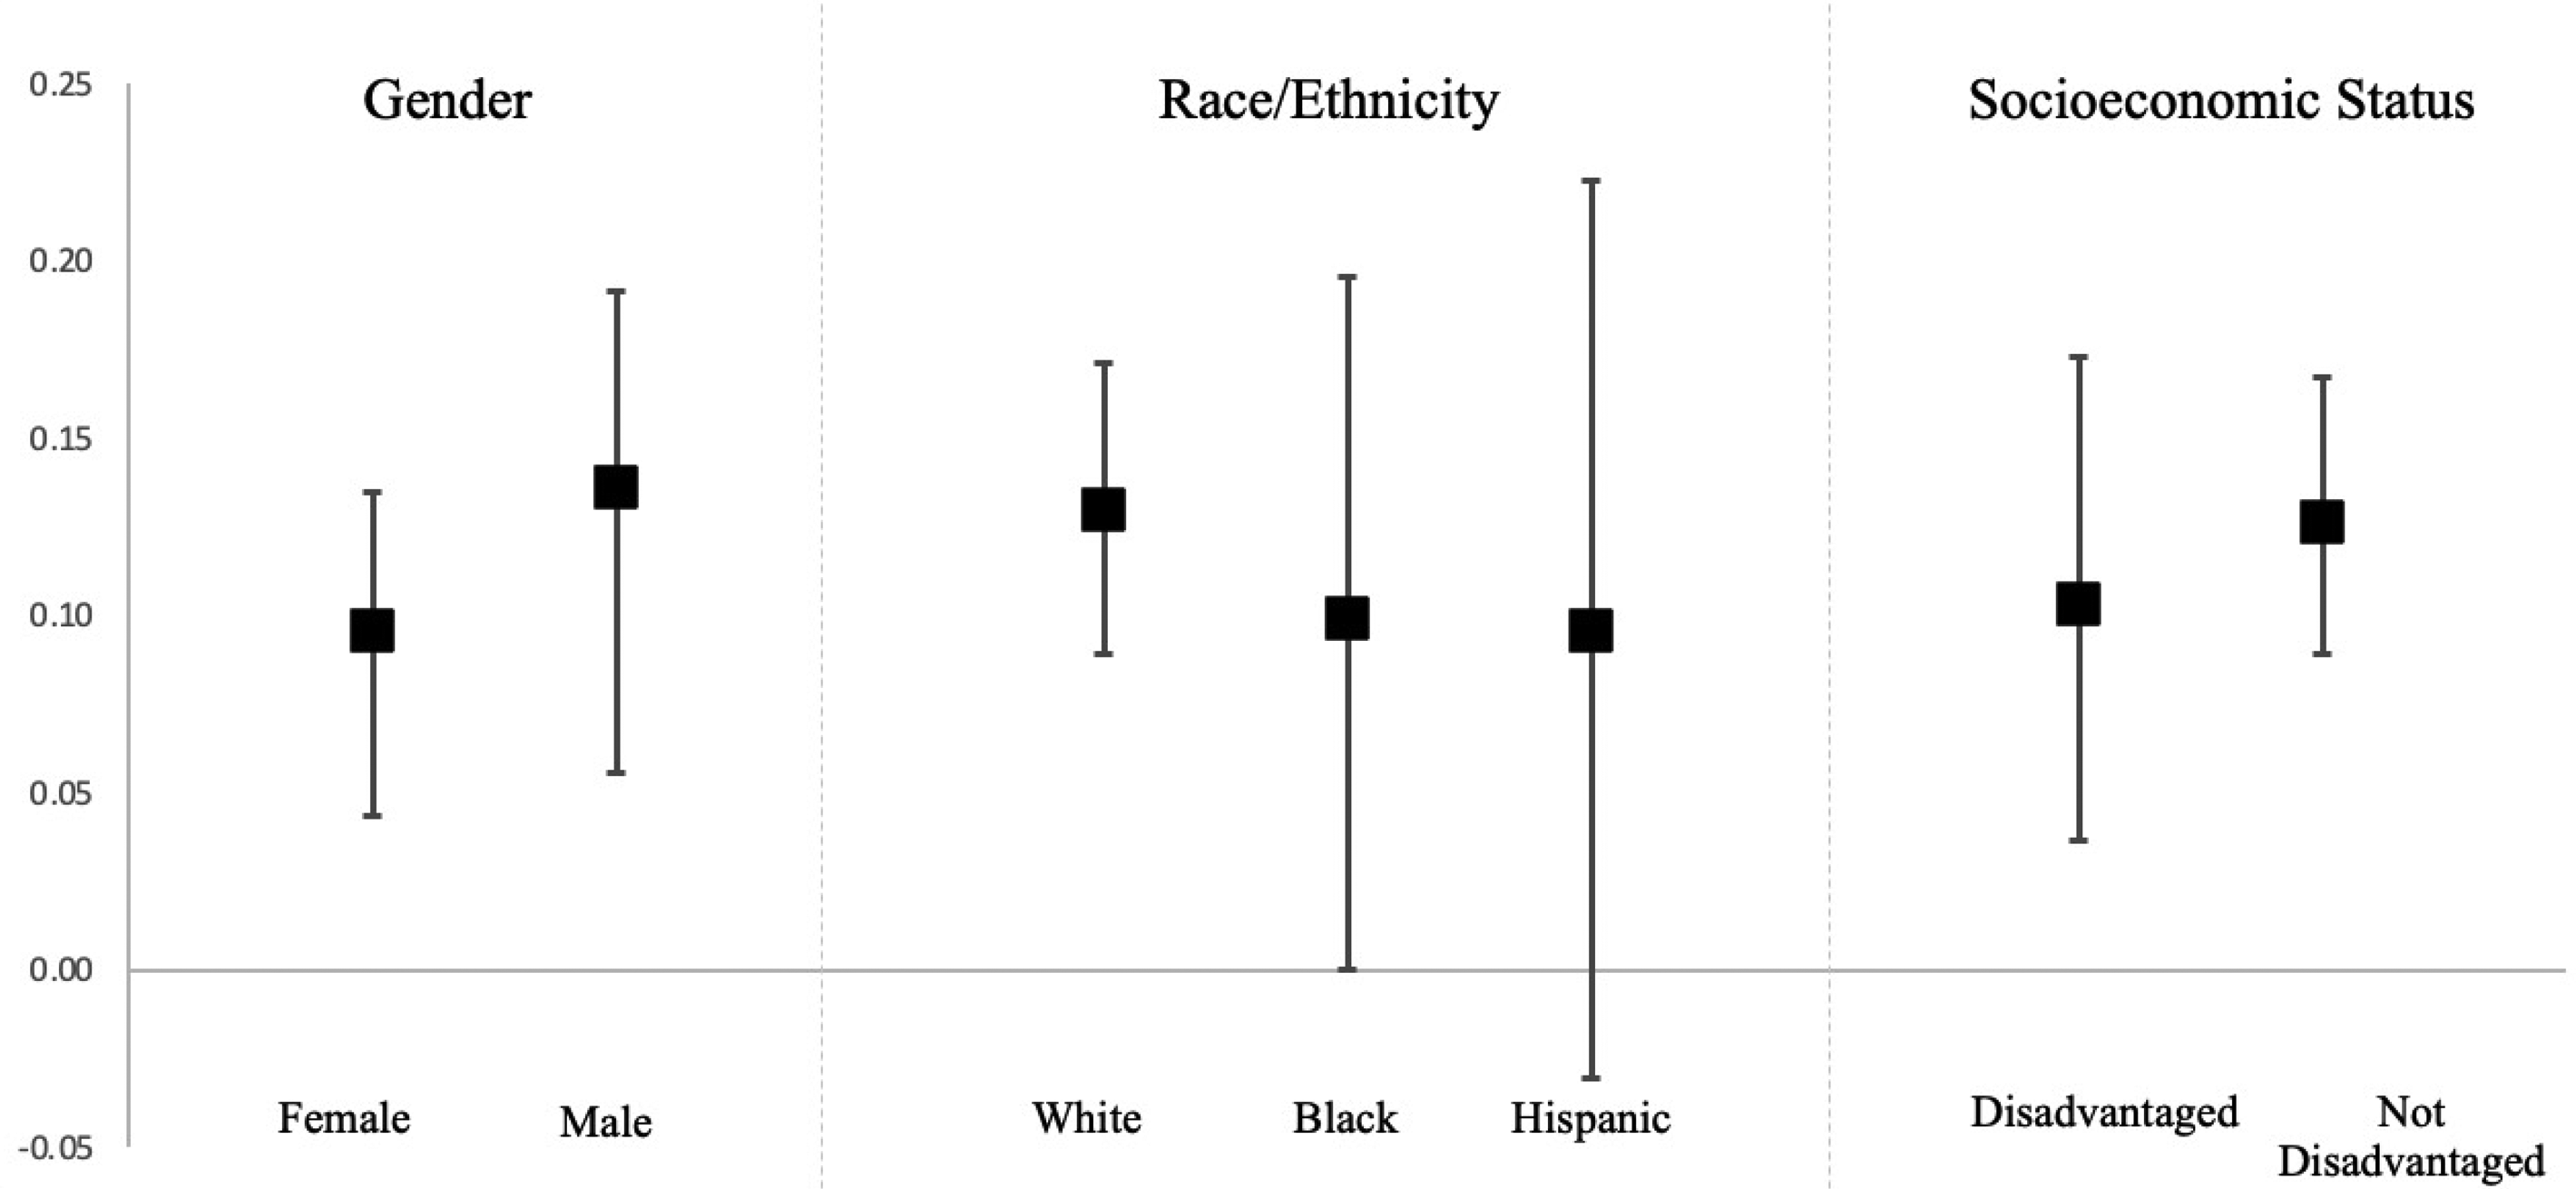
Effect of Being the Youngest in Grade on Special Education Identification in Kindergarten by Gender, Race/Ethnicity, and Socioeconomic Status in Standard Deviations.
Although there is no clear evidence of heterogeneity by race/ethnicity for the full sample, I also estimated heterogeneity in the interaction between gender and race. Figure 2 shows the percent of young students in special education in kindergarten through fifth grade in comparison to their older peers for White and Black girls and for White and Black boys at each time point. The estimated effect of school starting age for White boys is more than double that for White girls in kindergarten and remains larger through the 5th follow up year. In contrast, the estimated effect for Black boys and Black girls is similar in magnitude in kindergarten but increases to triple the magnitude for girls as for boys in the 5th follow up year. In fifth grade, young White boys are four percentage points more likely to be in special education than older White boys whereas young Black girls are six percentage points more likely to be placed in special education than older Black girls.
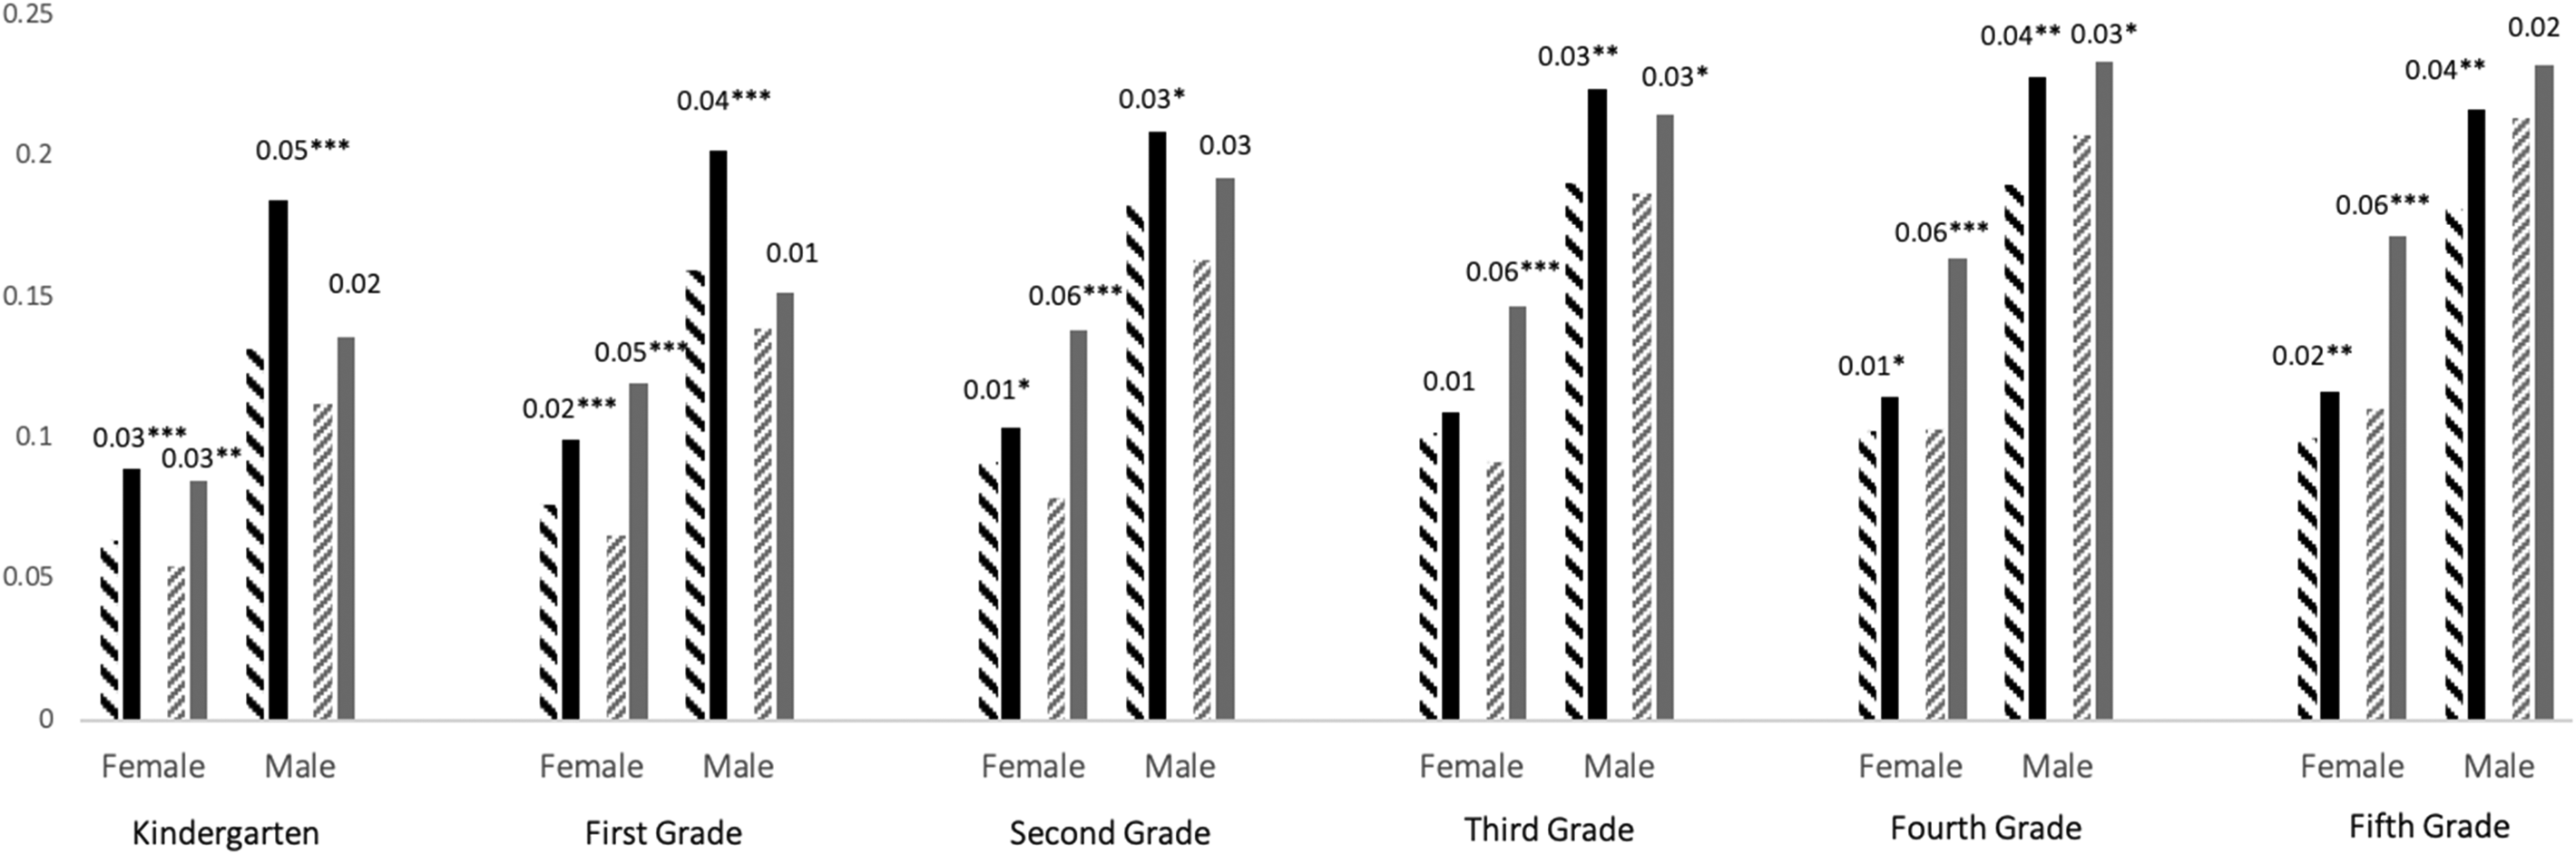
Effect of Being the Youngest in grade on Special Education Identification in Kindergarten Through Fifth Grade for White and Black Students by Gender.
Classroom Age Composition
Using variation in cohort age composition across schools, I also conducted an exploratory analysis to estimate heterogeneity in the effect of being young for grade on special education placement for students in schools with particularly narrow or particularly wide kindergarten cohort age distributions. In Michigan, the age ranges of kindergarten cohorts vary considerably across schools due to differential patterns of redshirting and inconsistent developmental kindergarten program offerings across the state. In schools with wide age ranges, the youngest students, born on December 1st, may have many peers who are a year or even 2 years older than them. In schools with narrow age ranges, the youngest students may have fewer peers who are substantially older than them. However, the parents of students who are eligible to enroll in kindergarten at a young age may select into schools in response to the age composition of the kindergarten cohort. Therefore, while the internal validity of the regression discontinuity design is maintained for estimating the difference in special education placement rates between young for grade and old for grade students, the comparisons in the size of the effect of being young for grade across the two age composition groups should be considered descriptive.
Based on the distribution of the standard deviation of the mean age (σ2) in each school-grade-cohort across my sample period, I constructed two groups. Students in the high variance group were those who enrolled in a school where the kindergarten grade was in the upper quartile of the distribution of ages across the state (σ2 ≥ 0.42), which is approximately 25% of students in the old for grade group, and 33% of students in the young for grade group. Students in the low variance group were those who enrolled in a school where the kindergarten grade was in the bottom quartile of the distribution of ages across the state (σ2 ≤ 0.33), which is around 22% of the old for grade group and 25% of the young for grade group.
Visually, there is a clear discontinuity in the likelihood of being placed in special education in kindergarten around the cutoff for students who were eligible to enroll in kindergarten at a relatively young age in high variance schools. In contrast, there is no clear discontinuity in the likelihood of special education identification around the cutoff for students in low variance schools (Appendix Figure A.3). Using the primary LATE specification from the main analysis, I found that students who enrolled in kindergarten at a young age in a high variance school were 10.7 percentage points more likely to be identified for special education services in kindergarten than their older peers (p < .001 ES = 0.32). In contrast, I found no differences in the likelihood of identification for the youngest students in low variance schools. Similarly, the youngest students in high variance schools for kindergarten were 9.12 percentage points (p < .001, ES = 0.21) more likely to ever be placed in special education in K-8. I found no statistically significant differences in the likelihood of ever being placed for students who enrolled in kindergarten in low variance schools (Table 3). I also conducted these analyses using four age groupings, where the high and low variance schools were each split into high and low mean subsets, and found the same pattern (results available upon request).
Effect of Being the Youngest in Grade on Special Education Identification for Students in High and Low Variance Classrooms.
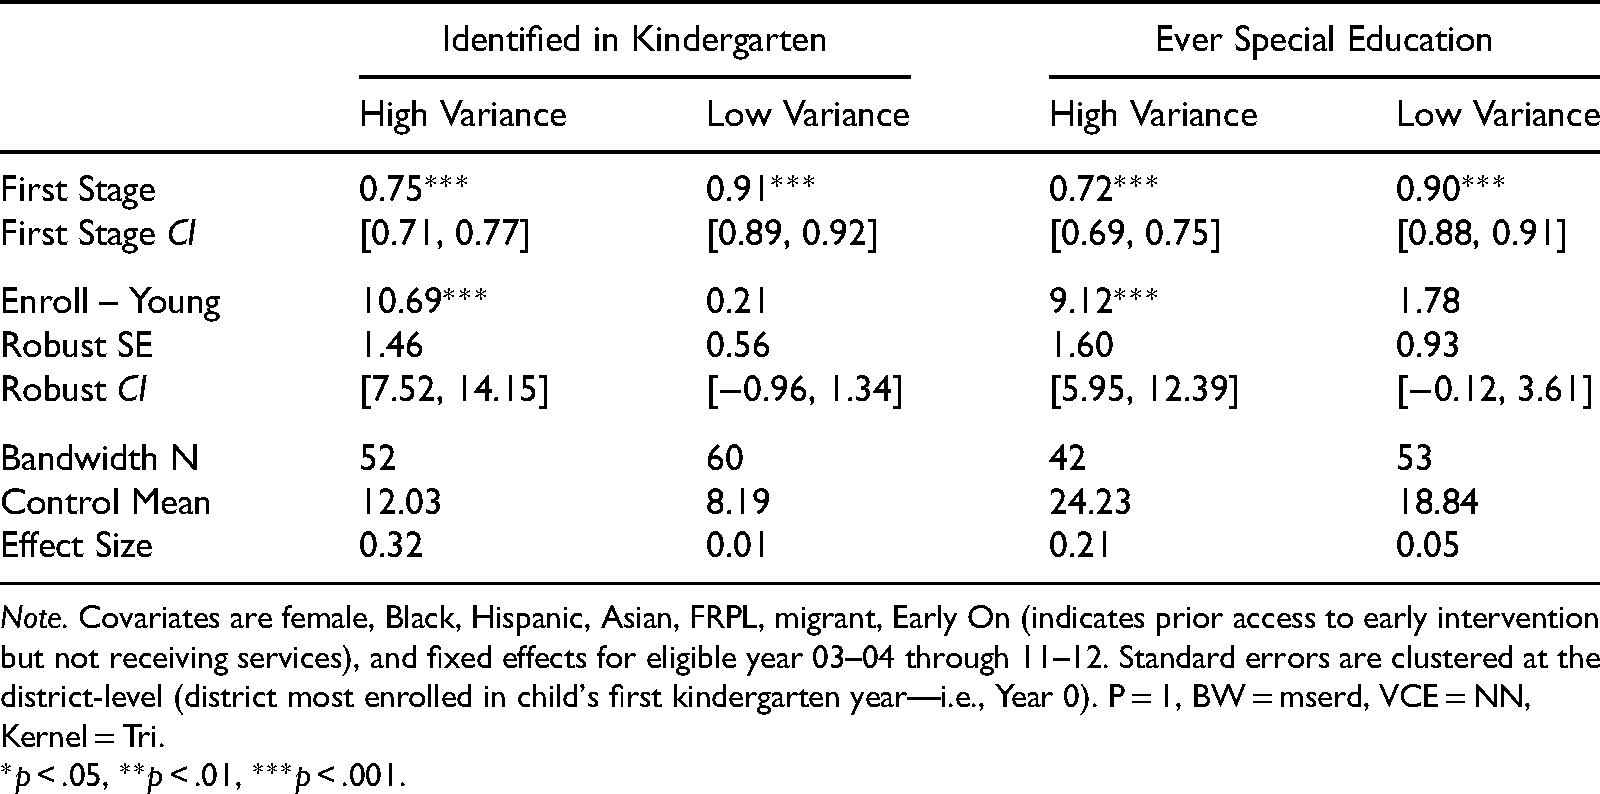
Note. Covariates are female, Black, Hispanic, Asian, FRPL, migrant, Early On (indicates prior access to early intervention but not receiving services), and fixed effects for eligible year 03–04 through 11–12. Standard errors are clustered at the district-level (district most enrolled in child's first kindergarten year—i.e., Year 0). P = 1, BW = mserd, VCE = NN, Kernel = Tri.
*p < .05, **p < .01, ***p < .001.
Robustness Checks
I conducted a series of internal validity and robustness checks following the guidance of the What Works Clearinghouse (2017) and prior literature to test the credibility of a causal interpretation of my findings. First, I assessed the likelihood that parents could influence either the cutoff itself or their position along the running variable in response to the cutoff. Contextually, there is little reason to think that parents could have influenced the cutoff itself, which was a statewide policy dating back to 1979 (Michigan Legislature, 1976). It is also implausible that parents could or would plan their child's birthdate to fall right before or after the cutoff given the difficulty of precisely planning birthdates and the minimal incentive to do so; parents who do not want their child to enroll in school at the youngest possible age can simply choose to delay kindergarten entry until the following year. I found no evidence of statistically significant differences in the density of observations through the cutoff across three statistical and graphical checks, suggesting smooth variation of the running variable through the cutoff (see Appendix, Figure A.4 for more detail).
I also found no evidence of discontinuities in time-invariant characteristics around the cutoff (Appendix, Table A.3) and neither the average impacts nor subgroup impacts were sensitive to bandwidth selection (Appendix, Table A.4) nor to functional form or clustering at the kindergarten school level rather than district (results available upon request). Further, the overall and differential attrition rates for the special education outcomes in follow-up Years 1 to 5 for the full fifth grade sample, and in follow-up Years 1 to 8 for the full eighth grade sample, also fell within the range of tolerable threat of bias under both cautious and optimistic assumptions (What Works Clearinghouse, 2017). Results are also robust for an alternate instrumental variables specification where birthdate is used as an instrument for entering kindergarten in the bottom half of the age distribution (results available upon request).
Finally, I conducted two falsification tests. First, I generated 24 pseudo-cutoffs at two randomly selected dates in each month and tested for a discontinuity in the outcome variables at each of those dates. I found no evidence of a discontinuity at any point other than the true cutoff (Appendix, Figure A.5). I also conducted a falsification test similar to those used in the ADHD diagnosis literature (Layton et al., 2018) using special education classifications unlikely to be effected by school starting age. I estimated the effect of being young for grade on the likelihood of having an IEP for a physical or severe impairment (i.e., orthopedic, hearing/visual impairments, deaf-blindness, traumatic brain injuries, and severe multiple impairments). I found no evidence of an effect of school starting age in kindergarten through eighth grade on likelihood of physical/severe disability classifications. In comparison, I found an effect similar in magnitude and direction to the average effect for receiving services for speech or language impairment, a classification that is more subjective (Appendix, Figure A.6).
Discussion
Students who are eligible to attend kindergarten at the youngest possible age are nearly 40% more likely to be placed in special education in kindergarten as those who are eligible at the oldest possible age (3.3 percentage points, or 0.12 SD). This main effect is strikingly similar to the most recent evidence from Florida, despite Florida's requirement that kindergarten students be 5 years old by September 1st (as opposed to December 1st in Michigan), Florida's considerably larger use of developmental delay disability classifications in early grades, and Florida's substantially larger Hispanic population (Dhuey et al., 2019). This finding adds to the literature, given the relative lack of replication evidence in education research (Makel & Plucker, 2014; Travers et al., 2016).
The present study findings then build on this replication by estimating the effect of school starting age at each year from kindergarten entry through the end of middle school rather than just in the early grades (Dhuey & Lipscomb, 2010) or ever during schooling (Dhuey et al., 2019). The youngest children in a grade are both more likely to exit from services and to subsequently reenter services. The effect of being young for grade also persists both in direction and magnitude over time, indicating that the youngest students are more likely to receive first time placements in the later grades than are the oldest students. In other words, school entry age effects are not limited to the earliest grades and do not appear to resolve over time, either through compensating higher placement rates of the oldest students in later grades or through high exit rates for the youngest children.
I also found little evidence that the effect of school starting age is heterogeneous by gender, race, or socioeconomic status. However, I found exploratory evidence that the age effect was particularly large for White boys in the early grades and for Black girls in the later grades. These findings suggest that age at entry may have heterogenous impacts on the likelihood of special education placement for White and Black girls and boys, and, importantly, that this heterogeneity changes over time. Finally, I also found evidence that the age effect was concentrated in classrooms with wide age ranges, supporting the theory that comparisons of development across age biases special education identification towards the youngest students (Dhuey et al., 2019; Elder, 2010; Hibel et al., 2010; Layton et al., 2018).
These findings have several implications for future research. First, the effect of being young for grade on special education identification has often been interpreted as representing an overplacement in special education or a misdiagnosis of ADHD for the youngest students (Dhuey & Lipscomb, 2010; Elder, 2010; Ma et al., 2012). However, these differences in identification rates could actually indicate an underplacement of the oldest students (Dhuey et al., 2019) or an appropriate allocation of special education services to narrow the developmental gaps between students who are a year apart in age (Bedard & Dhuey, 2006; Elder & Lubotsky, 2006; McEwan & Shapiro, 2008). Estimating the long-term benefit (or cost) of high rates of special education placement for the youngest children in a grade is critical for determining whether policy solutions are needed to address the age-related imbalance in special education identification rates.
Second, and perhaps more importantly, the impact of this age-related disproportionality on the academic and socio-emotional outcomes of children is understudied. Overall, there is evidence that special education services can improve the outcomes of students who may be on the margin of receiving services (e.g., Ballis & Heath, 2021; Hanushek et al., 2002; Hurwitz et al., 2020; Schwartz et al., 2021). Receiving special education services in early grades in particular can be beneficial for students, especially for those with speech-sound or language delays that predict weaker literacy skills in later elementary school (Bird et al., 1995; Bishop & Adams, 1990; Nathan et al., 2004; Peterson et al., 2009; Sices et al., 2007; Skebo et al., 2013). Therefore, the younger students who are induced into special education for speech or language delays because of their age may benefit from these higher identification rates. Similarly, if older students go undiagnosed because their age premium obscures developmental delays, the lower identification rates for the oldest students may have negative effects on their future academic outcomes (Guaralnick, 1998; Odom et al., 2004). On the other hand, special education identification may have negative impacts on students related to stigma, lowered expectations, and placements in restrictive environments apart from typically developing peers (Dowling, 1985; Kauffman & Badar, 2013; Lalvani, 2015; McLeskey et al., 2012; Shifrer, 2013).
Third, the within race gender effects detected in the current study have not been explored in the prior literature on school entry age. While the role of peer-to-peer comparisons in special education placement disproportionality has been studied extensively in relation to gender (e.g., Oswald et al., 2003) and race/ethnicity (e.g., Skiba et al., 2006), and the present study findings add evidence for the role that peer-to-peer comparisons may be a mechanism for age at entry differences in special education placement rates, the findings that age at entry effects vary over time by race-gender groups raises several new questions for future research. Research into the role that age at school entry plays in mediating special education disproportionality by race and gender, for example, could add to our understanding of the complex mechanisms underlying disproportionality in special education placement rates.
Limitations
The present study is limited in several ways. First, the regression discontinuity design estimates the effect of school starting age right at the cutoff, which means that the estimated difference is between the students at the two extremes of the age eligibility range. Thus, these findings may not be generalizable to students who are relatively old or young (i.e., in the bottom or top quartile of age) for their grade but not the youngest or the oldest. Second, while there is little evidence of biasing overall or differential attrition in the follow-up years by pre-assignment characteristics, I find some evidence that the youngest students in a grade cohort who are classified as special education at any point in K-8 are more likely to attrit from the sample in the later years. This pattern of missingness could bias the follow-up year findings toward zero. Third, the present study does not include measures of special education referral separate from identification. Disentangling whether a greater share of the referrals for the youngest students result in eligibility determinations than those for the oldest students or vice versa will provide valuable insight into which aspects of special education identification favor the youngest students.
Conclusion
Special education programs provide individualized instruction and supports to students with eligible disabilities and can be a powerful tool to improve academic outcomes for children with developmental differences. However, a fundamental challenge is correctly identifying those students who will be best served by being placed in special education programs. Longstanding descriptive evidence of disparities in identification rates by sociodemographic characteristics has raised important questions about the equity in special education placement. Future work evaluating reforms to the special education referral and evaluation process, and the impact of higher and lower identification rates on students’ long-term academic outcomes is needed.
Supplemental Material
sj-docx-1-ecx-10.1177_00144029221108735 - Supplemental material for Over Diagnosed or Over Looked? The Effect of Age at Time of School Entry on Students Receiving Special Education Services
Supplemental material, sj-docx-1-ecx-10.1177_00144029221108735 for Over Diagnosed or Over Looked? The Effect of Age at Time of School Entry on Students Receiving Special Education Services by Anna Shapiro in Exceptional Children
Footnotes
Acknowledgments
Thanks to the Michigan Education Research Institute, the Michigan Department of Education, and for feedback from Christina Weiland, Brian Jacob, Nell Duke, Todd Grindal, and participants in the Causal Inference in Education Research Seminar participants at the University of Michigan's Education Policy Institute, and members of the Equity in Early Education Lab at the University of Michigan.
Authors’ Note
This study is funded by the Institute of Education Sciences R305A140059. This research used data structured and maintained by the MERI-Michigan Education Data Center (MEDC). MEDC data is modified for analysis purposes using rules governed by MEDC and are not identical to those data collected and maintained by the Michigan Department of Education (MDE) and/or Michigan's Center for Educational Performance and Information (CEPI). Results, information, and opinions solely represent the analysis, information, and opinions of the author(s) and are not endorsed by, or reflect the views or positions of, grantors, MDE and CEPI or any employee thereof.
Declaration of Conflicting Interests
The author declared no potential conflicts of interest with respect to the research, authorship, and/or publication of this article.
Funding
The author disclosed receipt of the following financial support for the research, authorship, and/or publication of this article: This work was supported by the Institute of Education Sciences (grant number R305A140059).
Supplemental Material
Supplemental material for this article is available online.
Manuscript received November 2021; accepted June 2022.
References
Supplementary Material
Please find the following supplemental material available below.
For Open Access articles published under a Creative Commons License, all supplemental material carries the same license as the article it is associated with.
For non-Open Access articles published, all supplemental material carries a non-exclusive license, and permission requests for re-use of supplemental material or any part of supplemental material shall be sent directly to the copyright owner as specified in the copyright notice associated with the article.